

GDP numbers are not what they seem: how they boost US and UK at expense of developing countries
Courtesy of Ingrid Harvold Kvangraven, University of York
 The World Bank has added its voice to those predicting the global economy will recover faster from the pandemic than previously thought. According to its latest report, global GDP will grow 5.6% in 2021 – a significant upgrade from the 4.1% forecast at the beginning of the year.
Beneath this headline figure are country forecasts that point to very uneven economic recoveries across the world. The US is forecast to grow at a world-beating 3.3%, for instance, while emerging markets and developing economies as a whole are to grow 0.8%.
But if these numbers turn out to be accurate, they’re not telling us an objective truth about how these economies are performing in relation to one another. What most people don’t realise is that the rules about how GDP is calculated are highly political. In my recent research with Jacob Assa of the UN Development Programme, we unpicked how changes to how GDP is measured over the years have disproportionately benefited countries in the west, including the UK. This has enormous implications for everything from the international political clout of different countries to their credit ratings.
Winners and losers
Economic growth was first measured by governments in the 17th century. In the modern era, the United Nations took over responsibility for measuring output in 1953, and was joined in 1993 by the World Bank, IMF, OECD and EU. They all feed into decisions about the international measurement rules, which are taken by the UN inter-secretariat working group on national accounts (ISWGNA), and all countries are meant to comply. This reflects a gradual move away from national governments controlling the statistics to financial institutions having a larger say.
Both in 1993 and again in 2008, the so-called “production boundary”, which determines what is included in GDP, was broadened by the ISWGNA to include many activities that were hitherto excluded or at most seen as intermediate inputs.
Thanks to these reforms, financial intermediation, research and development, and the production of weapons all began to be counted within GDP data across the world. For example, in 1993 the income banks earned on interest from lending to households was included in GDP for the first time. And then in 2008, even bank money that had nothing to do with intermediation services began to be included.
Since western countries such as the UK and US have specialised in these activities in recent decades – the US is first in weapons and second in financial services and R&D, while the UK leads on financial services – the changes have disproportionately benefited their GDP numbers.
The graph below shows the impact by comparing the rest of the world’s GDP as a percentage of the west (blue line) to a proxy of what it would have been if the pre-1993 system had stayed the same (red line – we call this narrow measure value added or NMVA). This shows that the rest of the world’s share of global GDP has risen from about 15% in 1990 to nearly 25% now, but without the changes it would have risen from 20% to about 33%.
Rest of the world GDP as a % of western GDP, 1990 to present day
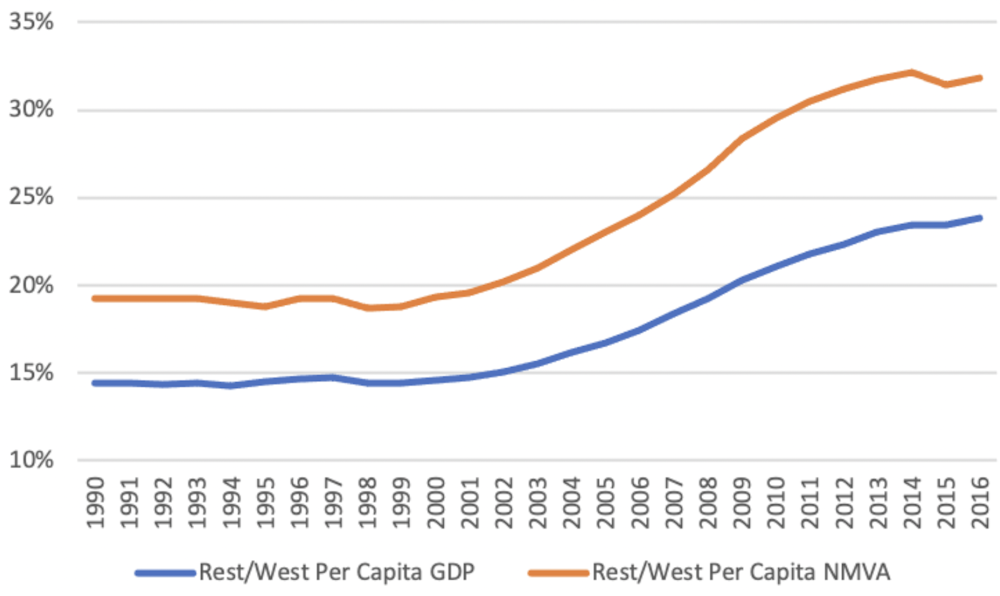
Source: authors’ calculations based on GDP shares from the United Nations Main Aggregates Database (https://unstats.un.org/unsd/snaama/dnlList.asp) and GDP in US$ purchasing power parity from the World Bank. Kvangraven/Assa
The next graph shows how the changes have affected the size of the UK economy. You can see that UK GDP has roughly doubled from US$20,000 (£14,164) to US$40,000 (£28,328) since the early 1990s, but without the changes the doubling would instead have been from about US$10,000 to US$20,000.
UK per capita GDP, 1970 to present day
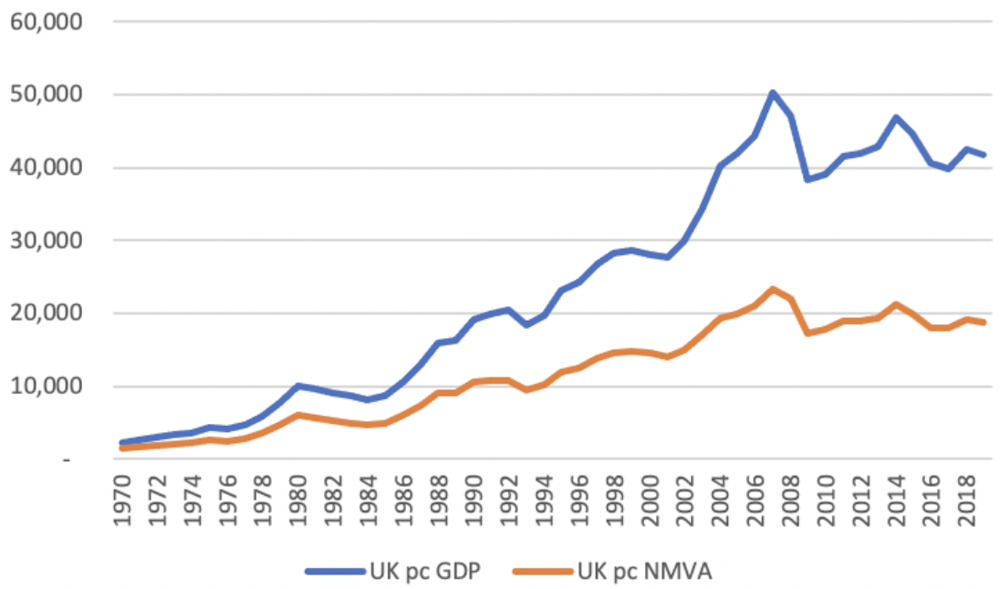
Source: authors’ calculations based on GDP shares from the United Nations Main Aggregates Database (https://unstats.un.org/unsd/snaama/dnlList.asp) and nominal GDP from the World Bank. Kvangraven/Assa
China is one of many countries that has been disadvantaged by these changes to the way GDP is measured. Although it has benefited to some extent by being the biggest spender on R&D in the world, this is outweighed by its relative weakness in financial services. The next graph shows China’s per capita GDP as a percentage of UK per capita GDP, again with and without the changes. As you can see, China’s economy would be considerably wealthier using the “old” measure (35% versus 25% of the UK figure).
China’s per capita GDP as a % of UK, 1970 to present day
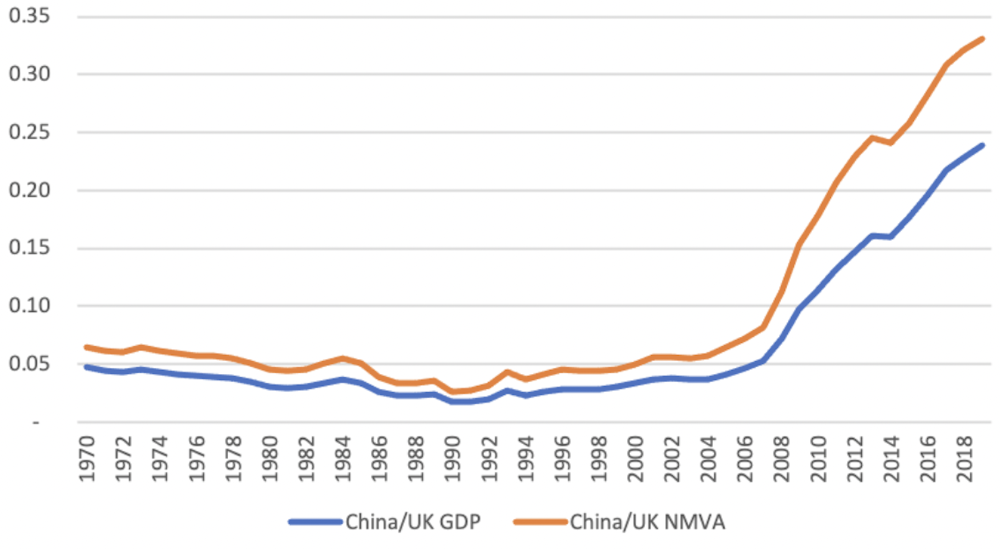
Source: authors’ calculations based on GDP shares from the United Nations Main Aggregates Database (https://unstats.un.org/unsd/snaama/dnlList.asp) and nominal GDP from the World Bank. Kvangraven/Assa
Consequences
Without these changes, non-western economies have in fact caught up with the west to a larger extent than what the GDP data suggest. We therefore need to be cautious about comparing the growth figures of different countries.
There are also various other implications. For example, in international organisations like the IMF and World Bank, a country’s GDP relative to global output helps to determine the size of its voting rights. It also affects certain important ratios like a country’s debt and deficit to GDP, which in turn has the power to shape investor perceptions, credit ratings, and, ultimately, also the rate at which a country can borrow.
Such ratios were also relevant in deciding which countries can be admitted to international bodies like the EU. For example, as we show in our paper, it appears unlikely that Greece would have satisfied the Maastricht Treaty criteria of no more than 3% deficit-to-GDP had the yardstick of how to measure GDP not been moved by then. This is because Greece’s GDP was boosted significantly by the changes to the GDP rules in relation to financial services.
Given the political nature of GDP measurement and its real political and economic implications, we hope that our research can contribute to an increase in transparency regarding changes to measures of production and their implications. More fundamentally, given the additional glaring problems with GDP neither adequately taking environmental concerns into account nor acknowledging the role of household work, we may want to entirely rethink altogether the indicators we employ to measure economic progress.![]()
Ingrid Harvold Kvangraven, Lecturer in International Development, University of York
This article is republished from The Conversation under a Creative Commons license. Read the original article.