

Animated Map: U.S. Droughts Over the Last 20 Years
Courtesy of Carmen Ang, Visual Capitalist
Animated Map: U.S. Droughts Over the Last 20 Years
The Western U.S. is experiencing one of the worst recorded droughts in the last 20 years.
Temperatures from California to the Dakotas are currently hovering around 9-12°F above average—but how bad is the situation compared to past years?
This animated map by reddit user /NothingAbnormalHere provides a historical look at droughts in the U.S. since 1999, using data and graphics from the U.S. Drought Monitor (USDM).
What is the U.S. Drought Monitor?
Over the last two decades, the USDM has been tracking, measuring, and comparing droughts across America.
While droughts can be difficult to classify and standardize, there are various factors that can be used to gauge when a region is experiencing drought. These include measurements of snowpack levels, soil moisture, and recent precipitation.
To track these conditions (and make sense of them), the USDM synthesizes data from a plethora of meteorological sources, including the Palmer Drought Severity Index and the Standardized Precipitation Index.
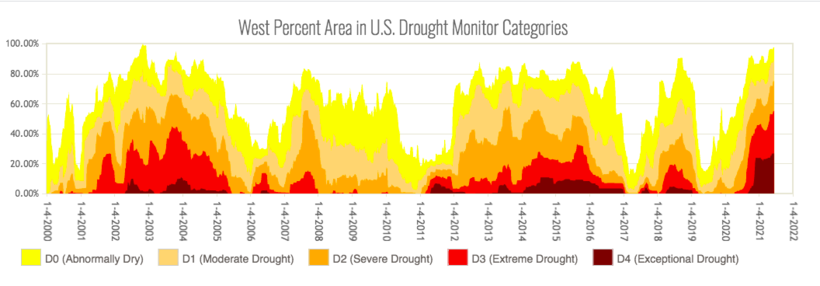
From there, conditions are broken down into categories, ranging from D0 (abnormally dry) to D4 (Exceptional Drought). A map is released each week that shows which states are experiencing drought, and to what degree.
Where Are The Most Drought-Prone Areas?
According to a map created by climatologist Becky Bolinger (which is published on Drought.gov), Arizona and Nevada are the most historically drought-prone states—the two have experienced drought more than 50% of the time tracked by the USDM.
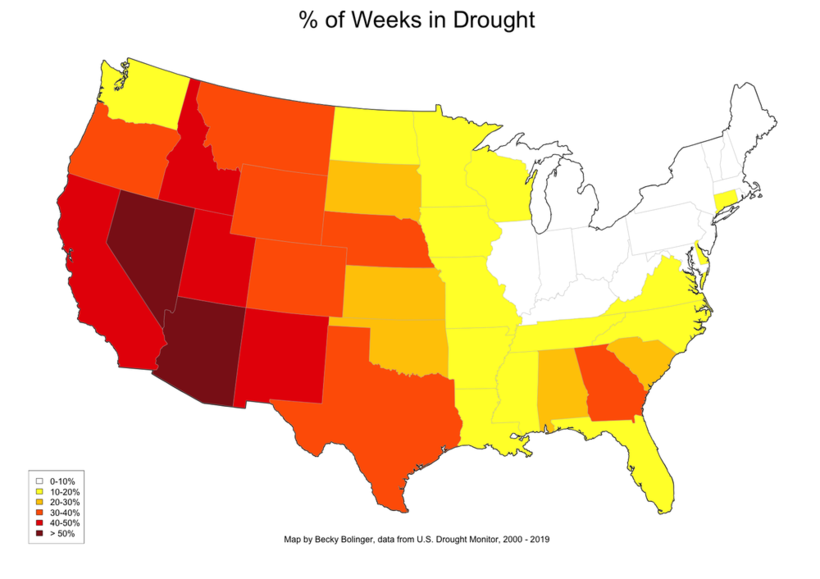
California is high on the list as well, with the state experiencing drought at least 40% of the time.
As the historical data shows, the West is no stranger to droughts. However, this year’s drought has become particularly worrisome because of its intensity and breadth.
Right now, more than a quarter of the West is experiencing a D4 level drought—a new record. To help put things into perspective, here’s a look at how much overall land area in the West has been in drought, since 2000:
When a region is experiencing a D4 drought, possible impacts include:
-
Water Scarcity
Lower reservoirs, combined with decreased snowpack lead to water shortages. -
Crop losses
Water shortages mean less water for fields, which can lead to acres of fallow (unused) farmland. -
Wildfires
Dry conditions and lack of moisture increase the risk of wildfires.
Is This the New Norm?
This record-breaking drought is wreaking havoc across the West. In California, reservoirs have about half as much water as they usually do, and crop failures are happening across Colorado.
The worst part? Some experts believe that this could be the new normal if human-driven climate change continues to increase average temperatures across the globe.