

S&P 500 Dispersion
Courtesy of Michael Batnick
Here are some stats on the S&P 500 year-to-date:
- The market cap-weighted index is up 23.33%
- The equal-weighted index is up 23.17%
- The average stock in the index is up 23.16%
- The median stock in the index is up 21.7%
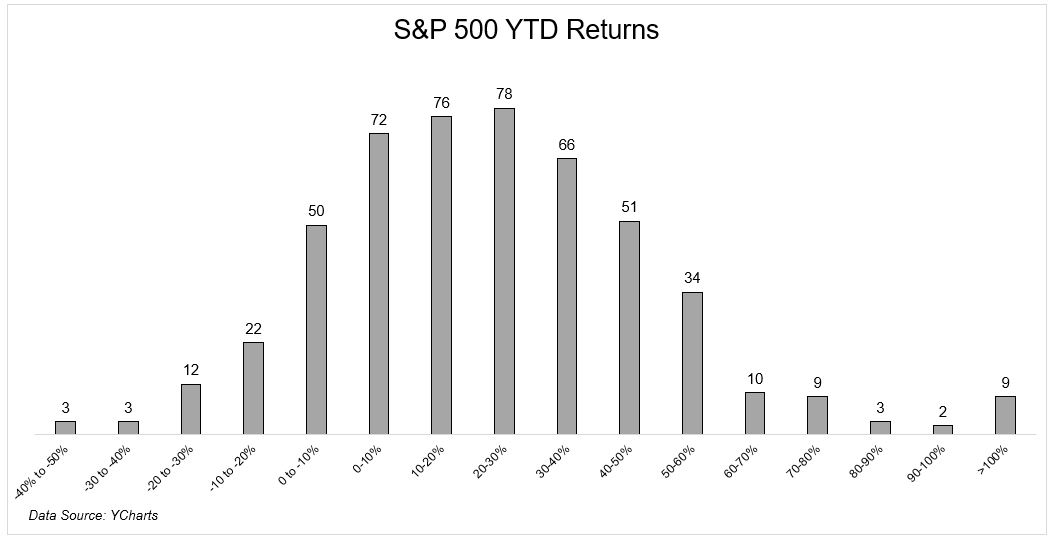
The chart below breaks down the returns by individual components. Just eyeballing this, it seems like returns were fairly normally distributed, which jives with the data above. This stands in stark contrast to the often-quoted idea that just 5 stocks are responsible for all the gains.
Year-to-date returns were normally distributed, but November was all over the place, as you can see in this tweet from Liz Ann.
Josh and I are going to discuss this and much more on tonight’s What Are Your Thoughts?