

By Jacob Wolinsky. Originally published at ValueWalk.
Logica Capital commentary for the month ended February 28, 2022.
Logica Absolute Return (LAR) – Upside/Downside Convexity – No Correlation
- Tactical/dynamic balanced Put/Call allocation – Straddle
Logica Tail Risk (LTR) – Max Downside Convexity – Strong Negative Correlation
- Tactical/dynamic downside tilted Put/Call allocation – Ratio Straddle
Q4 2021 hedge fund letters, conferences and more
Summary:
Fueled by geopolitical uncertainty, the S&P 500 continued its measured march downward, ending (for now) with a violent reversal on February 24th. The peak-to-trough drawdown considering the intra-day low on the 24th was more than -10%, and more than 2.5% lower than the January lows. However, quite surprisingly, VIX failed to make a new high, even given the S&P500’s lower low. This continues the theme of elevated volatility, but, as of the end of February, not yet dramatic fear in the market.
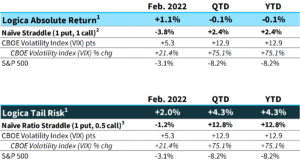
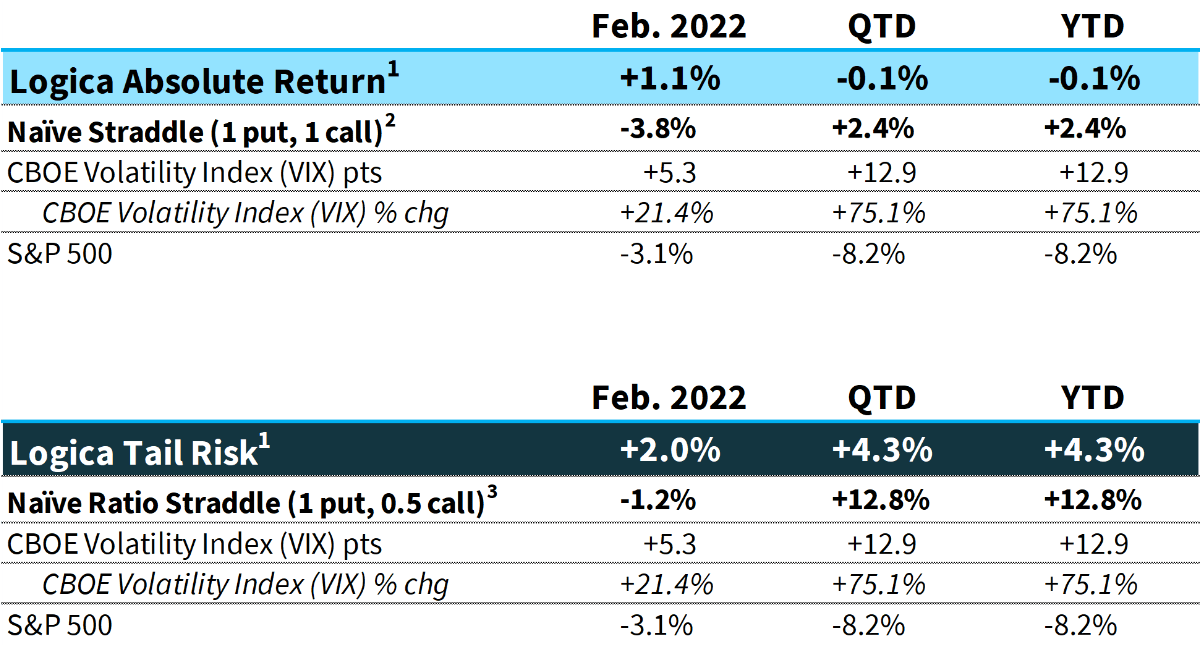
1 Returns are net of fees and represent the returns of Logica Absolute Return Fund, LP and Logica Tail Risk Fund, LP
2 Naïve Straddle Return: a 1.5 month out, S&P 500 at-the-money put and call bought on the final trading day of prior month and sold on the final trading day of current month. This return on premium is divided by a factor of 6 to be comparable to Logica’s typical AUM-to-premium ratio.
3 Naïve Ratio Straddle Return: a 1.5 month out, S&P 500 at-the-money put and at-the-money call (divided by 2) bought on the final trading day of prior month and sold on the final trading day of current month. This return on premium is divided by a factor of 6 to be comparable to Logica’s typical AUM-to-premium ratio.
Commentary & Portfolio Return Attribution
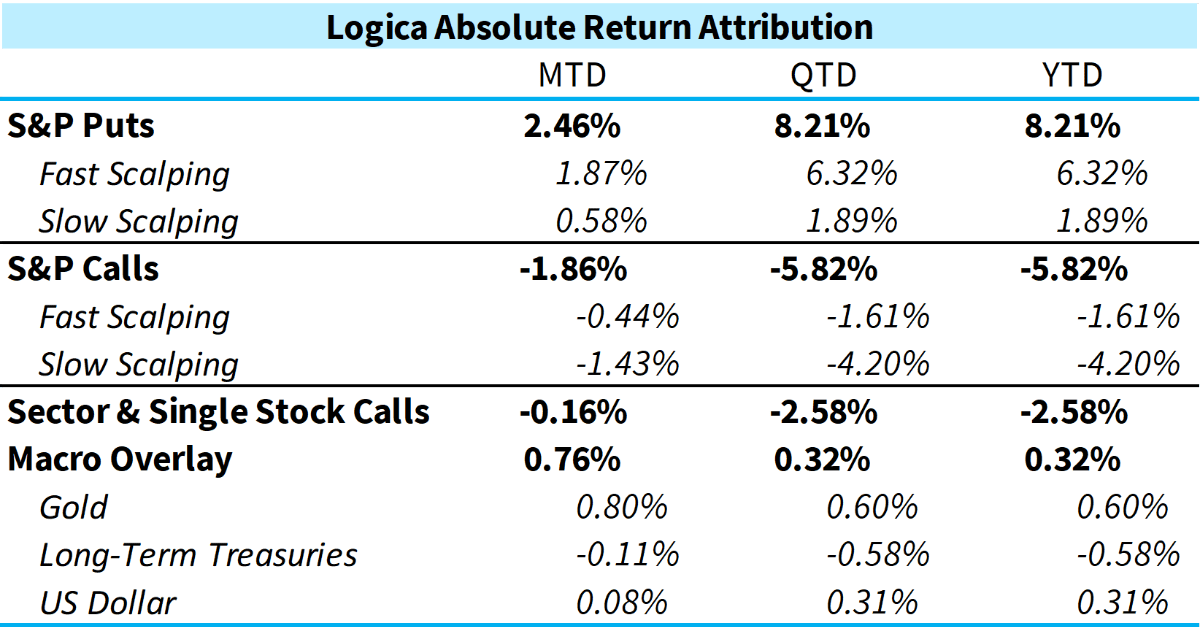
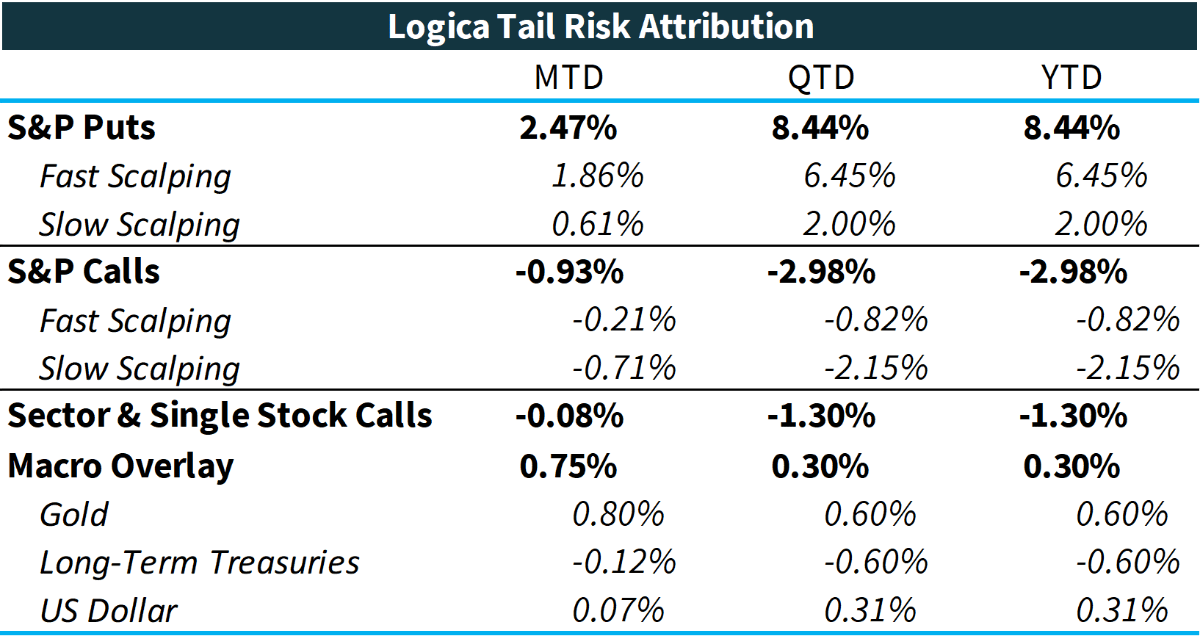
*Attribution returns are composed of daily returns, gross of fees
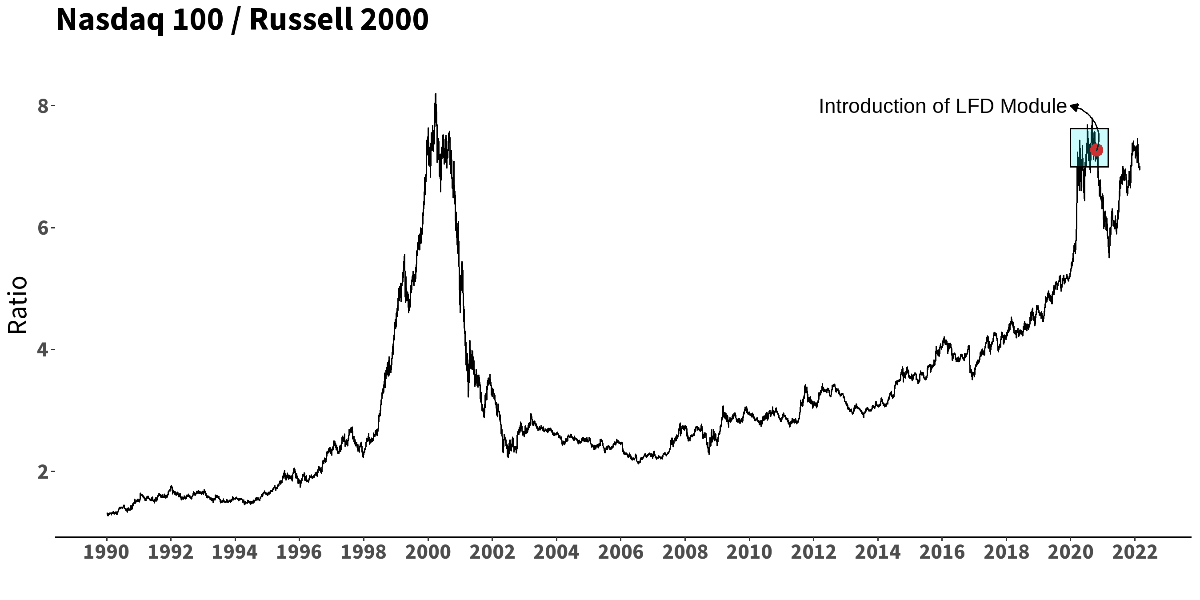
As we’ve previously shared, and as originally built to offset our momentum exposure, LFD tends to more often align with “defensive” exposures that one might see within an index like the Dow Jones and sometimes has some overlap with a smaller cap index like the Russell 2000. As it is long a diverse basket of call options on sector ETFs and single stocks, we would expect it to have a very positive relationship to these broader market indices. Moreover, as rigorous quants, we need to confirm that what we’re seeing is true alpha, rather than some kind of beta and/or risk transfer that poses some as yet unforeseen exposure (instead of a “paper tiger” we might call this “paper alpha”).
As a brief aside, we feel the concept of “alpha” is nebulous. There is a statistical definition which is clear by the math (the y-intercept), and there is a conceptual definition that varies mildly depending on who you ask. Our belief, however, is that the statistical and/or mathematical definition is materially insufficient given the nonlinear dynamics of capital markets. Thus, while we present these metrics below, we look at them more as a helpful guide, only to be considered in proper context and with further investigation of the embedded risks in a source of alpha – some of which may have not yet expressed themselves in a particular timeline, which is common of a return generating process with a negatively skewed distribution: it simply transfers the risk to a later date, appearing to be providing “alpha” in the meantime, but on its journey toward an inevitable risk event.
To that end, we show the results of a multivariate regression:
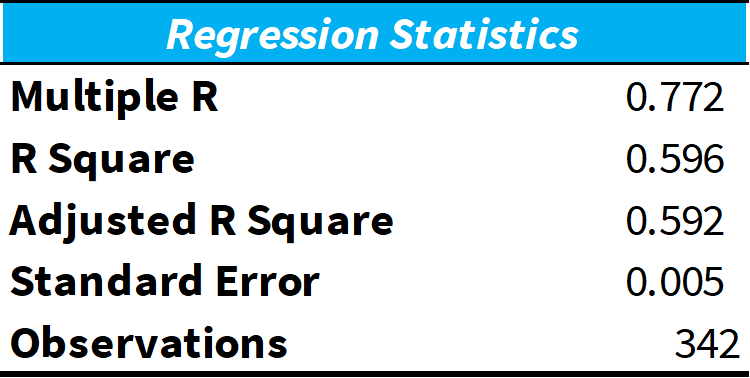
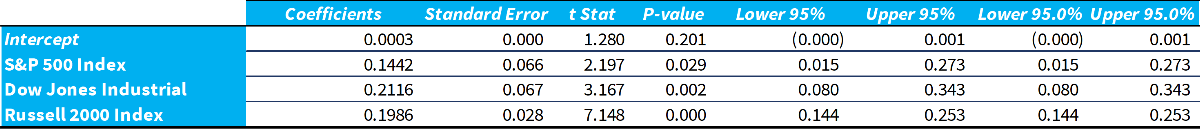
We can see from the R Square value that there is a significant amount of variance unexplained by these 3 major indices. Further, we see a fairly low number for the coefficient for each, meaning the beta of LFD to these indices has been low (the highest individual beta for LFD is the Dow at 0.60). More importantly, we see a positive number for the intercept, or alpha, for LFD, which from our daily analysis, results in approximately 10% annually. Additionally, we can see the Sharpe and Sortino ratios have outpaced all 3 major indices in this comparison:
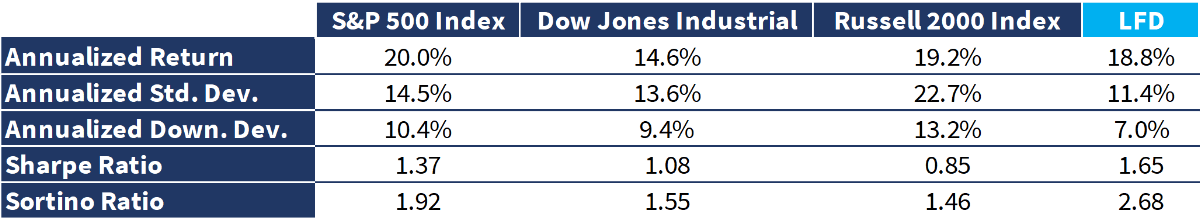
Given these metrics, alongside the lack of explained variance and minimal beta, we are officially comfortable being very proud of this module that was a result of so much R&D prior to its introduction into our portfolio; all with the aim of capturing juicy “right shoulder” payoffs with cheaper convexity, while materially offsetting the existing momentum exposure that previously dominated our up-capture portfolio.
That said, while we present the LFD module’s success, we do so not to celebrate a win while ignoring other parts of the portfolio which may have detracted (at the end of 2021 we wrote about our momentum module lagging its benchmarks, and the changes we implemented as a result), but merely to provide a window so that those curious might be able to better understand our process and results.
Looking elsewhere, we again saw muted returns across some comparable hedge fund and tail risk indices:
HFRX Macro Index: -0.42%
HFRX Equity Hedge Index: +0.34%
HFRX Absolute Return Index: -0.03%
Cambria Tail Risk ETF (TAIL): +1.07%
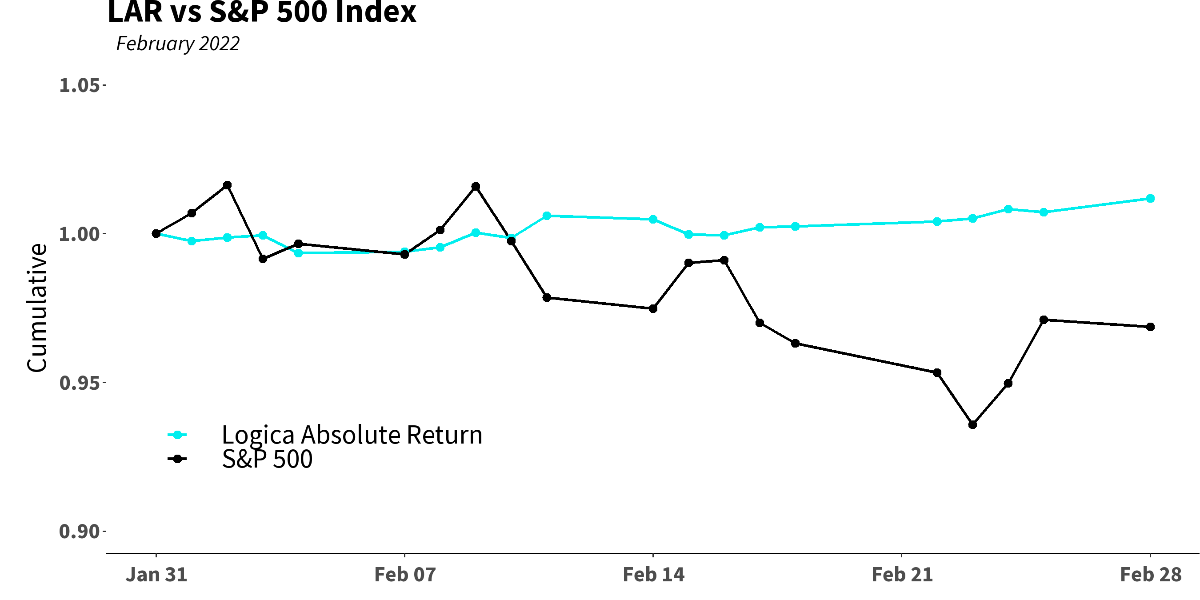
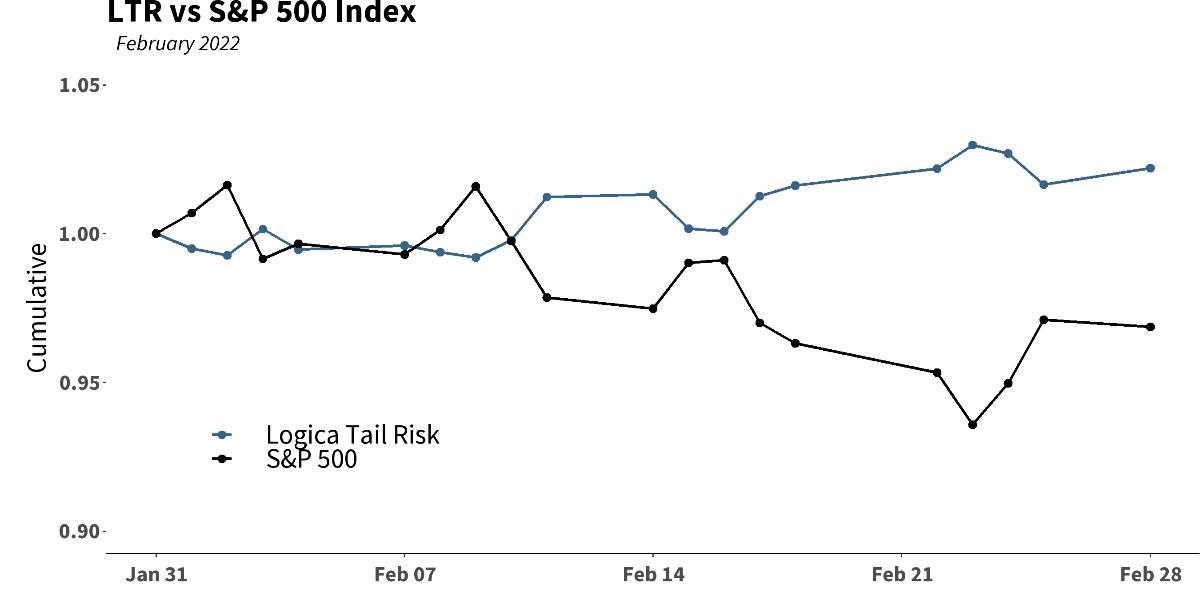
CBOE Eurekahedge Tail Risk Hedge Fund Index: +1.07%**Comprised of Funds that have reported as of 3/10/2022Lastly, we see some nicely uncorrelated and/or negatively correlated behavior when looking at our strategies versus the S&P 500 Index in February:
Logica Strategy Details
If you would like to learn more about our strategies, please reach out to:hello@logicafunds.com
Follow Wayne on Twitter @WayneHimelsein
Updated on
Sign up for ValueWalk’s free newsletter here.