

By Jacob Wolinsky. Originally published at ValueWalk.

Farnam Street Investments commentary for the month of April 2022, titled, “The Boring ’20s.”
The Boring ’20s
Measured from December 31st, 2011 to December 31st, 2021, the S&P 500 returned 16.6% annualized. That’s one of the best decades of return for any market in history.
Where do investment returns come from? What causes a 16% return instead of say 10%, or even a loss? This quarter’s letter will explore one way to suss out the ingredients of returns.
Q1 2022 hedge fund letters, conferences and more
With a bond, your return is straightforward. You lay out money today. You then receive predefined payments (called “coupons”) at regular intervals.1 At the end of the contract, you (ideally) get your principal back. It’s easy to figure out the stream of cash flow from a bond and calculate your return.
But what about investing in the ownership of businesses, also known as buying stocks? When there are no guaranteed payments, how do you determine returns?
Is it the movement of squiggly lines? Some believe in that random walk. But I believe there’s more method to the madness. The price chart is merely an artifact of what’s happening in the real world.
What determines your returns are two things:
- The results of the business.
- The excitement of people about that business’s future prospects.
More accurately, it’s the change in those variables over your measurement period that will dictate your return experience.
Let’s tackle business results first.
At its most basic, we’ll need to know how much money came in, how much money went out, and the number of claims on the business. Money coming in is called Sales or revenue. Money going out is called expenses. The difference between the two is called Margin.2 For every $1 that comes into the business, how many pennies are left over, after paying all the expenses? A business with $100 in sales and $90 in expenses would have a 10% profit margin.
The number of claims on the business is called Share Count. More simply, how much of the ownership pie is yours? Share count can increase if management issues equity for mergers and acquisitions3, or because of stock based compensation to employees. The share count can also decrease as companies buy back their stock.
How people feel about a stock at the beginning and ending of our measurement period greatly impacts returns. We’ll measure this using the familiar P/E Multiple. How much are people willing to pay for the company, per dollar of earnings? A company earning $1m and selling for $10m would have a P/E multiple of 10x.
Lastly, we as owners can receive regular payments, called dividends. We’ll call this Yield4. Think of it like a crop yield. How many bushels of wheat do we get per acre?
The changes in these above quantities during our measurement period gives us the building blocks to describe where returns come from. And thankfully, a friend of mine named Chris Bloomstran5 has put together a series of analyses for us.
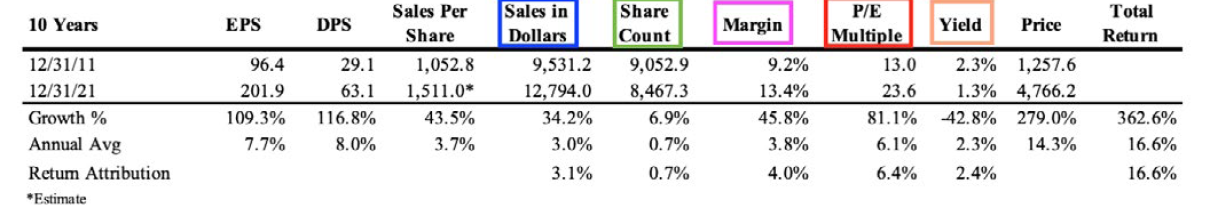
Recall that the S&P 500 put up +16.6% annualized for the last decade. The row called Return Attribution in the table above shows that you got +3.1% return from the growth in Sales, +4.0% due to improvement in Margin, +0.7% from a reduction in Share Count, +6.4% from the change in P/E Multiple, and +2.4% from Yield. You got a win on every front, totaling up to a generous +16.6% per year.
That’s a great result, but how likely are we to see something similar for the next decade? Clues to our future are hiding in the past.
First, let’s rhyme the last decade with one of the all-time great bull decades for investors, 1989 through 1999. The annualized return for the ‘90s clocked in at an eye-popping +18.2% annualized.
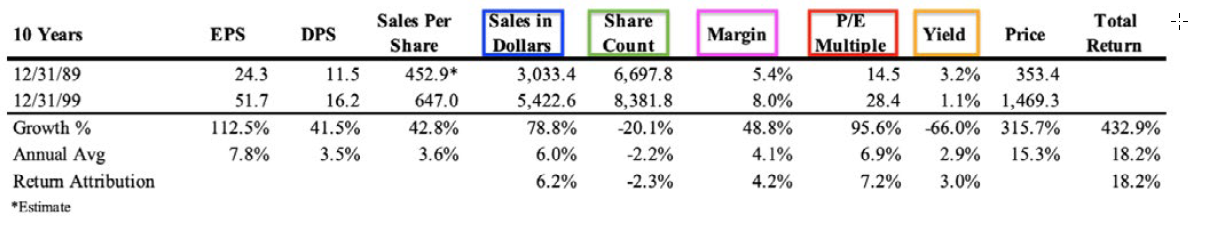
Sales growth contributed +6.2%, Share Count actually increased, hurting you by -2.3% (due to an influx of IPOs creating more shares), Margin expansion gave you +4.2%, P/E Multiple was +7.2%, and Yield contributed +3.0%. Effectively, sales growth from a strong economy and multiple expansion from the frenzied dot.com mania drove your returns. Party like it’s 1999!
Yet after every raging party comes the hangover. What did the next ten years look like? Not great:
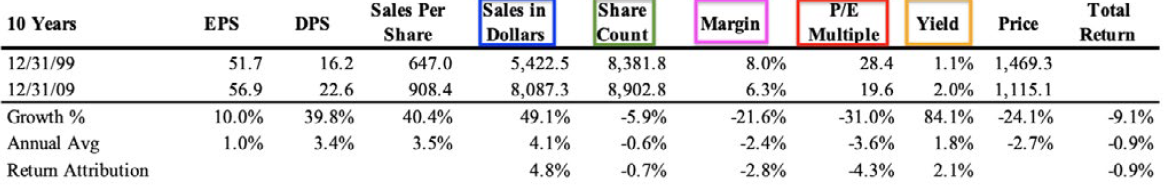
Sales growth contributed +4.8%6, Share Count increased and hurt you by -0.7% (many companies had to issue equity in 2008 just to survive7), Margin contraction cost you -2.8%, P/E Multiple really stung at -4.3%, and Yield contributed its usual +2.1%. Summed up, you got a -0.9% return per year. It was a lost decade for stocks with a total return of -9%. More painful is losing 3,650 days of compounding in an investment lifetime.
History lessons are fun, but I’ll ask the question you really want to know: what can we expect for the 2020s?
Let’s work through each of our variables and see what they tell us. You’re free to substitute your own assumptions into this framework and let me know what you come up with.
The Sales growth over the last 20 years for the S&P 500 has been a 3.0% annual rate. This makes sense as that’s around GDP.
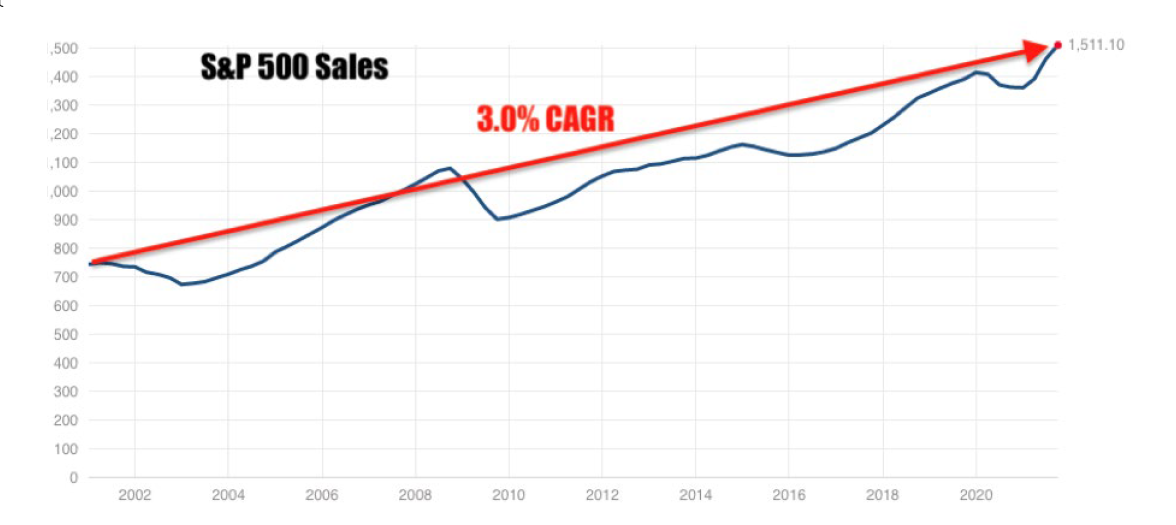
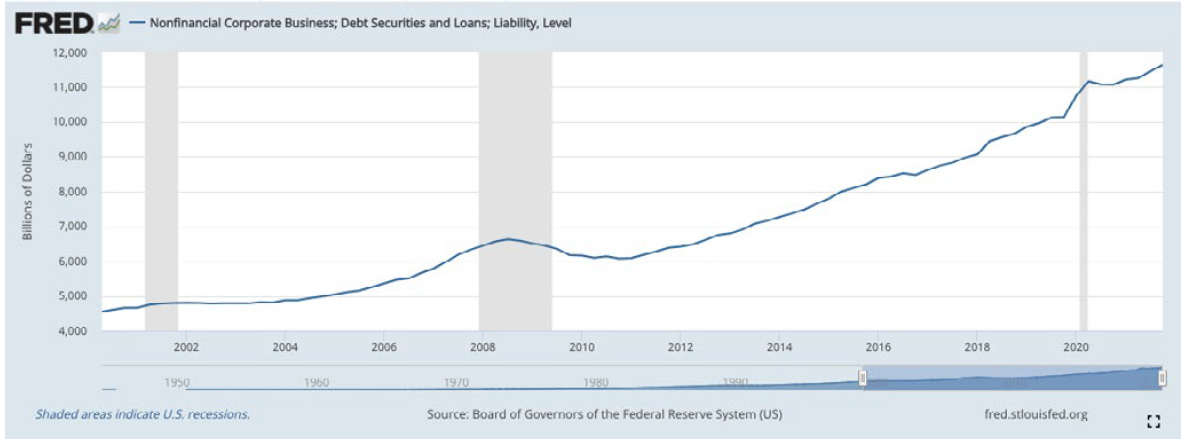
I’m personally not willing to underwrite more than a continued +3.0% sale growth contribution into a forward projection. Ballooning debt levels at corporations (see below chart) and massive debt at every level of government could make that 3.0% growth optimistic. Remember that governments can never create resources, they can merely redirect them.
Share Count shrunk considerably in the last decade.
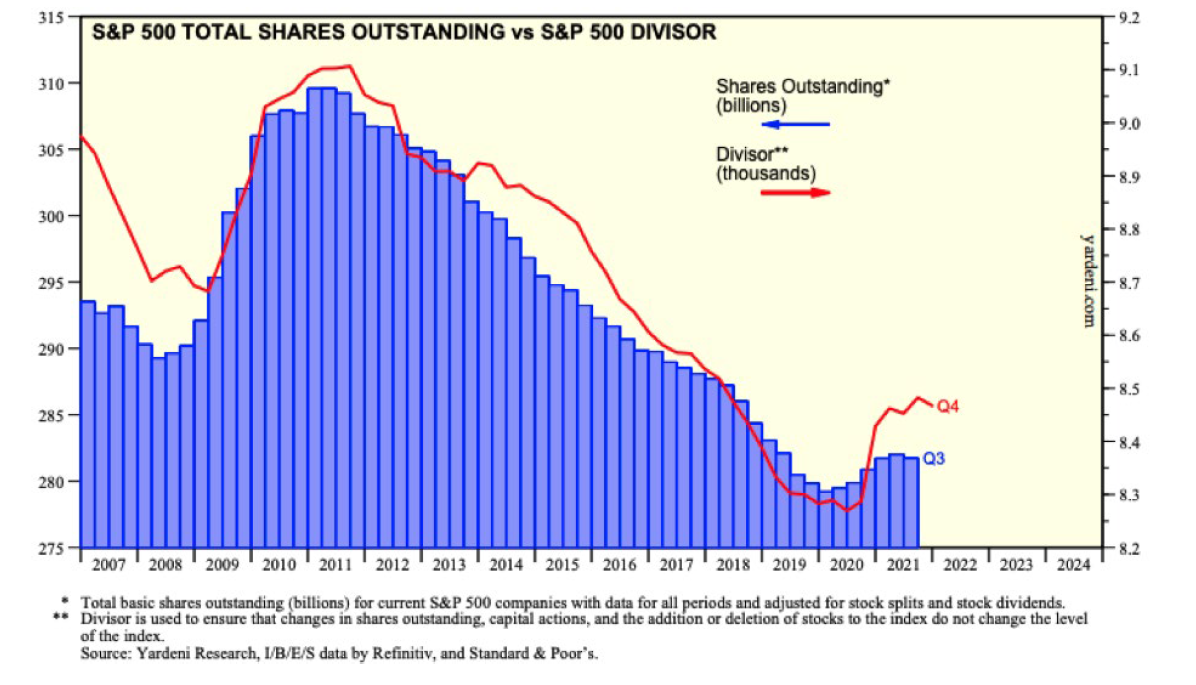
Much of the resources for buybacks over that time came from companies issuing debt to hoover up their own shares. With rates near zero and management incentive compensation plans tied to earnings per share, this result probably shouldn’t surprise us.
Perhaps Corporate America can keep issuing debt and reducing their share count over the next decade, but I think it’s more realistic to assume there’s no change in share count, giving us a +0.0% return contribution. Issuance of equity is not out of the question. I certainly don’t anticipate pulling the debt lever to the same degree as we did the last ten years. And it will become harder to do self-leverage-buyouts if interest rates were to increase.
Next up is Margin. Getting a fix on this one is complicated. My certainty of prediction is low. We’ll set the stage with two quotes:
“Profit margins are probably the most mean-reverting series in finance, and if profit margins do not mean-revert, then something has gone badly wrong with capitalism. If high profits do not attract competition, there is something wrong with the system and it is not functioning properly.” – Jeremy Grantham
“In my opinion, you have to be wildly optimistic to believe that corporate profits as a percent of GDP can, for any sustained period, hold much above 6%.” – Warren Buffett
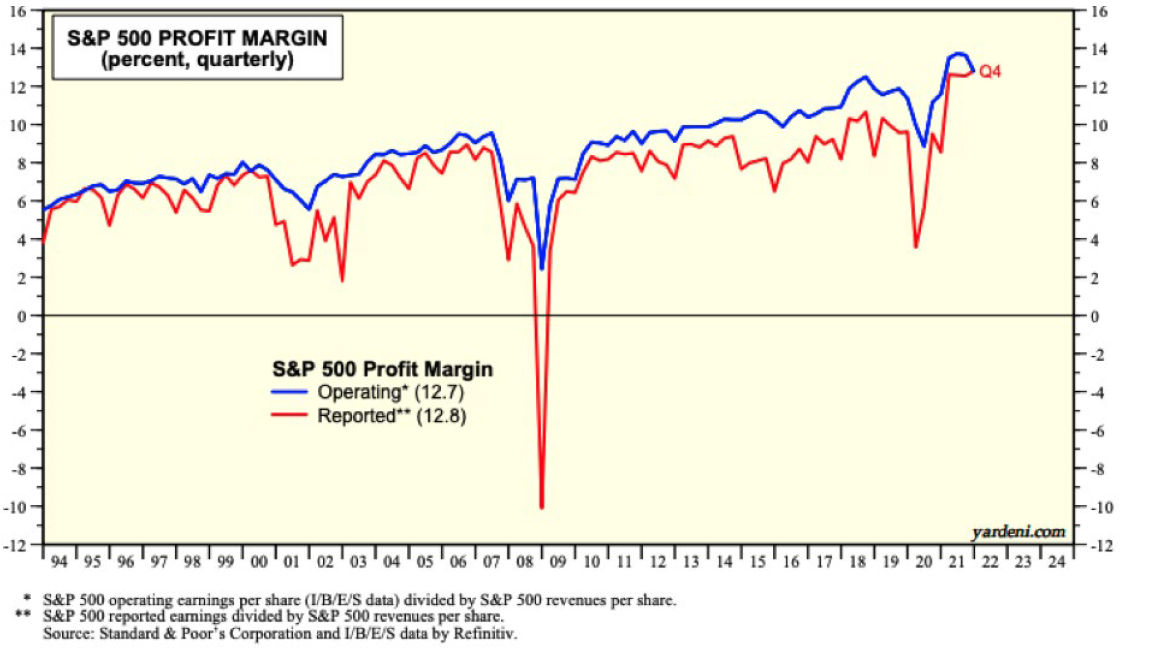
Today we’re around 13%, more than double what Mr. Buffett would tell us to expect. OK, but we’ve also been above Uncle Warren’s 6% for quite some time.8 This is in large part due to the fabulous profitability of the big tech companies.9 Apple, Microsoft, Google, Amazon, and Facebook are terrific businesses operating at massive scales. Their amalgamated profit margins have been in the 20-23% range the last decade, on huge sales figures. It’s quite possible the returns to scale of large networked internet businesses keep profit margins well above what capitalism has historically allowed.
But with enough time, everything is eventually a toaster. Fat profits attract competition and sow the seeds of complacency. Disruption lurks in a garage–on which continent that garage is located is anyone’s guess for global scale businesses. Who knows how long Big Tech’s competitively advantaged period will last?
Meanwhile, if you listen to corporate conference calls, inflation is driving up input costs and threatening the margins of many businesses. It’s hard not to feel like globalization may have crested and the pendulum is swinging the other way. There are second and third order effects to these massive sea changes. Inflation and deglobalization will create winners and losers, but I’d personally fade general profit margins back toward Mr. Buffett’s 6%, pinching the expected return over the next decade by -3.0%. You could talk me into keeping that at zero, but increasing from here would be a tough sell.
Yield has typically lived in the 1-3% neighborhood. Let’s pencil in +2.0%.10
We’ve saved the best for last. The P/E Multiple is currently at 37x.11 The long run mean is around 17x.
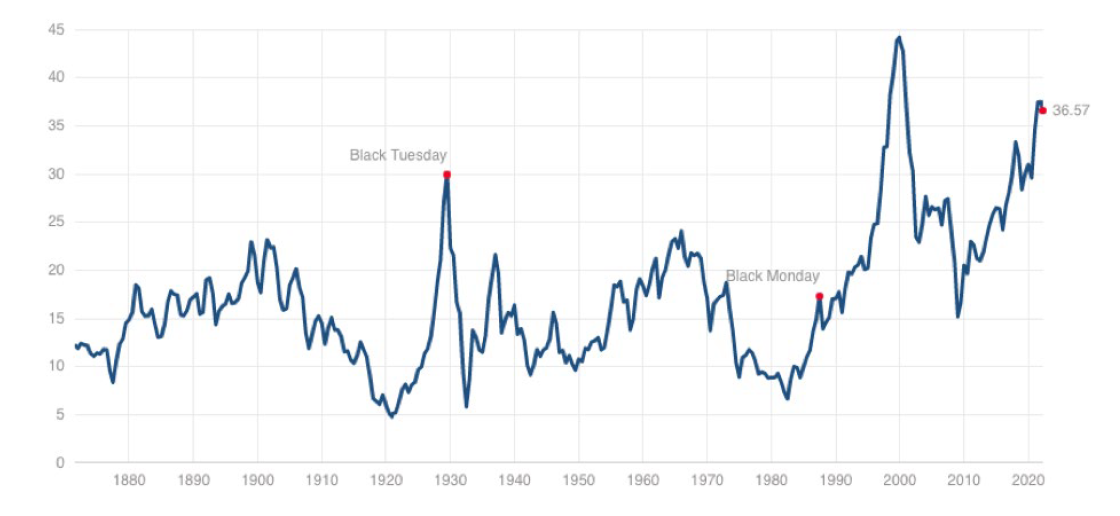
Looking at the above chart and assuming that trees don’t grow to the sky, I don’t think it’s unreasonable to use a similar P/E Multiple return contribution from the 1999-2009 time period, which would be a -4.0%. Sobriety and reversion to the mean are painful.
Summing it all up:
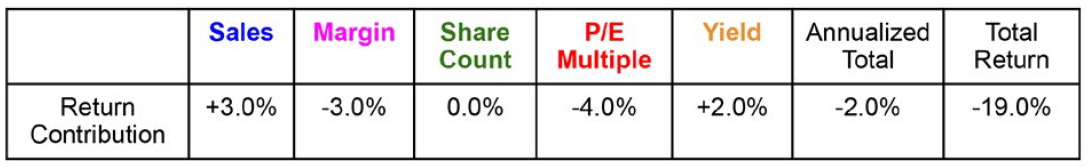
I wish I had better news for all the indexers out there. These bearish numbers may come as a particular shock, as polls have shown US Investors expect long-term returns to be 17.5%. Extrapolating from the last decade’s largesse is likely courting heartache.
I’m certainly open to rebuttals, but they must show which of these variables you believe contains the wrong assumptions. Because these are the factors that will drive returns over the next decade.
The good news is, not every company will mirror the S&P 500. There will be intelligent things to do. In the next letter, we explain how investors might salvage the Boring ‘20s12 and have a shot at acceptable results.
Quick Housekeeping Item
Part of being a registered investment advisor with the State of California means providing compliance updates and disclosures annually. Here’s where we keep the most up-to-date documents for our clients: https://www.dropbox.com/sh/sp5mqetpcwrjc1b/AABxGZXC6vKI-AFosZam6xita?dl=0
As always, we’re thankful to have such great partners in this wealth creation journey.
Jake
Updated on
Sign up for ValueWalk’s free newsletter here.