

By Jacob Wolinsky. Originally published at ValueWalk.

Logica Capital’s commentary for the month ended April 30, 2022.
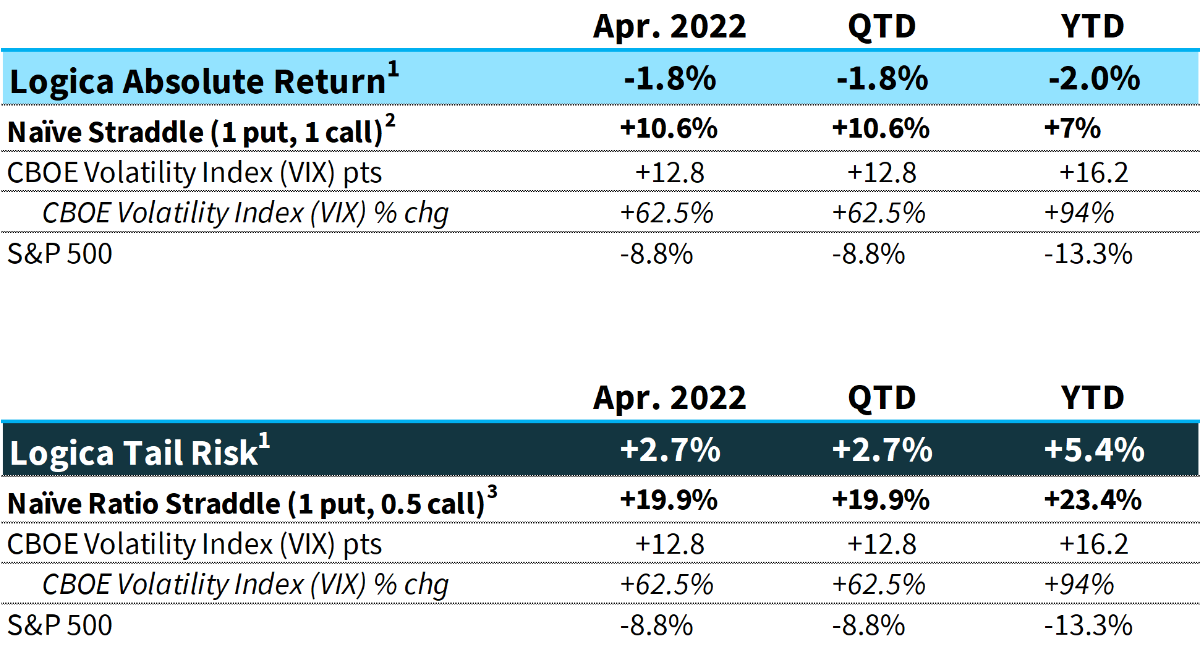
Logica Absolute Return (LAR) – Upside/Downside Convexity – No Correlation
- Tactical/dynamic balanced Put/Call allocation – Straddle
Logica Tail Risk (LTR) – Max Downside Convexity – Strong Negative Correlation
- Tactical/dynamic downside tilted Put/Call allocation – Ratio Straddle
Q1 2022 hedge fund letters, conferences and more
Summary
The S&P 500 Index closed the month at its lowest point since May 2021. Implied Volatility (IV) rose during April, albeit still exhibiting a “linear” rise rather than a “convex” rise when compared with similar drawdowns over market history.
1 Returns are net of fees and represent the returns of Logica Absolute Return Fund, LP and Logica Tail Risk Fund, LP, respectively. Past performance is not indicative of future results.
2 Naïve Straddle Return: a 1.5 month out, S&P 500 at-the-money put and call bought on the final trading day of prior month and sold on the final trading day of current month. This return on premium is divided by a factor of 6 to be comparable to Logica’s typical AUM-to-premium ratio. For illustration purposes only.
3 Naïve Ratio Straddle Return: a 1.5 month out, S&P 500 at-the-money put and at-the-money call (divided by 2) bought on the final trading day of prior month and sold on the final trading day of current month. This return on premium is divided by a factor of 6 to be comparable to Logica’s typical AUM-to-premium ratio. For illustration purposes only.
Logica Capital’s Commentary & Portfolio Return Attribution
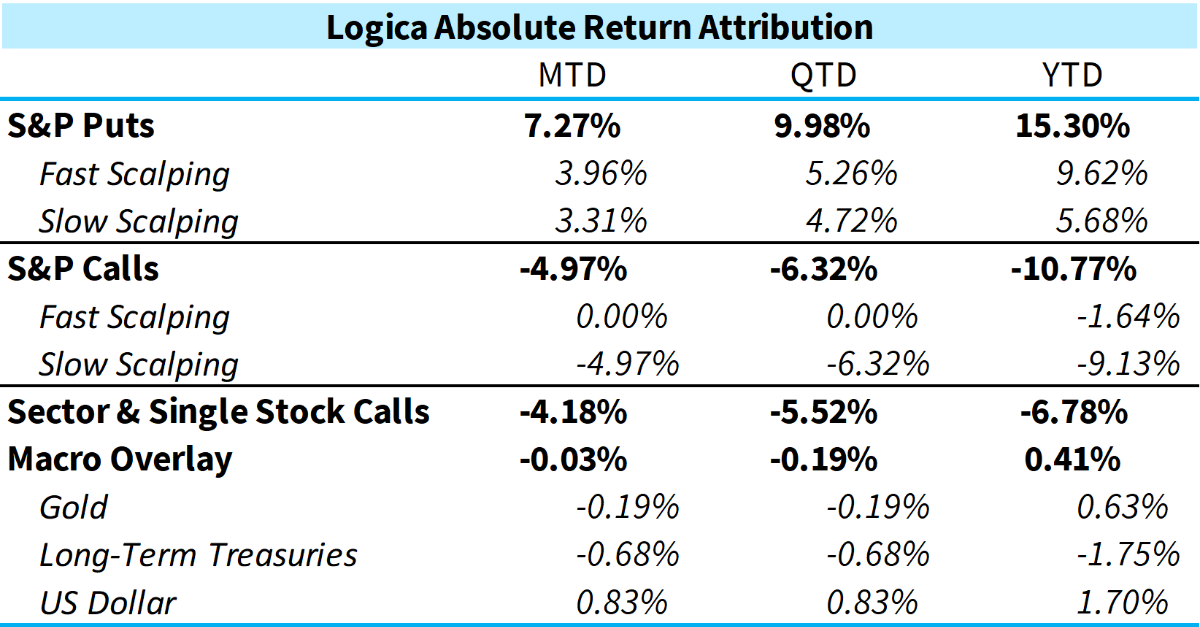
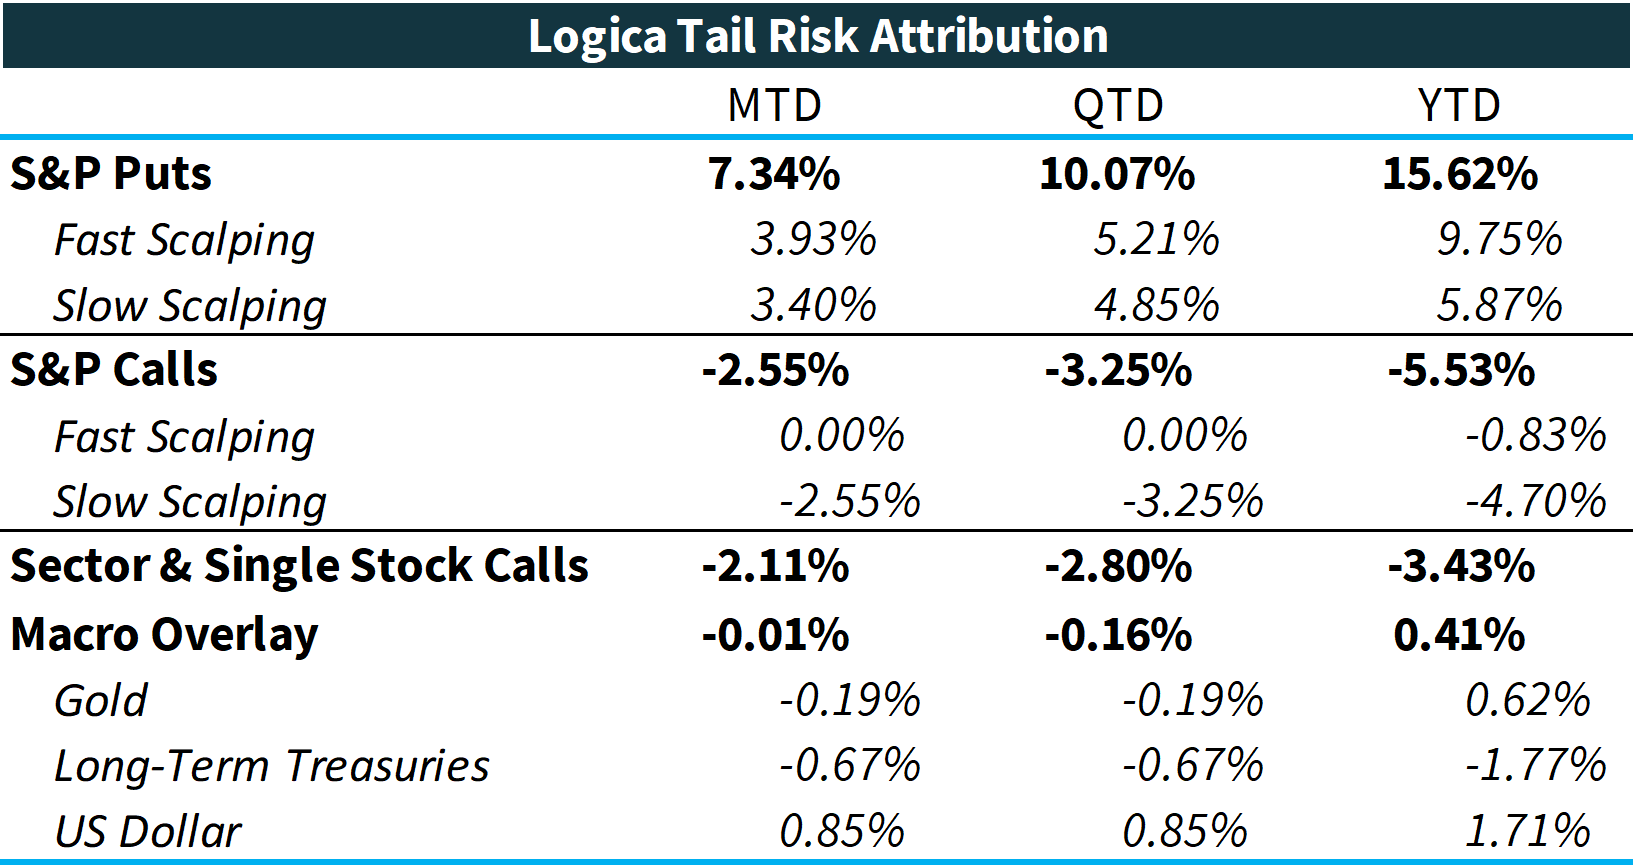
* For illustration purposes only. Attribution returns are composed of daily returns, gross of fees
While the obvious expectation is that April would be an ideal month for long volatility, there were several factors that led to April actually being a rather challenging month. First and foremost, and starkly above all other factors, neither strategy got meaningful juice from the fairly muted payoff in S&P Puts (and more generally, in Implied Volatility). One reason for this is something we discussed briefly in our prior monthly letter and will discuss in greater detail below. But, broadly speaking, we still haven’t seen the expected IV pop/spike given the magnitude of the S&P 500 drawdown. Not only did the drawdown begin from an already elevated IV level (historically speaking), it also didn’t extend that much further in the face of the surrounding behavior that “should’ve” extended it far more; as if panic was nowhere near setting in.
Alongside that, we saw anomalous behavior from our risk-off focused Macro Overlay. Even with our decreased exposure to falling Treasuries (recall our prior letters discussing our reduction), we got nothing from this flight to quality basket in a month where the S&P was -8.8%. Historically, quite unusual.
Fortunately, our Sector and Single Stock Calls did offer some alpha over the S&P, but unfortunately, not as much alpha over S&P Calls as we’ve been accustomed to. We’re being a bit unfair here to this module, as it has been a dramatic outperformer vs S&P for nearly 18 months, as we wrote about in detail in our February letter. But in April, we simply had “less” outperformance to significantly lift the rest of the portfolio.
All that aside, the most relevant contribution (or lack thereof) this particular month was our Fast Scalping S&P Puts module, which although in line with the historical probabilities, dramatically underperformed its potential. The average delta notional exposure of the Fast Scalping module was about 1.4x the Slow Scalping module, yet only contributed at a rate of about 1.2x. More importantly, months like April are precisely when we expect the Fast Scalping Puts to excel (so, using the metric above, perhaps we might expect them to contribute at 1.8x or greater), as there are more scalping opportunities to take advantage of. However, as anyone knows in trading, sometimes the models just get it wrong, and April was one such month. Simply put, there being more available opportunities only translates to positive PnL if the models trade those additional opportunities well, whereas if the models mishandle those additional “opportunities,” then the exact opposite transpires, and more opportunities translate to more losses. Given a hitter with a probabilistic edge, three pitches are always better than one, but even so, three improbable strikes and you’re still out.
Before expounding on and further lamenting the trading/scalping shortcomings in April, we should mention that this mechanism is precisely what causes our strategies to hold up so well in months where the S&P 500 furiously rallies upward and is accompanied by a large IV crush – the quintessential pain point of long volatility. March of this year was one such perfect example, where on March 14th our model output a significant scalp, leading to our strong positive Delta and low Vega tilt going into the immediately following S&P rally from March 15th through the 24th, which successfully generated profits for us during the associated 10 points of IV crush (VIX from approximately 32 to about 22). In concept, the exact same probabilistically driven “mean reversion” trading mechanism that assessed a large scalp and enabled us to profit holding long volatility during a 10-point volatility decline is precisely what hit us during April when no such bounce followed the scalp. And again, the same process came around in the latter half of 2020 (and several stops in between) where, partly due to our model’s ability to modulate/scalp S&P Put positioning, we were able to preserve capital, and even post a small monthly gain, during S&P recovery events and significant volatility crushing.
“Prediction is very difficult, especially if it’s about the future.” – Niels Bohr
What is fascinating about mean reversion trading from a probabilistic view is that the greater likelihood of the reversal (versus extension in the current move), the more our model “wants” to scalp, whereas at some moments, when fully positioned for such a reversal, a continuation can lead to an even worse outcome vs. had we not scalped and held the original position for longer. The obvious concern with this more naïve approach, however, would be seeing it all crush away at the moment of the inevitable reversal rally. In sum, this all leads to better timing, or signaling, around reversion vs expansion. Really, the key here is to isolate “when is a reversion more likely than an expansion?” And while this concept is – and has been – one of our core areas of R&D over the last decade, and while we have built powerful signals to identify this, the unfortunate reality is that there are just so few data points (i.e., stress events) in recorded market behavior that it is difficult to robustly crystallize a fully reliable mechanism. And even if one had “sufficient” historical data, there is of course no surety that the past will be like the future in any given small sample (e.g. over a one month/quarter period).
Yes, we have a well-developed “Phase Shift” mechanism that we have described in prior letters, which assesses continuation vs. reversion and has us scalp slower (to varying degrees), but even then, the exact path can make it more difficult. This can be particularly tricky in slow grind down markets like we have recently experienced, as there is often a pause or “bear market rally” (short squeeze or relief rally typical of oversold markets) that our model relies on to scalp in order to “re-load” at a better price. But, once again, if scalping at a moment that is followed by a further move, the chance to reload “cheaper” is replaced with a larger loss from having scalped too early (in this case lightening up on Puts while the S&P continues to fall). Monetization is a delicate science.
So why trade Puts at all you might say?! Well, for many reasons, including when the probabilities and associated reversion trading does time it well, providing us with a payoff in the decline, alongside a benefit in the recovery. Simply, when our model “gets it right,” when it works like a charm. Separately, holding a large quantity of Puts, or long volatility positioning, is perfectly suited for gaps or large down moves (think Feb/Mar 2020), when the magnitude down and associated IV spike is large enough to build in a significant profit before the scalping process even starts. In general, there are more ideal scenarios than there are less ideal scenarios, but as we see in April, we of course will sometimes experience the less than ideal scenarios.
“We do not learn from experience; we learn from reflecting on experience.” – John Dewey
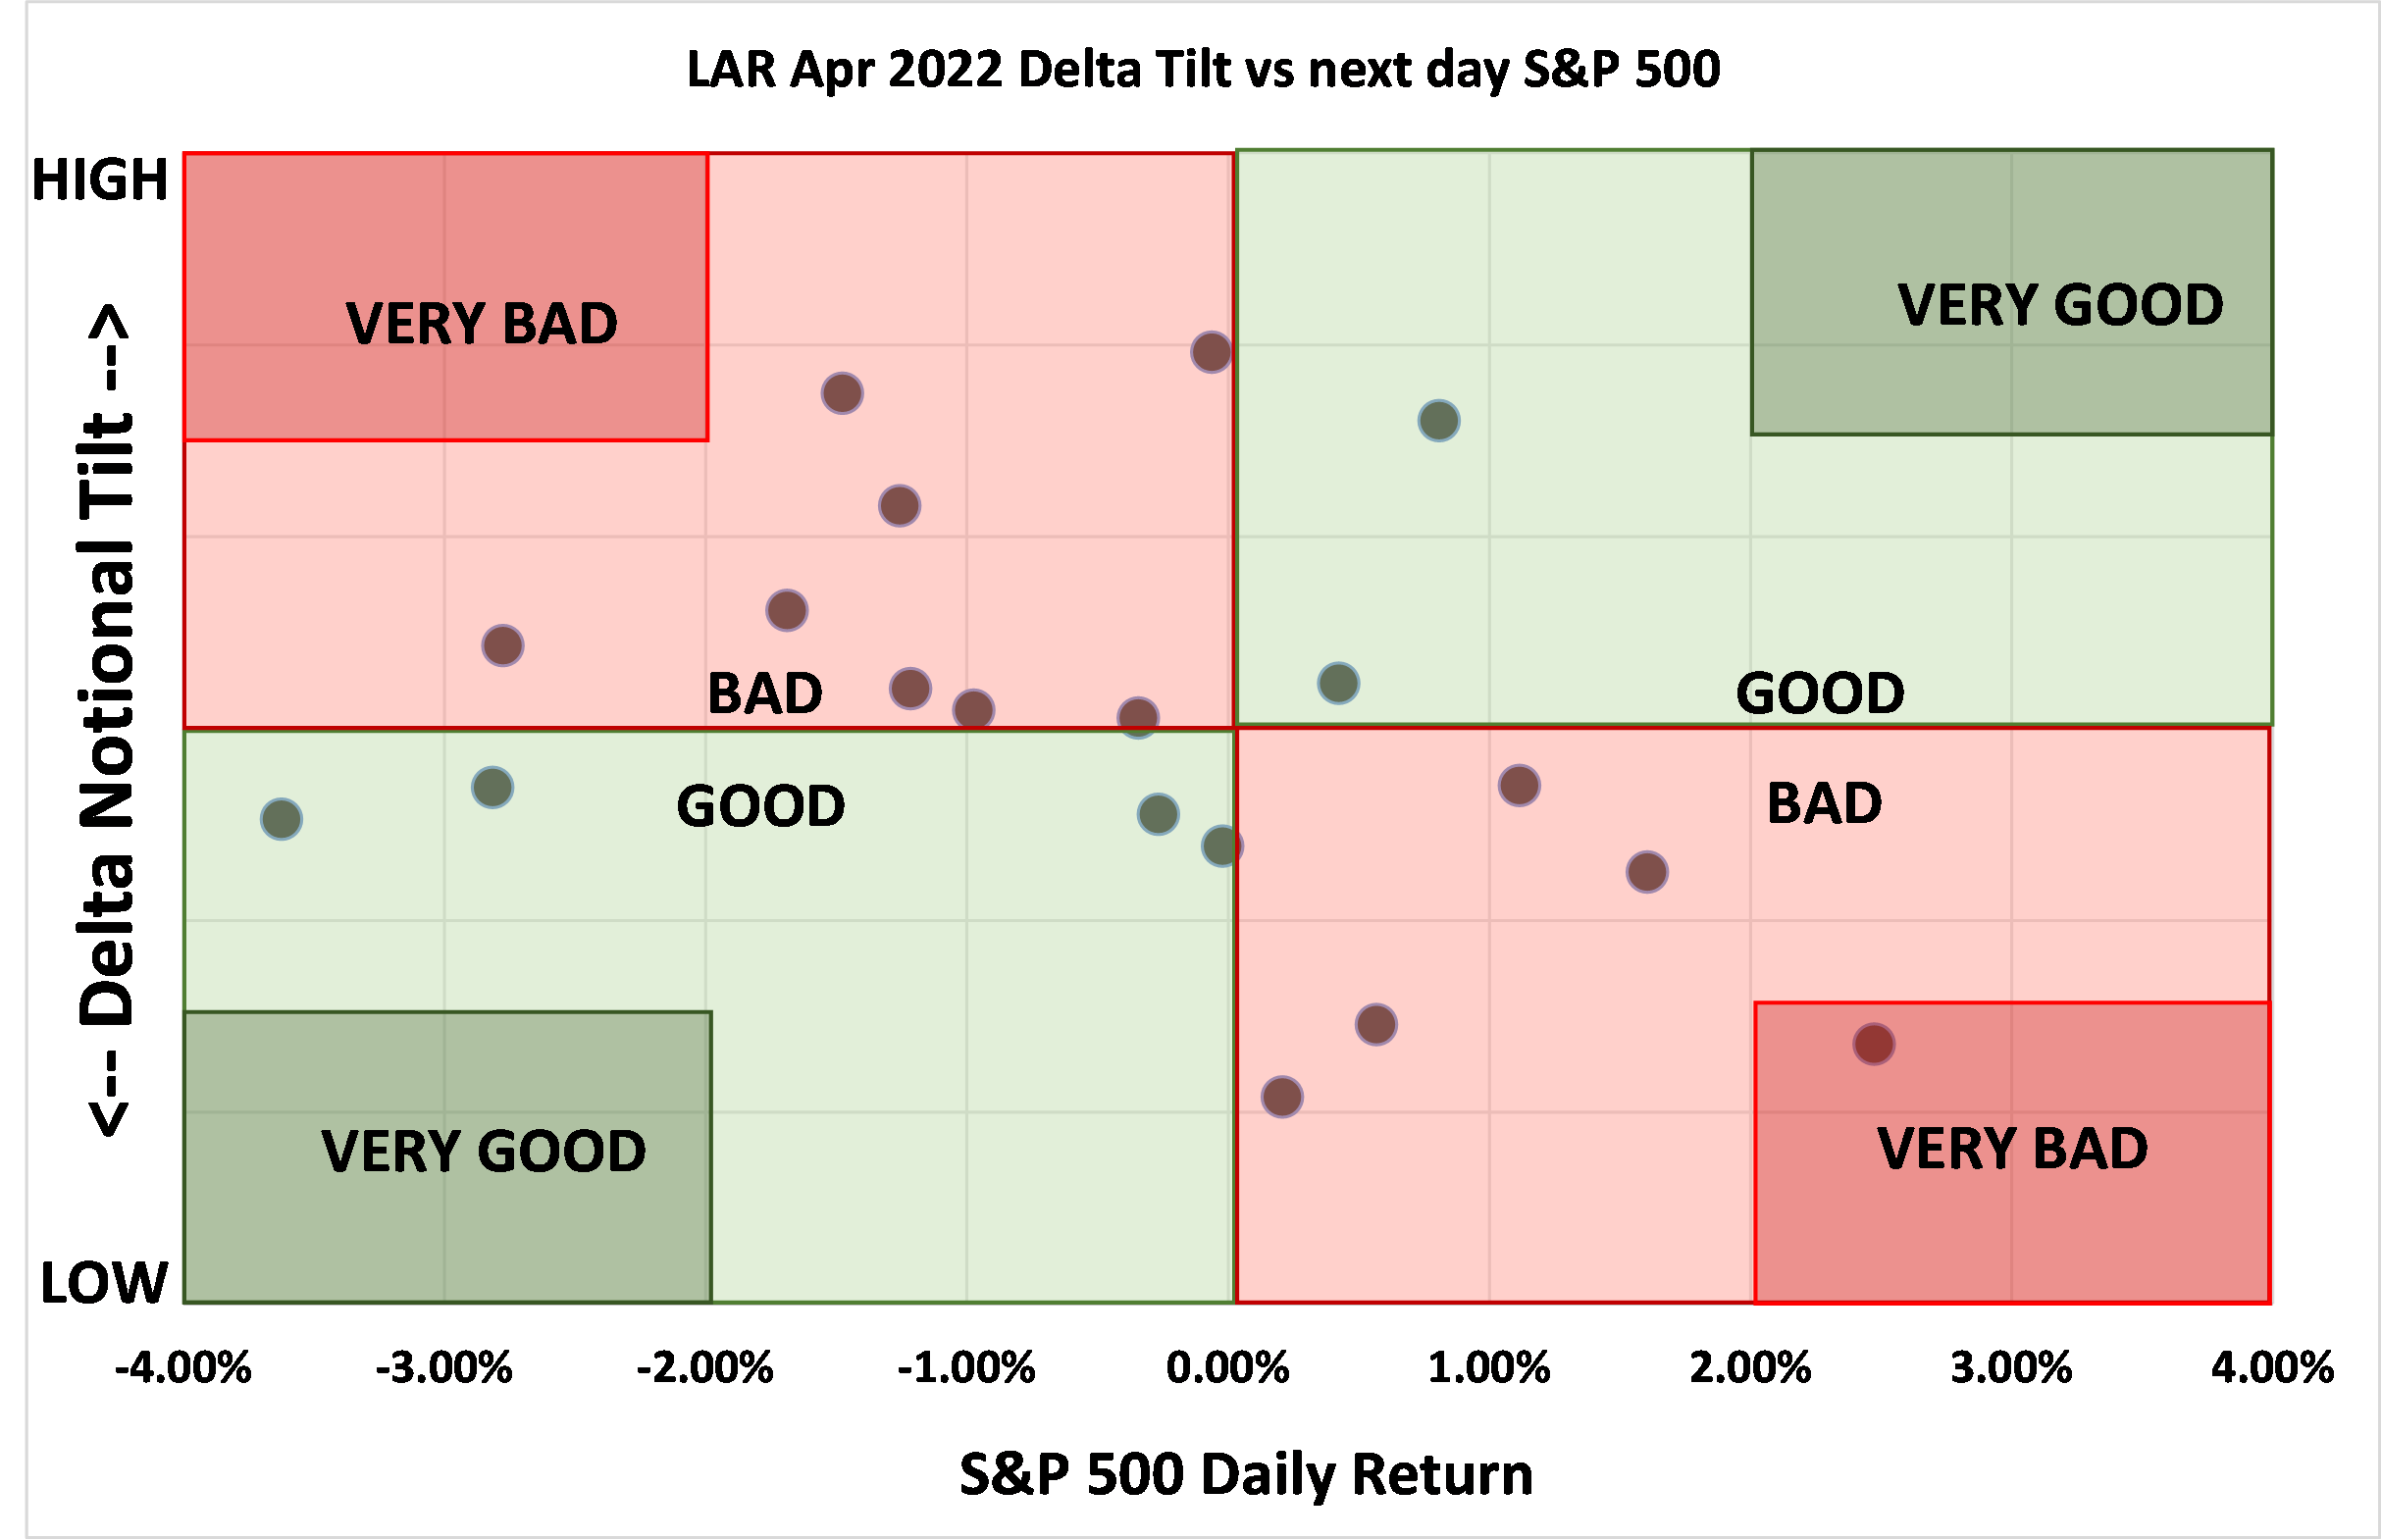
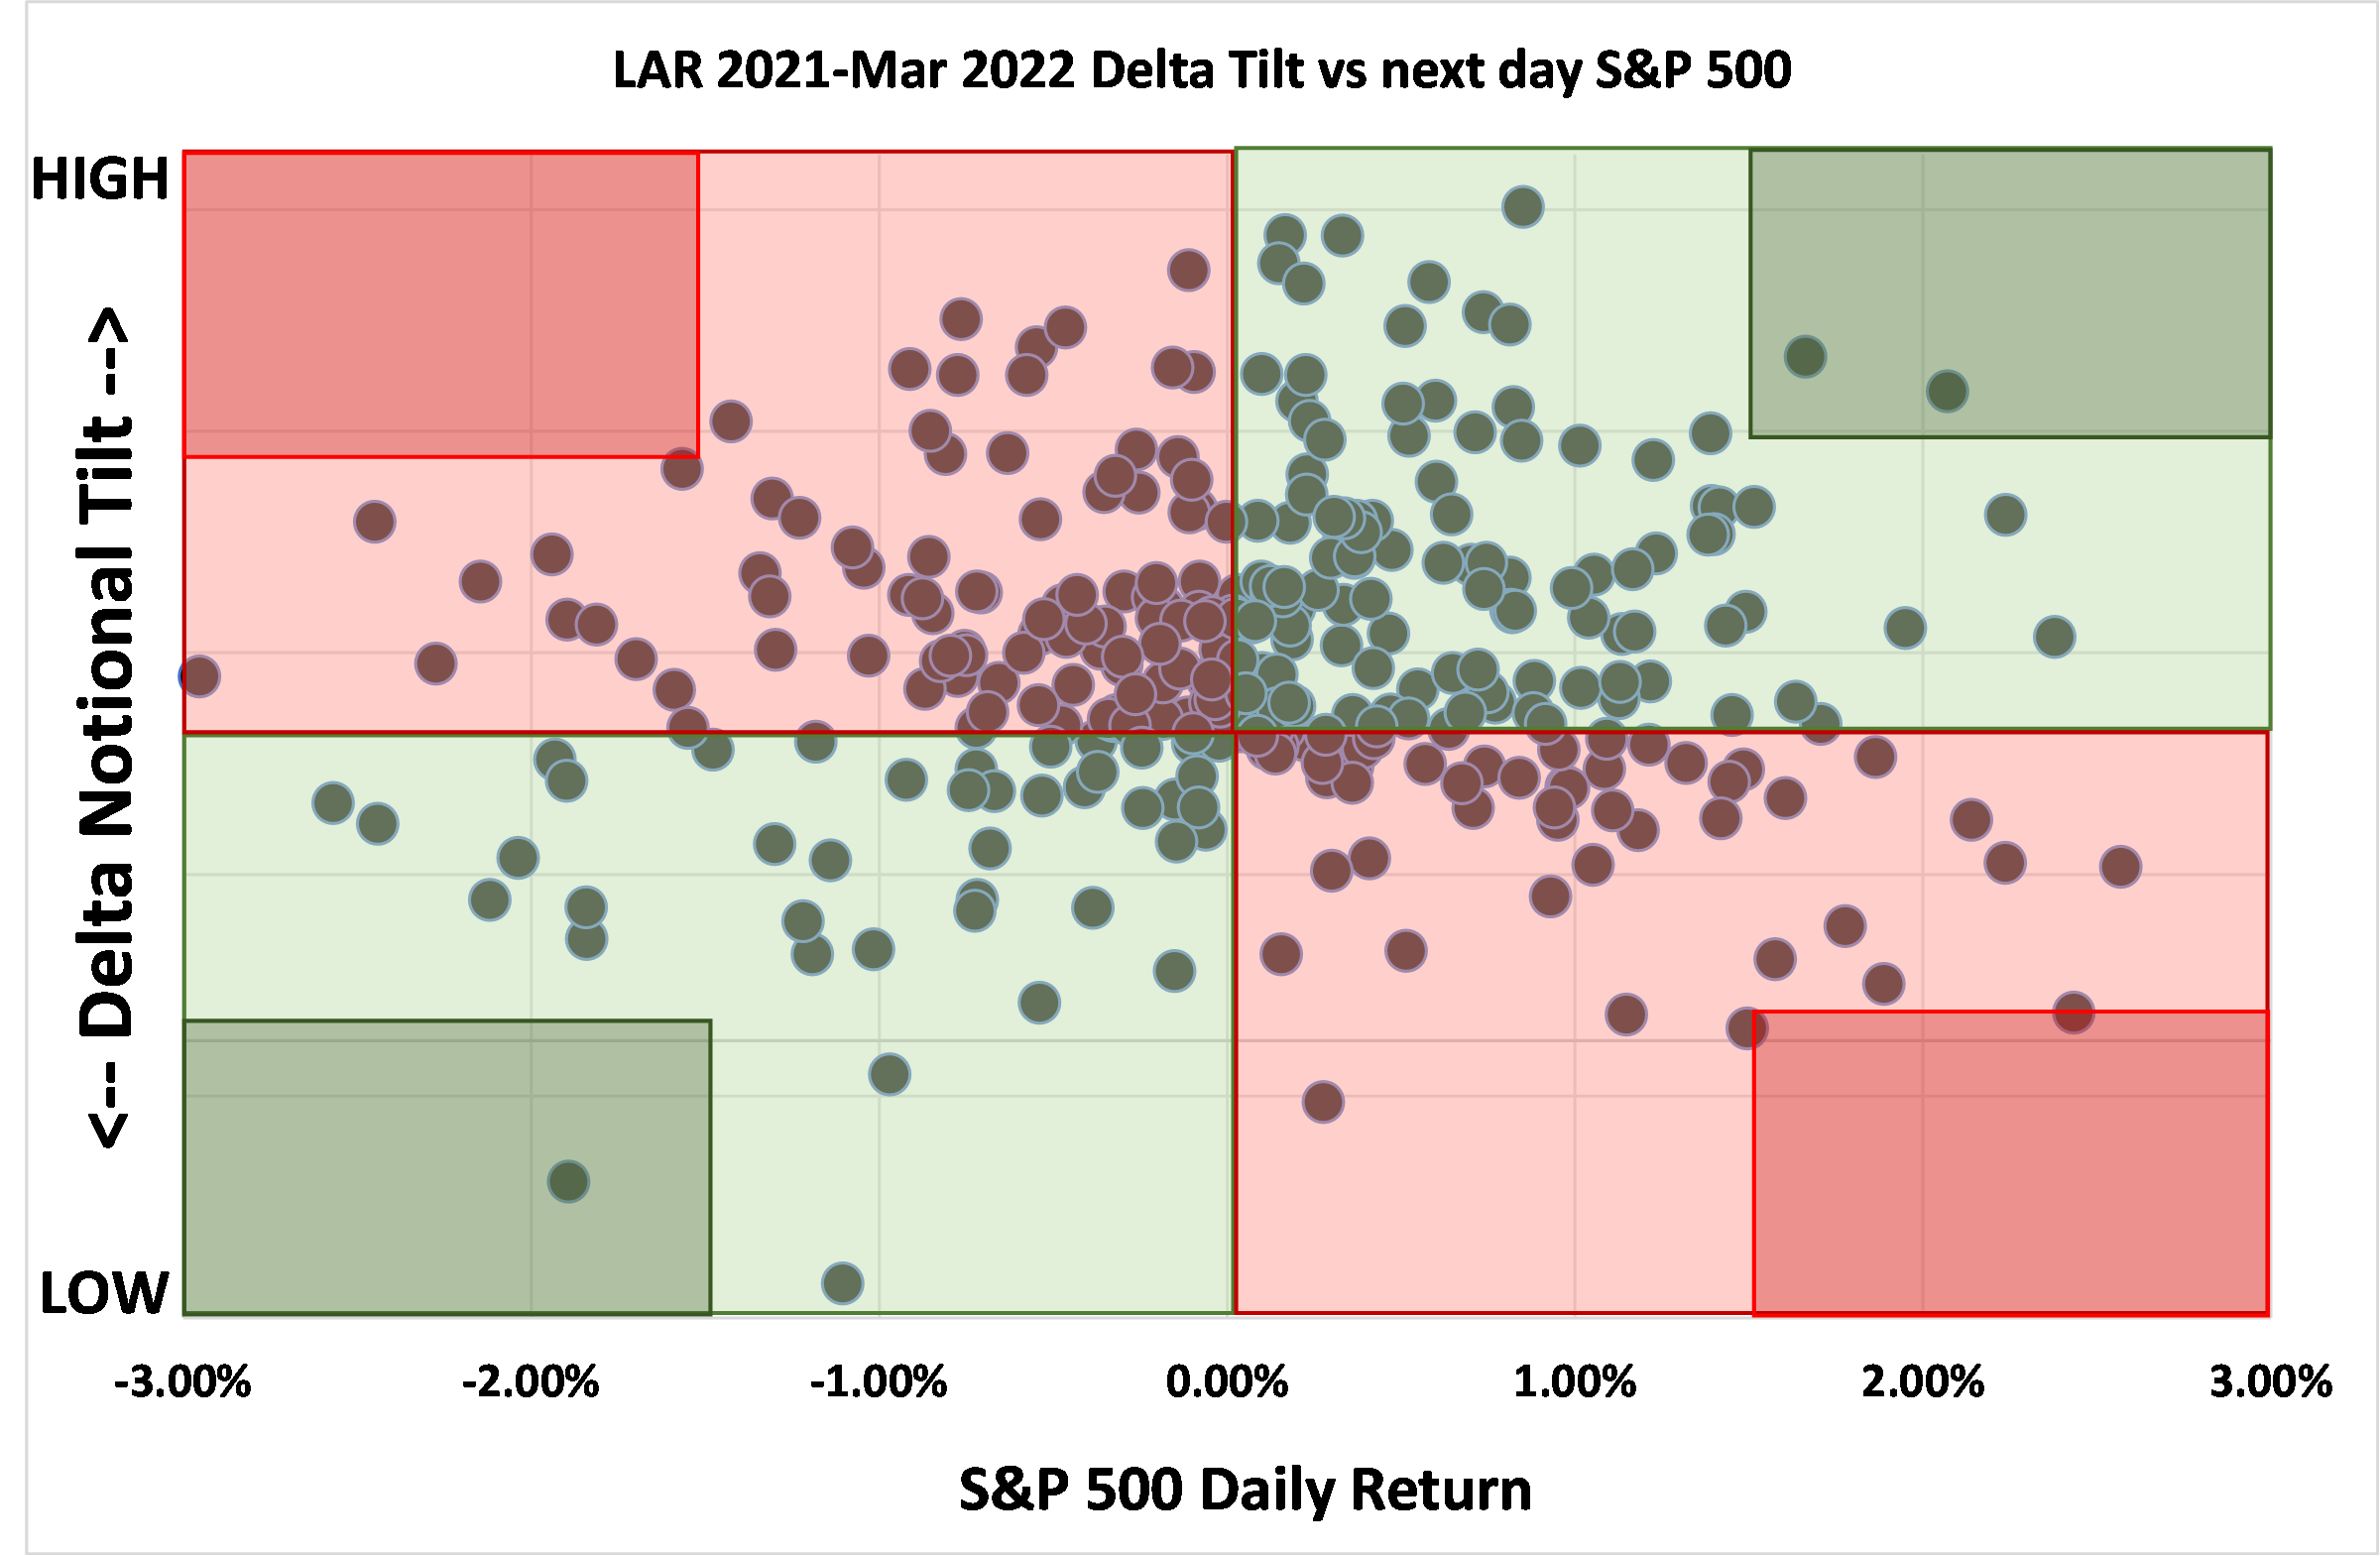
With all that in mind, we’d like to dig a bit deeper into this very significant part of our process, that is, probabilistic mean reversion trading/scalping. While we analyze a lot of different aspects of it internally, for the sake of discussion here, we have simplified our presentation into the basic goals of “good” and “bad” (and the even more technically, very good/bad!). Simply, an outcome in a “good” quadrant is if our delta notional tilt (i.e. scalp quantity decision) at the close of the prior day aligns with what the market did the next day (e.g., we’d prefer a low/negative delta tilt if the market is going to go down, and a high/positive tilt if the market is going to go up). And of course, alongside our being right or wrong, the magnitude of our win/loss matters, so we specify the most extreme as very good/bad.
Here’s a look at how we did in April:
Our vega (volatility) scalping/exposure painted a slightly better picture with a bit more success:
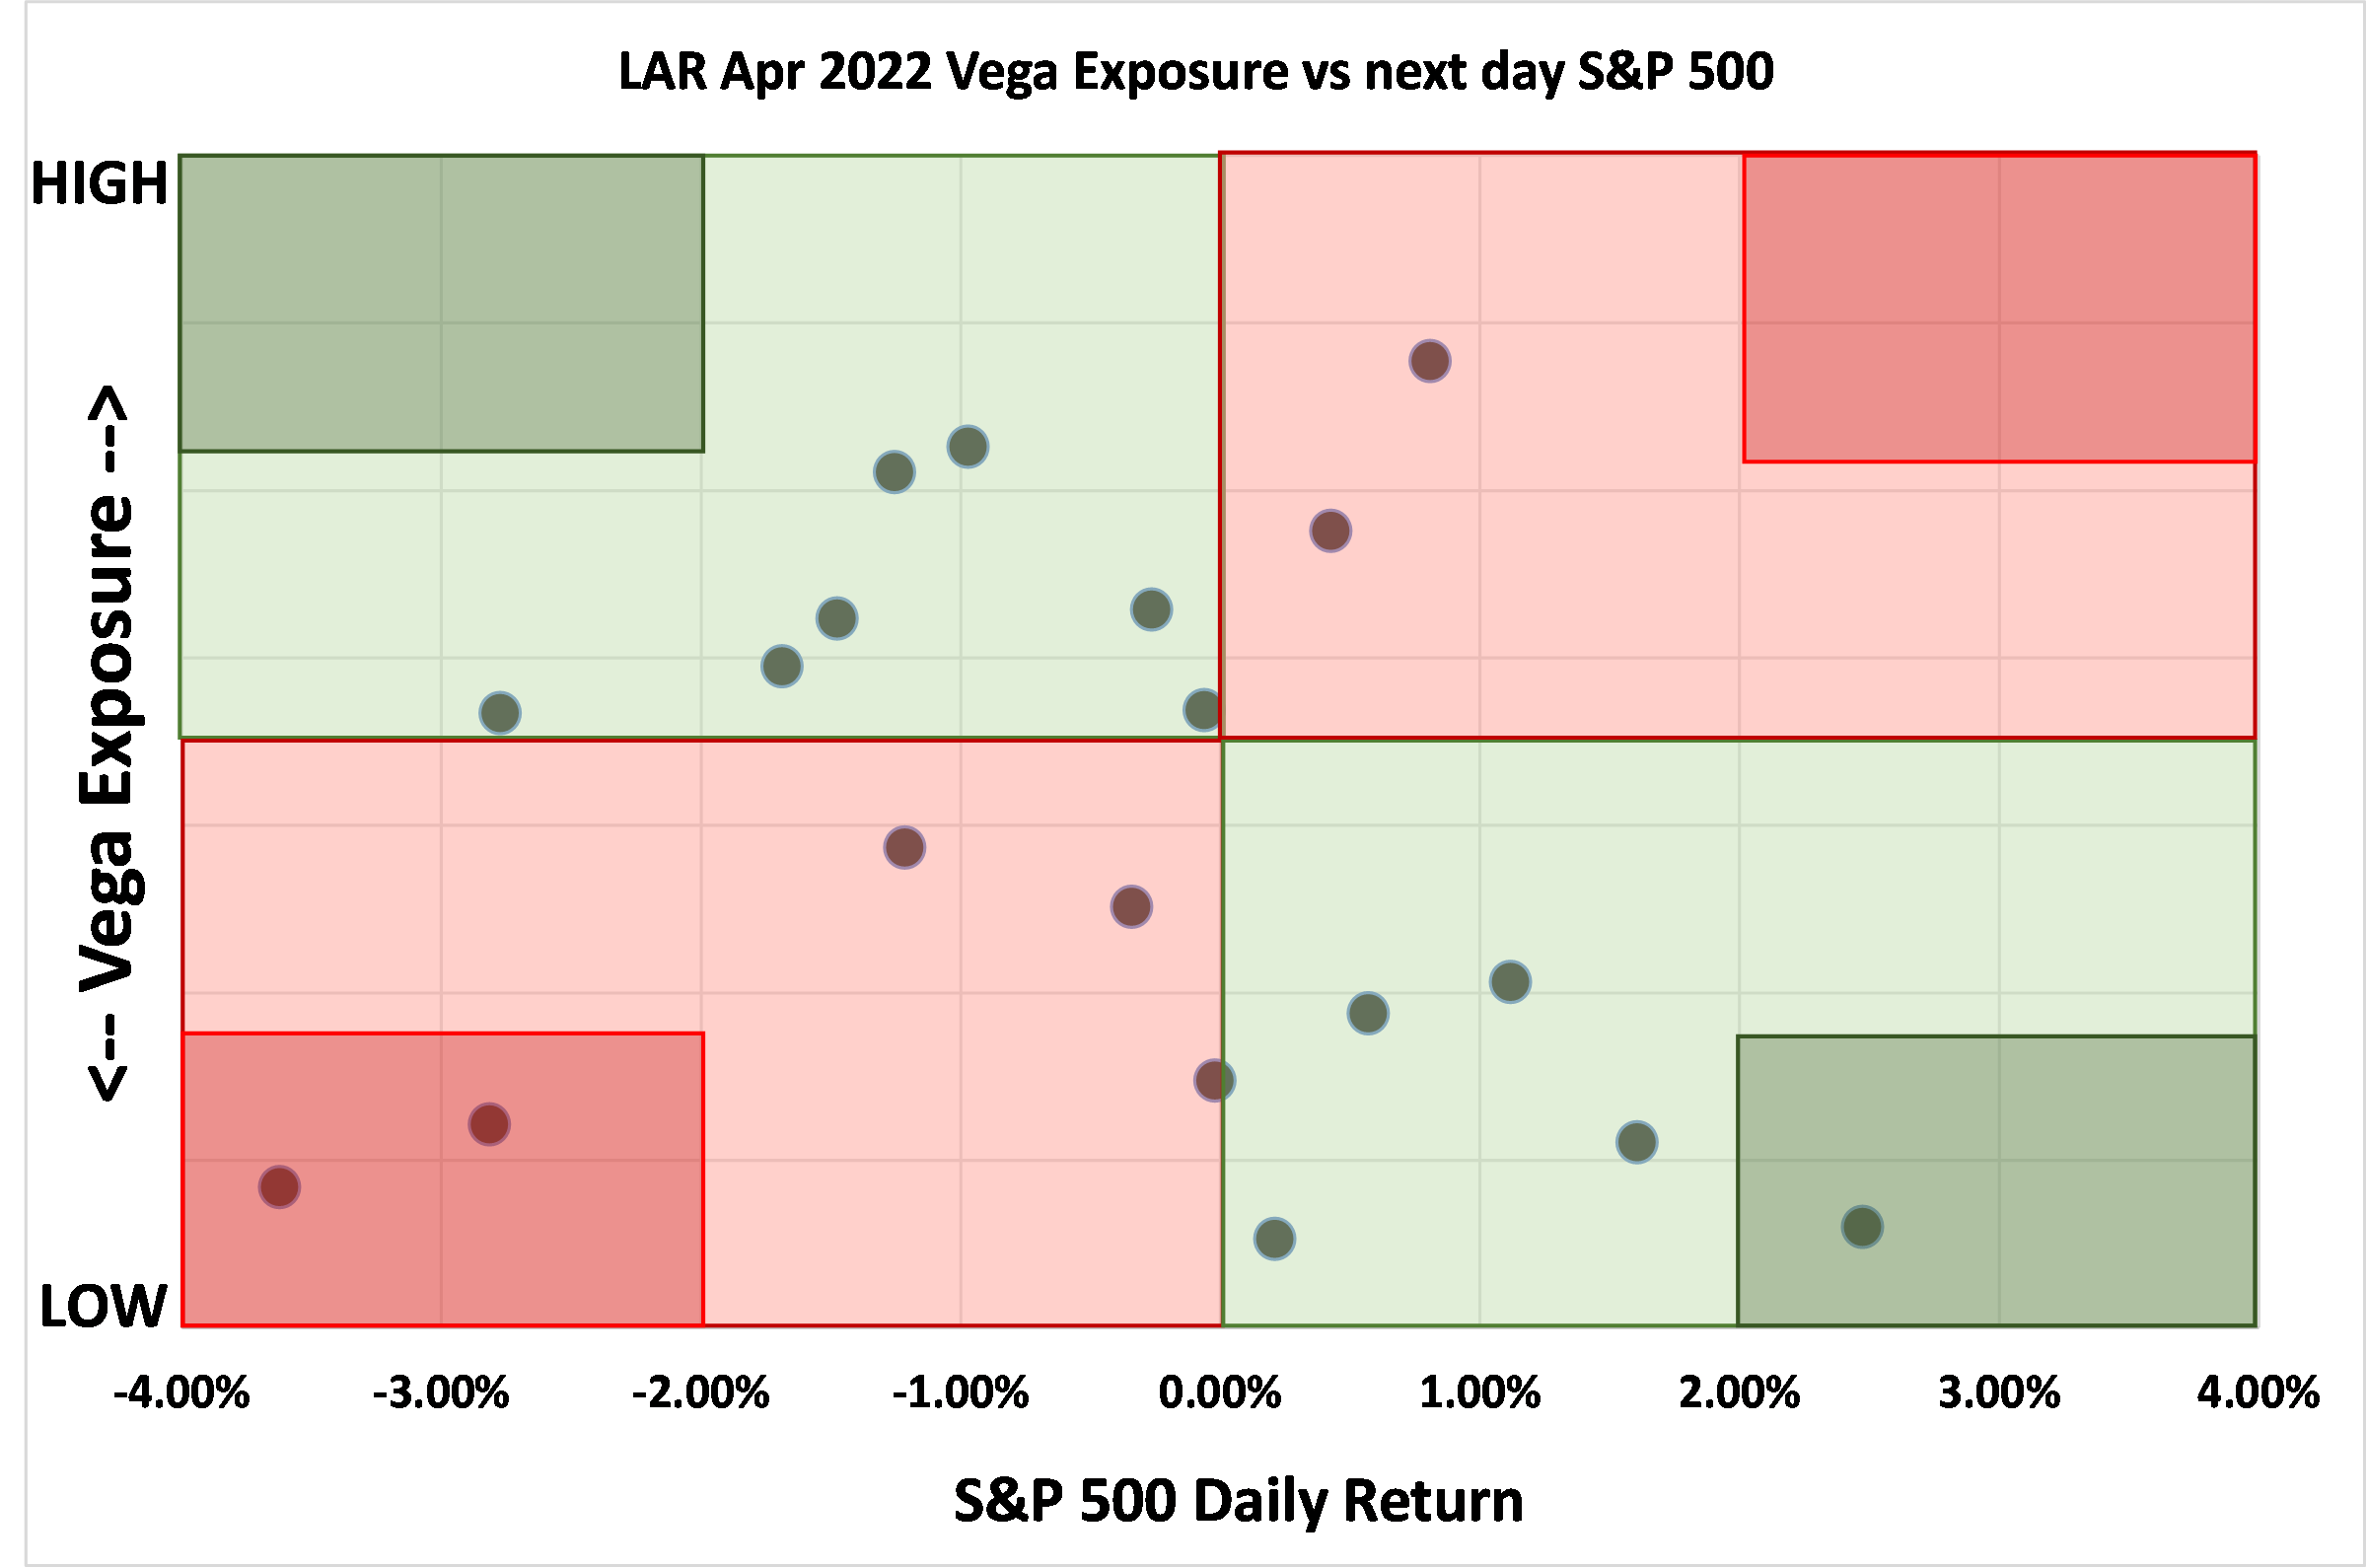
Of course, even with this higher rate of success, for the 2 largest S&P down days, we were lighter on vega exposure than we would have liked. This was partially overcome by having a lower delta tilt on those days, as one can see on the first delta tilt chart above.
Of note, and as mentioned above, the bottom most right observation, where the S&P 500 significantly rises and our vega is relatively low is precisely the positioning that allows us to preserve capital during violent bounce back rallies (assuming that a rise in the underlying is also accompanied by a fall in implied volatility, which is a fairly safe assumption, but certainly not a truism).
If we consider these 2 main variables – delta exposure and vega exposure – we can easily picture a quadrant of outcomes where the goal is to get both correct: low/negative delta, high vega in sell-offs, and high delta, low vega in rallies. The job of the models (and the humans at Logica that develop them!) are to modulate these exposures to best balance all possible paths/outcomes.
A key thing to note here and circling back to the core backdrop issue of muted volatility moves, is how forgiving slight mistakes in positioning are when implied volatility really spikes. This is the advantage of holding optionality, long-term. When a true crisis occurs, the vega and delta positioning both work in one’s favor, and extremely quickly, which is of course what the term “convexity” refers to. It’s essentially the difference between fighting a grueling headwind and having the wind at your back.
“It never gets easier; you just go faster.” -Greg LeMond, professional cyclist, 3x Tour de France winner
Going back to the core issue of muted Vol spiking, and our ongoing discussion about the differences in the implied vol moves during this S&P drawdown and that of other crisis environments, April continued this theme (which seems to have become a theme of 2022, thus far). Because of the lack of convexity in the implied volatility moves (e.g. “acceleration of volatility”), mistakes are punished harder and rewards for being “right” are far more limited. In our prior letter, we showed a visual of the linearity vs. convexity of IV during the month. Here, we show a similar comparison visualizing this environment vs. other stress events:
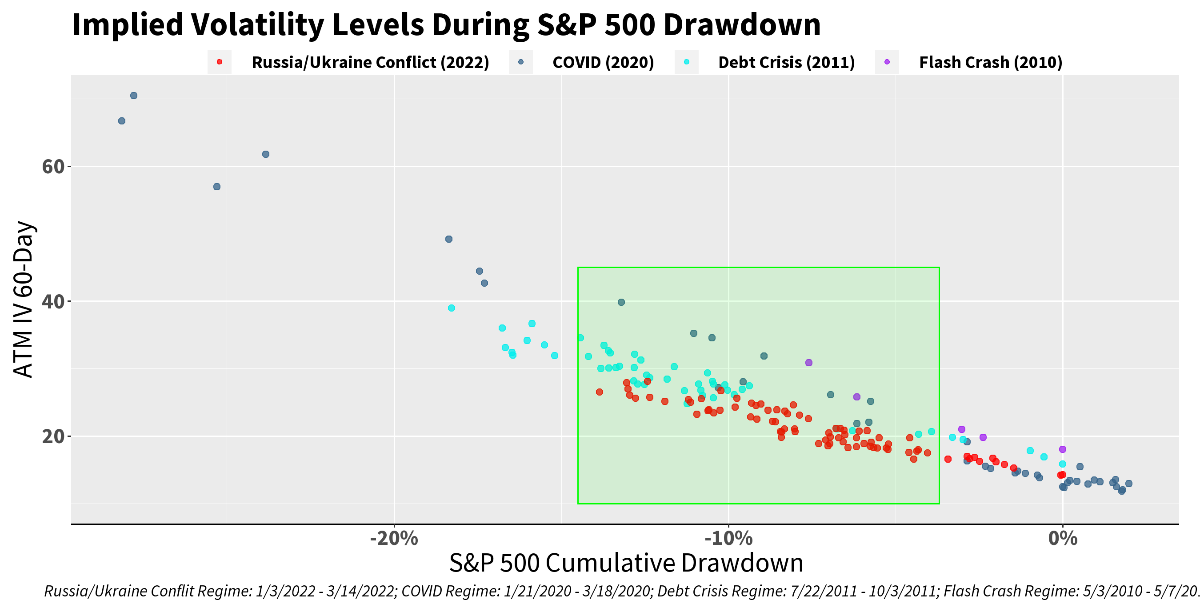
Looking to the visual, little else needs to be said, except maybe: is this the new world of volatility? In our view (and that of many of our peers with whom we discuss such things), NO, this is an unusual regime, and as markets do, will likely find its way back to some sense of normalcy (that is, ironically, “normal crisis behavior”) in due course.
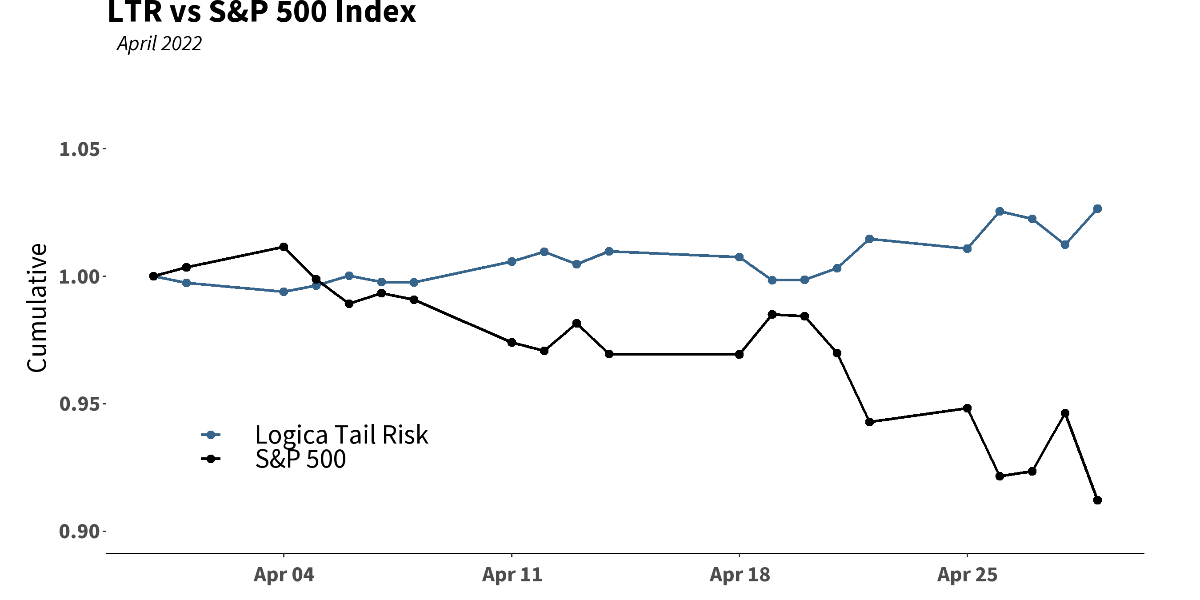
Finally, turning to take a look at our strategies vs the S&P 500 during April, we can see that LTR exhibited a very nicely negative correlation and opposing behavior, while LAR remained essentially uncorrelated. Of course, both strategies suffered from the less than ideal scalping performance, but because LTR holds only half of the upside Calls as LAR does, the negative correlation held firm, although certainly not quite to the magnitude we’d like.
Updated on
Sign up for ValueWalk’s free newsletter here.