

By Louis Navellier. Originally published at ValueWalk.
For weekend reading, Gary Alexander, senior writer at Navellier & Associates, offers the following commentary:
Two weeks ago, I wrote about the great Memorial Day market bottoms and recoveries in June 1962 and 1970 as typical of the ultra-strong mid-term election year market surges – except that these two surges came earlier than the norm. Lest you think I was cherry-picking top years, I’ll show all the gains from all mid-term election years 1950-1998, and you’ll see 1962 was sub-par and 1970 was average.
Fed Activity During Mid-Term Election Years
Nothing is more important in a bear market year like this than to demonstrate hope from history, but to come up with a fresh angle on this old subject. Tossing around ideas at our regular Friday morning conference call, Louis Navellier asked, “The Fed won’t like to raise rates much late in an election year, so won’t they stop raising rates after Labor Day?” To find the answer, I quickly scanned the last five mid-term election years and I found this not to be true. I found a suspicious amount of Fed activity during mid-term election years. As Louis suspected, there is not much Fed action in the fall of Presidential election years, so I tentatively wondered if maybe the Fed – like most voters, politicians, investors, and others who focus on “the next King” – tend to overrate the Presidency and underrate the impact of mid-term Congressional changes, so the Fed plows ahead with rate changes.
I found so much data, I’ll probably have to cut this survey short, saving the 21st Century for next week.
In 1974, Fed Chairman Arthur Burns (serving from January 1970 to March 1978) was a Nixon appointee (and friend) who often did the politically expedient thing rather than remain politically independent. As a result of overprinting dollars (at Nixon’s request), we were in a recession with inflation at 11% and unemployment at 7.2%, giving rise to a new term “stagflation.” Burns raised rates while Nixon was in office (Nixon resigned on August 8), and then he cut rates after the mid-term election, giving a boost to Gerald Ford, Nixon’s successor.
1974 Fed Rate Changes (Pre-election)
- March 9: Burns raised rates 1%, from 9% to 10%
- April 16: Raised rates 1%, to 11%
- July 16: Raised rates 2%, to 13%
After election:
- Burns cut rates 5%, back to 8%
Result: In 1975, inflation was still high, at 9.1%, unemployment rose, and the GDP was still negative, -0.2%, but the S&P rose over 53% in just over nine months from the bottom of a long 1973-74 bear market.
In 1978, new Fed Chair William Miller (serving from March 1978 to August 1979) was another relatively inept political appointee. He immediately began raising rates at a time when inflation was 7.6%, unemployment was 6.0%, and the GDP was soaring (+5.5%), so he managed to kill the economy for President Jimmy Carter.
1978 Fed Rate Changes (Pre-election)
- April 19: Miller raised rates 0.25% to 7%
- May 17: Raised rates 0.50% to 7.5%
- June 21: +0.25% to 7.75%
- Aug. 16: +0.25% to 8.0%
- Sept. 20: +0.50% to 8.5%
- Oct. 18: +0.50% to 9.0%
After Election:
- Nov. 21: +0.75% to 9.75%
- Dec. 20 + 0.25% to 10%
Result: Everything backfired: In 1979, inflation soared to an annual record 11.3% for the full year, amid gas lines throughout the nation. Gold was soaring, unemployment was still 6%, and the GDP dropped to 3.2%
In 1982, Fed Chair Paul Volcker (Serving from August 1979 to August 1987) first raised Fed fund rates to a crippling 20% before the 1980 election then cut them right before the 1982 mid-term elections. To kill a decade of inflation, he set rates at 20% for much of 1980 and 1981, from March 18, 1980, to mid-1981.
1982 Fed Rate Changes: Pre-mid-term-election
- July 15: Volcker cut rates 2.0%, from 15% to 13%, in stages at first
- August 24: Cut rates 3.5%, from 13% to 9.5%
After election:
- December 21: Cut rates 1% to 8.5% when inflation reached 3.8%
Result: Something finally worked: Inflation was 3.2% in 1983, unemployment was 8.3%, and GDP was +4.6%.
In 1986, under Volcker (and Reagan), inflation was just 1.9%, unemployment was 6.6%, and GDP rose 3.5%. That year, Volcker lowered rates by 1.43% from April 18 to August 21, from 7.31% to 5.88%. The stock market continued to soar, rising 46.5% from September 29, 1986, to August 25, 1987, but that was the main cause of the 1987 crash – stocks rose too far, too fast. Then they reverted to the mean, in a sharp drop.
In 1990, Fed Chair Alan Greenspan (serving from August 1987 to January 2006) made a lot of mistakes, such as raising rates as soon as he became Chairman, contributing to the 1987 crash, but as we entered the 1990 mid-term election year, Saddam Hussein had just invaded Kuwait and there was a massive military buildup there and a quick 20% market decline. Inflation was rising, at 5.4%, as was unemployment, to 6.3%, and GDP was falling toward a recession, at 1.9%, so Greenspan cut rates right before the election, which boosted stocks.
1990 Fed Rate Changes: Pre-election
- October 29: Greenspan cut rates 0.5%, from 8.25% to 7.75%
After election:
- Three more rate cuts in rapid succession, but that didn’t prevent a recession
Result: A short, shallow (-0.1% GDP) recession in 1991, with a 7.3% jobless rate, but a 41% market gain.
In 1994, there was no real threat of inflation or recession, but Greenspan raised rates anyway: Inflation was only 2.6% all year, and GDP grew 4.0% in 1994, but Greenspan doubled rates from 3% to 6% in six stages:
1994 Fed Rate Changes (Pre-election)
- February 4, 1994: Greenspan shocked the market with a surprise 0.25% rate increase
- March 22: +0.25%
- April 18: +0.25% to 3.50%
- May 17: +0.50% to 4.0%, doubling down
- August 16: +0.50% to 4.5%
After the election:
- November 15: +0.75% 50 5.25%
- Then a final increase to 6.0% in February 1995
Result: Greenspan helped fuel the “Republican Revolution” in Congress, while inflation got slightly worse, at 2.8%, and GDP dropped to +2.7. Meanwhile, the Internet and technology tamed inflation and fueled growth.
In 1998, unemployment was down to 4.4%, inflation was down to 1.6%, and GDP growth was up to 4.5%, but Greenspan lowered rates twice in the fall (before the election) to address the hedge fund crisis spawned by Long Term Capital Management (LTCM) and their overexposure to hedged positions in the Russian ruble.
On that note of déjà vu, let me pause to add up the totals, then continue the story next week.
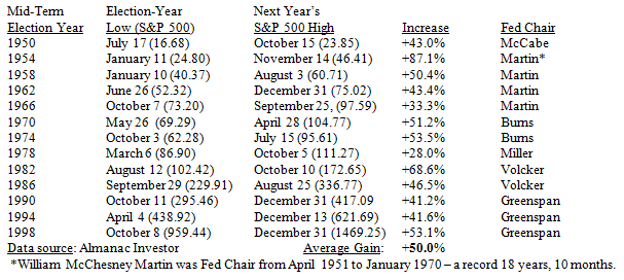
Before closing, here’s the positive news for stock investors. From the mid-term election year bottom to the next year’s high, the S&P 500 gained an average of 50% in the 13 mid-term election cycles of 1950 to 1998.
The market low came in October four times (1966, 1974, 1990, and 1998), once in September, and once in August, so we could be in for a huge gain from the second-half low to next year’s high, no matter what the Fed does.
Next week: The same sort of story in the mid-term election years of 2002, 2006, 2010, 2014, and 2018.
Updated on
Sign up for ValueWalk's free newsletter here.