

By Carmen Ang at Visual Capitalist
Charted: Healthcare Spending and Life Expectancy, by Country
Over the last century, life expectancy at birth has more than doubled across the globe, largely thanks to innovations and discoveries in various medical fields around sanitation, vaccines, and preventative healthcare.
Yet, while the average life expectancy for humans has increased significantly on a global scale, there’s still a noticeable gap in average life expectancies between different countries.
What’s the explanation for this divide? According to World Bank data compiled by Truman Du, it may be partially related to the amount of money a country spends on its healthcare.
More Spending Generally Means More Years
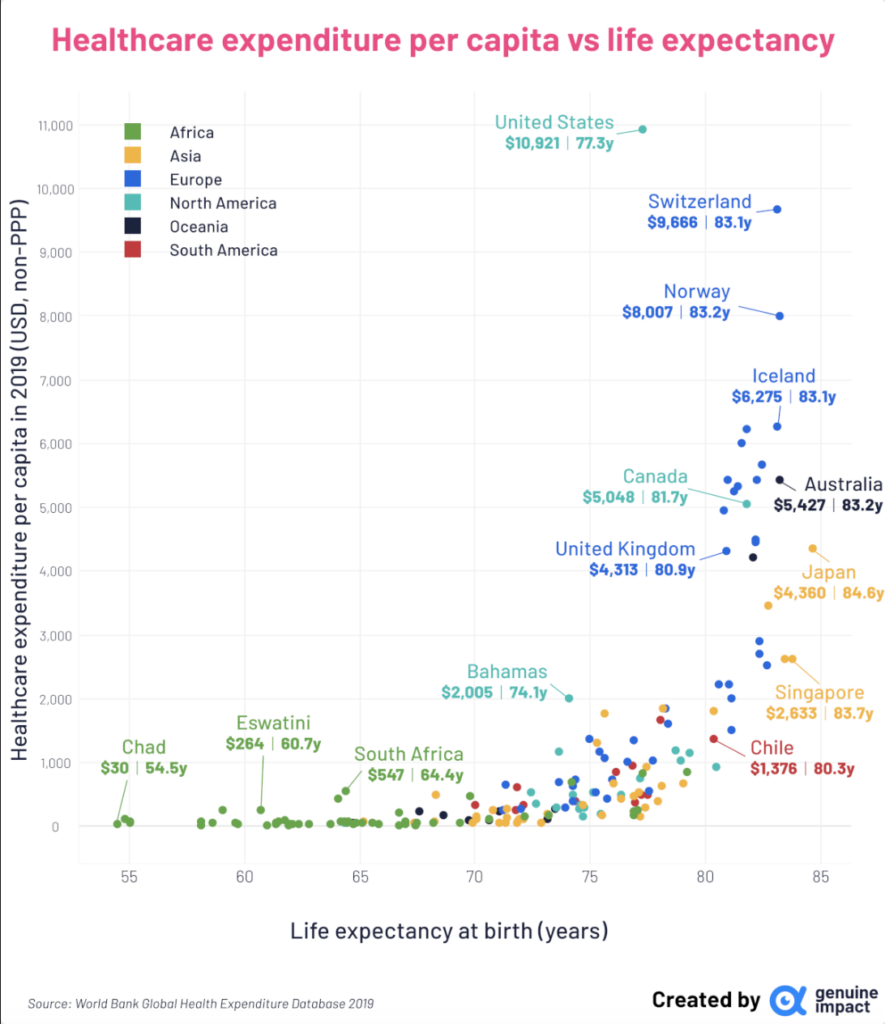
The latest available data from the World Bank includes both the healthcare spending per capita of 178 different countries and their average life expectancy.
Perhaps unsurprisingly, the analysis found that countries that spent more on healthcare tended to have higher average life expectancies up until reaching the 80-year mark.
However, there were a few slight exceptions. For instance, while the United States has the largest spending of any country included in the dataset, its average life expectancy of 77 years is lower than many other countries that spend far less per capita.
What’s going on in the United States? While there are several intermingling factors at play, some researchers believe a big contributor is the country’s higher infant mortality rate, along with its higher relative rate of violence among young adults.
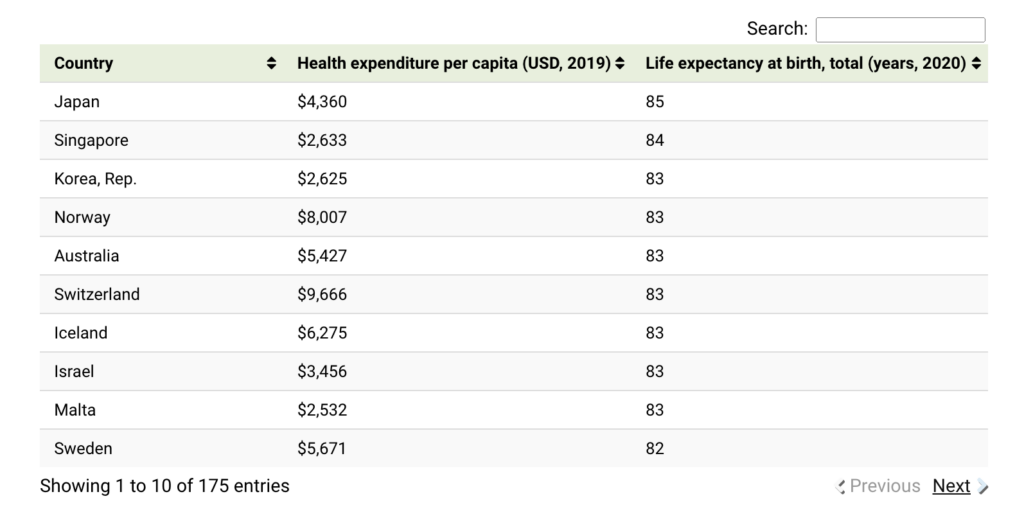
On the other end of the spectrum, Japan, Singapore, and South Korea have the highest life expectancies on the list despite their relatively low spending per capita.
It’s worth mentioning that this wasn’t always the case—in the 1960s, Japan’s life expectancy was actually the lowest among the G7 countries, and South Korea’s was below 60 years, making it one of the top 30 countries by improved life expectancy:
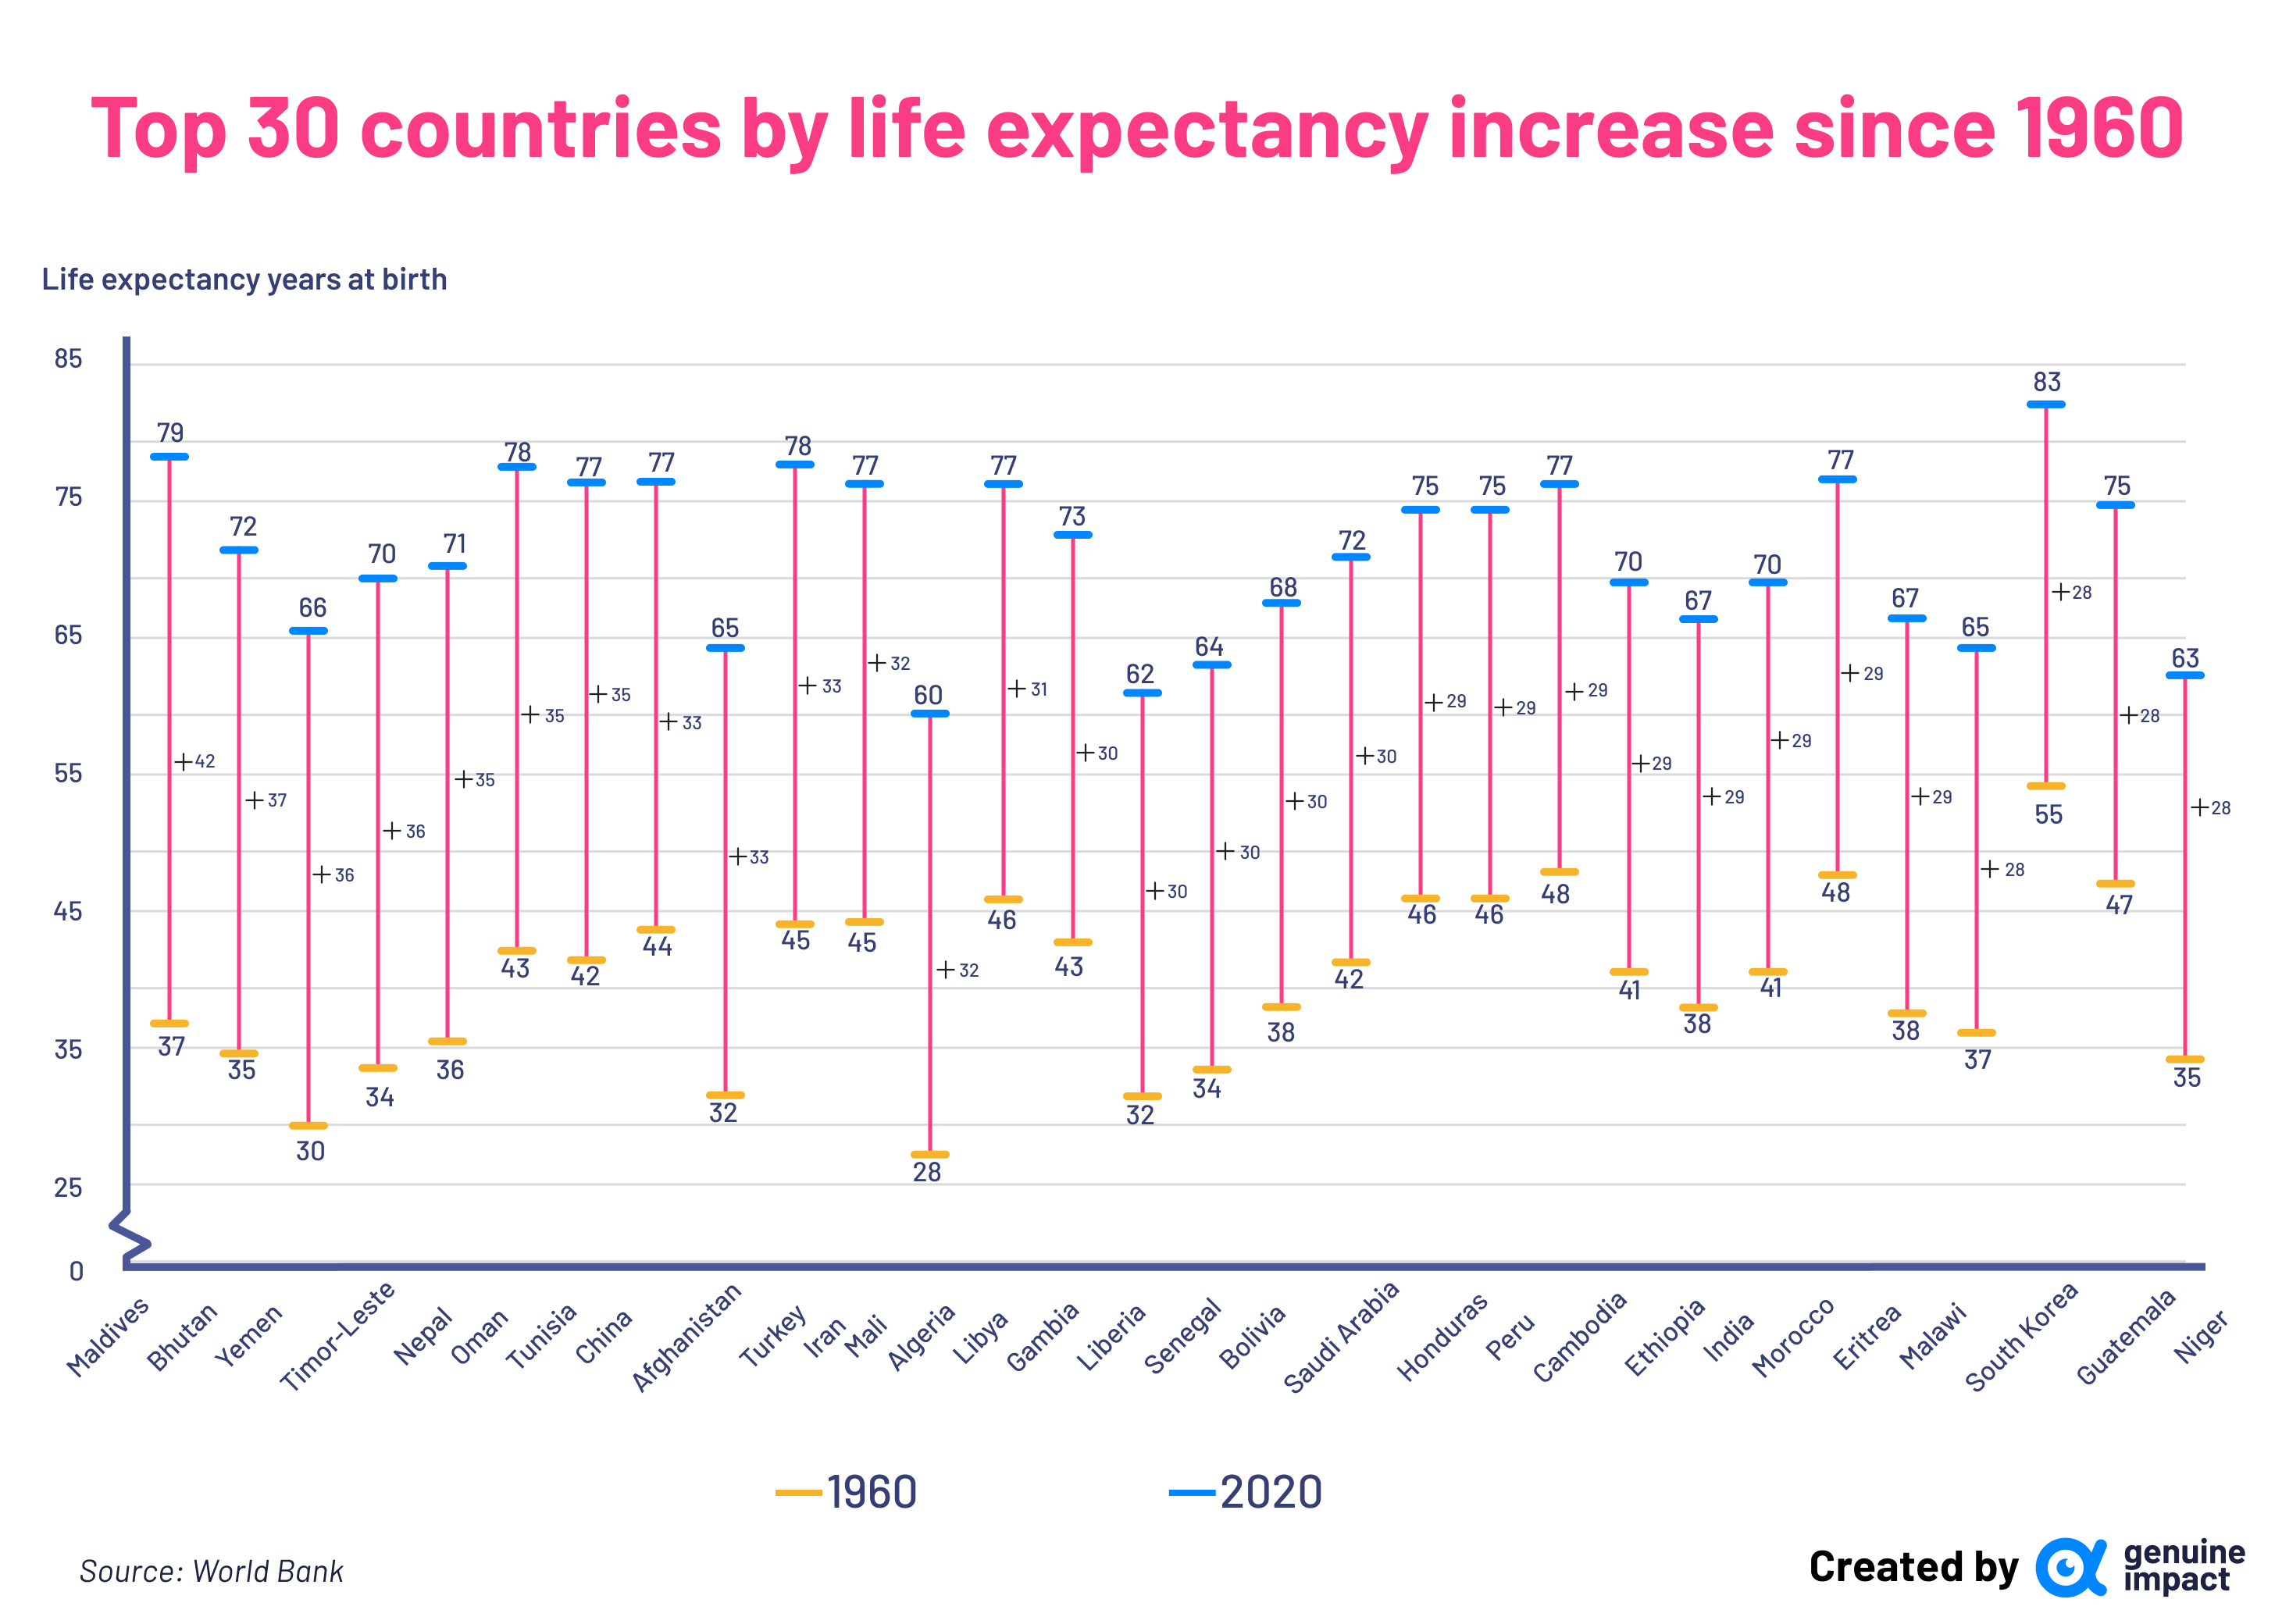
View the full-size infographic
In fact, the last 60 years have seen many countries substantially increase their average life expectancies from the 30-40 year range to 70+ years. But as the header chart shows, there are still many countries lagging behind in Africa, Asia, and Oceania.
How High Can Average Life Expectancy Go?
Since people are living longer than they’ve ever lived before, how much higher will average life expectancies be in another 100 years?
Recent research published in Nature Communications suggests that, under the right circumstances, human beings have the potential to live up to 150 years.
Projections from the UN predict that growth will be divided, with developed countries seeing higher life expectancies than developing regions.
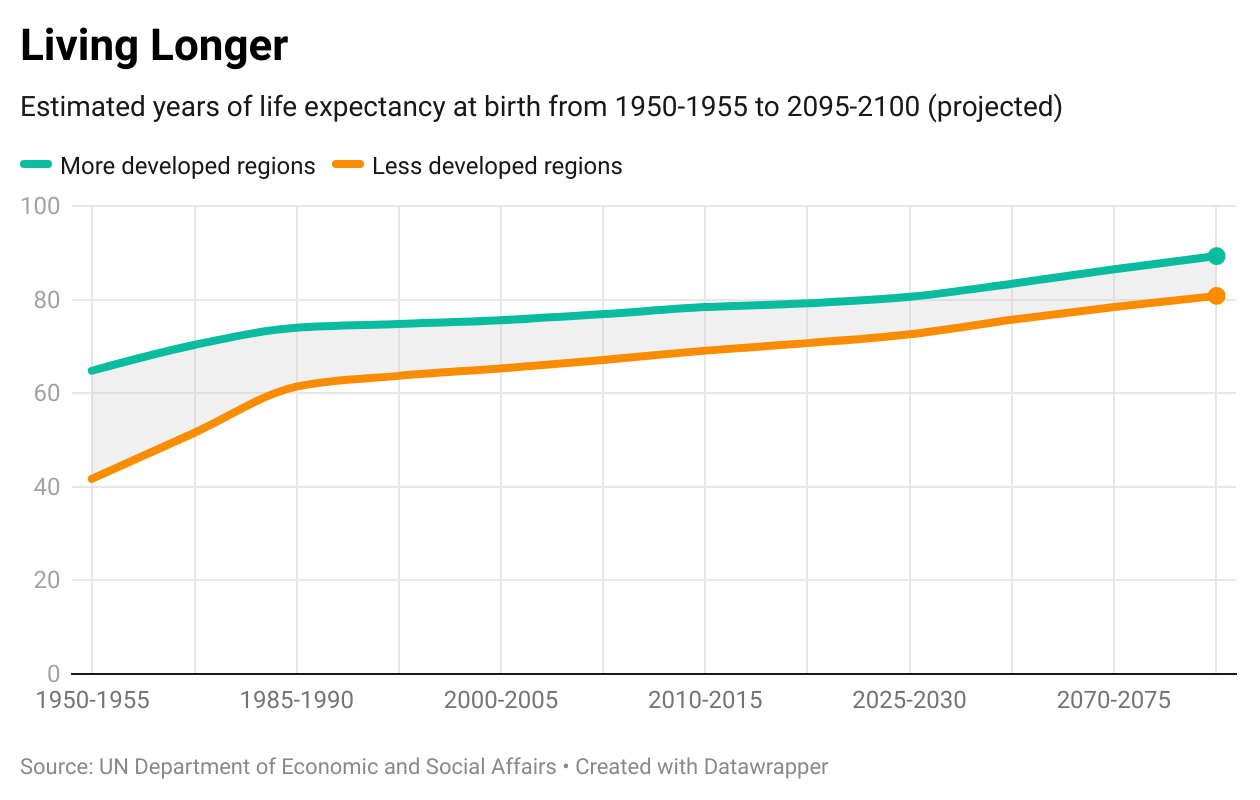
However, as seen in the above chart from the World Economic Forum and using UN data, it’s likely the gap between developed and developing countries will narrow over time.
This article was published as a part of Visual Capitalist’s Creator Program, which features data-driven visuals from some of our favorite Creators around the world.