

Authored by Mike Shedlock via MishTalk.com (as posted at ZeroHedge)
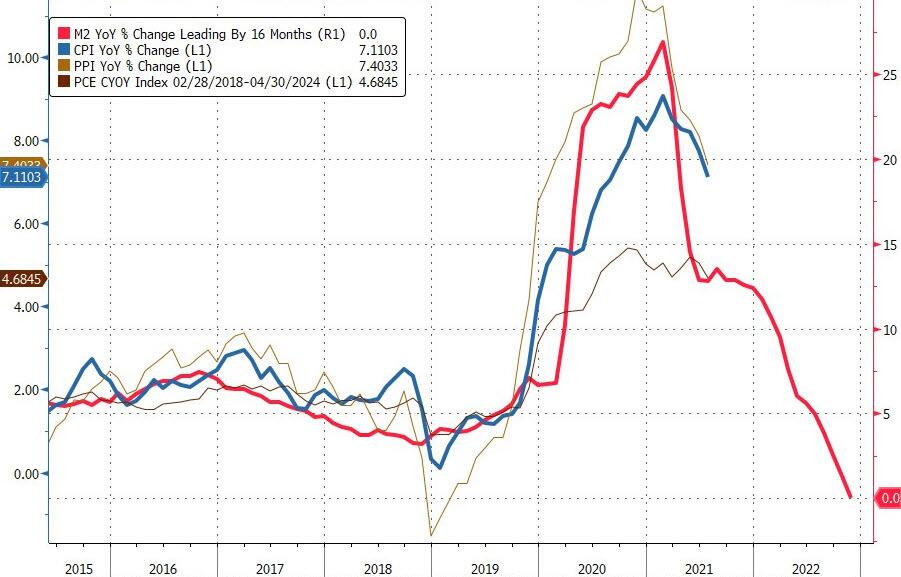
Think carefully about my question and the measures you use to define inflation.
Milton Friedman famously said: “Inflation is always and everywhere a monetary phenomenon.”

M2 from the Fed, CPI from the BLS, Monthly Data Through November, Chart by Mish
Most people parrot Friedman because the quote sounds good.
The actual quote is:
“Inflation is always and everywhere a monetary phenomenon, in the sense that it is and can be produced only by a more rapid increase in the quantity of money than in output.”
M2 Weekly Chart Percent Change From Year Ago
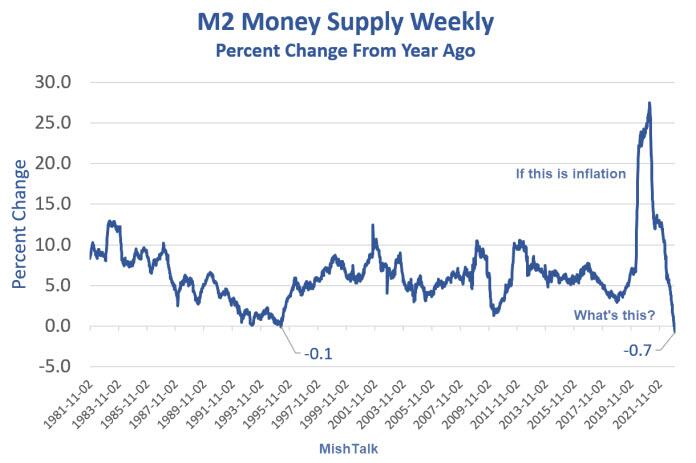
M2 from the Fed, Weekly Data Through December 5, Chart by Mish
Last Five Weekly Readings
-
2022-11-07: 0.3 Percent
-
2022-11-14: 0.0 Percent
-
2022-11-21: -0.1 Percent
-
2022-11-28: -0.4 Percent
-
2022-12-05: -0.7 Percent
Is Inflation Always a Monetary Phenomenon?
If you insist that increases in money supply constitute inflation, then you must also insist that we are in a period of deflation right now.
Does it feel like it?
I have been waiting for this moment for a long time just to ask these questions.
I was sure money supply growth would go negative because the Fed’s balance sheet unwind would shrink money supply as measured by M2.
Quoting Friedman
People love that Friedman quote, but ask anyone: How do you measure money? Is it M1, M2, MZM, or M3? Expect blank stares.
Then ask them how they measure inflation. If it’s by prices, not increases in money supply, then their answers are inconsistent.
What About Velocity?
At the time Friedman made his claim, he believed the velocity of money was relatively constant or stable in a narrow band.
Velocity was relatively stable then. It isn’t now. Few are aware of that major difference.
Changing Definitions
The 1959 Miriam-Webster definition of inflation was an increase in money supply and credit. Apologies offered, but I cannot find that reference.
The Fed, academia, and governments managed to change the definition to hide asset and credit bubbles.
The Fed seldom if ever discusses money supply or total credit. That is on purpose.
Total Credit Market Debt
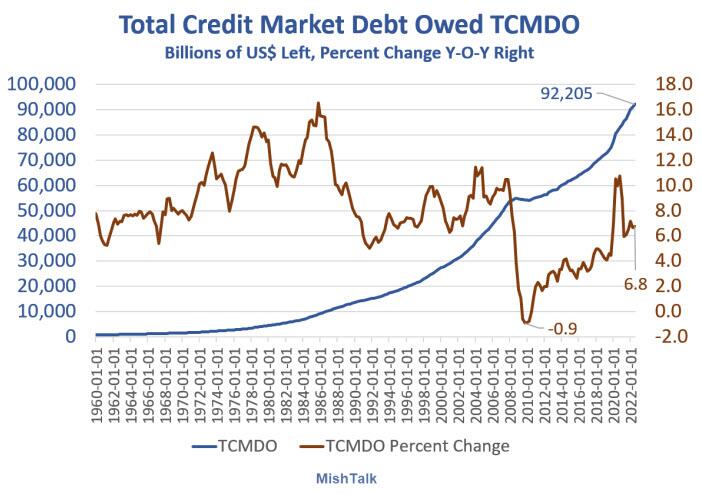
Total Credit Market Debt Owed data from the Fed, chart by Mish
TCMDO is $92 trillion. Data is through the third quarter of 2022.
How the heck is that supposed to be paid back?
From 2006-2009, using a credit view of inflation, I confidently predicted deflation and it happened.
Will it happen again?
I say yes, but when is the key question. This is not 2008. We do not have the degree of housing liar loans and people walking away from debt.
But we do have masses of zombie corporations that will go bust and all their debt with them.
Housing Bubble Deflation 2007-2010 Flashback

Total Credit Market Debt Owed and M2 data from the Fed, chart by Mish
That’s one hell of a deflation flashback to the housing bubble bust. We had an unprecedented 4 consecutive quarters of declining credit year-over-year and a 5th quarter that was flat.
Coupled with an enormous asset bubble bust, that’s deflation by any sensible measure.
At the time, however, I was routinely mocked for my deflation take because M2 was still positive. Well now it isn’t.
Is the US in a Period of Deflation Right Now?
The answer depends on what one means by inflation, deflation, and money. If you insist on a M2 measure, there is only one possible answer, and that is yes.
If you point at the CPI or grocery prices today while pointing out M2 yesterday, what does that say about you?
If you view things from the perspective of asset bubbles then heck yes, deflation has started. It also has a long way to go.
If you look at things from a credit perspective, you have a much better leg to stand on if you say there is still inflation.
Deflation In the Batter’s Box
It’s asset bubble and credit deflations that are the most damaging. Of course, it’s periods of credit inflation and cheap interest rates that sponsor asset bubbles.
To control inflation, the Fed has popped another asset bubble, largely of its own making.
Deflation, via another credit bubble bust, is in the batter’s box.
The Fed would pivot if it causes a credit event, but how low will asset prices go first?
Regardless, if you think either M2 or the CPI is the thing that matters most, you are wrong no matter what the Fed says.
The credit picture is more important than either of them. So are deflating asset bubbles. The latter is what led to a credit bust in the housing bubble period and it can easily happen again.
Meanwhile, the Fed is hell bent on destroying asset prices to control inflation. Good luck with that.
How Did We Get Here?
Why the Fed is in this position for the third time since 2000?
The short answer is the Fed is clueless about what inflation is, how to measure it, and what’s really important.
The Fed only looks at consumer inflation. It ignored (make that sponsored) asset and credit bubbles in a perpetually foolish effort to promote routine consumer price inflation of 2 percent.
But the Fed can only make money cheap, it cannot control where money goes. The money (credit expansion) went into assets especially housing.
Case-Shiller Home Price Index
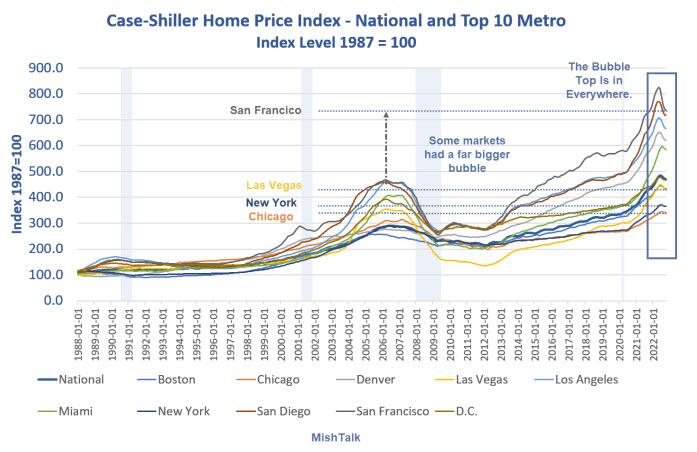
Case-Shiller home price data via St. Louis Fed, chart by Mish
CS National ,Top 10 Metro, CPI, OER Index Levels
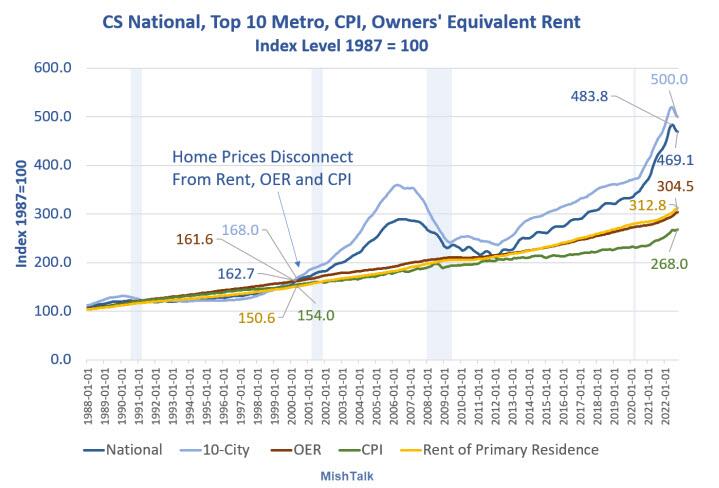
Case-Shiller home price data via St. Louis Fed, CPI, OER, and Rent from the BLS, chart by Mish
Chart Notes
-
OER stands for Owner’s Equivalent Rent. It it the price one would pay to rent a home, unfurnished and without utilities.
-
Home prices wildly disconnected from the CPI in 2000 and in 2013. The disconnect accelerated in 2020.
The Fed ignored all three occasions hoping to make up for “lack of inflation”. The Fed “succeeded” beyond it’s wildest dreams.
For discussion, please see Home Prices Sink in Every Major Market, What About Year-Over Year?
In late 1990s the Fed ignored obvious bubbles and the DotCom mania. Then to bail out banks in the wake of the DotCom bust, the Fed either purposely or ignorantly blew a massive housing bubble.
My chart shows a clear disconnect in housing. The Fed ignored soaring home prices that on the pretense that homes are not a consumer expense and thus not in the CPI.
The Fed made the same mistake, using the same faulty logic in the entire 10-year period from 2012 on.
The Fed wanted to make up for lack of inflation as measured (idiotically) by the CPI.
Historical Perspective on CPI Deflations: How Damaging are They?
Hello Fed, it’s not consumer inflation that matters, it’s inflation that matters.
I have been making that case ever since 2006, to no avail. To become a decision maker at the Fed you have to believe total silliness instead of reality.
I have referred to this article before but now is a great time for a refresher course.
Please consider Historical Perspective on CPI Deflations: How Damaging are They?
Of all the widely believed but patently false economic beliefs is the absurd notion that falling consumer prices are bad for the economy and something must be done about them.
The Bank of International Settlements (BIS) took a look at the Costs of Deflations: A Historical Perspective. Here are the key findings.
Concerns about deflation – falling prices of goods and services – are rooted in the view that it is very costly. We test the historical link between output growth and deflation in a sample covering 140 years for up to 38 economies. The evidence suggests that this link is weak and derives largely from the Great Depression. But we find a stronger link between output growth and asset price deflations, particularly during postwar property price deflations. We fail to uncover evidence that high debt has so far raised the cost of goods and services price deflations, in so-called debt deflations. The most damaging interaction appears to be between property price deflations and private debt.
Deflation may actually boost output. Lower prices increase real incomes and wealth. And they may also make export goods more competitive.
Once we control for persistent asset price deflations and country-specific average changes in growth rates over the sample periods, persistent goods and services (CPI ) deflations do not appear to be linked in a statistically significant way with slower growth even in the interwar period. They are uniformly statistically insignificant except for the first post-peak year during the postwar era – where, however, deflation appears to usher in stronger output growth. By contrast, the link of both property and equity price deflations with output growth is always the expected one, and is consistently statistically significant.
The exception to the general rule was the Great Depression but, that was also an asset bubble deflation coupled with consumer price deflation.
Paying Attention to the Wrong Things
Instead of paying attention to credit growth and asset bubbles, every Fed member is in an echo chamber following useless economic metrics like inflation expectations, the Phillip’s Curve and all sorts of other silliness.
For discussion, please see Inflation Expectations are Crashing. So What? It Doesn’t Matter.
Worse yet, in their attempts to fight routine consumer price deflation, central bankers create very destructive asset bubbles that eventually collapse, setting off what they should fear – asset bubble deflations.
And here we are, with asset bubble deflation at hand with the Fed wringing its hands over the wrong things, after finally succeeding in creating the CPI inflation that it no longer wants.
Forget about M2, for now. Watch TCMDO instead. If credit collapses, the economy and the Fed is in deep trouble.
By the way, please note M2 money supply is $21.4 trillion while total credit owed TCMDO is $92.2 trillion.
Will these converge? Which way, how, and when?
* * *
This post originated on MishTalk.Com. Please Subscribe to MishTalk Email Alerts.