
 Which way will things go?
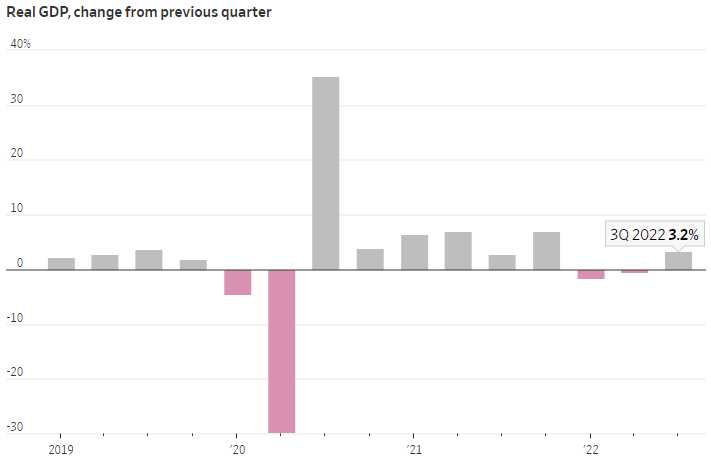
For 2022, so far, we have -1.6%, -0.6% and + 3.2% for the first 3 quarters and that’s +1% overall. To have a Recession, we need two consecutive quarters of negative growth but there are other factors, so Q1 and Q2 did not qualify. Any positive number (and +2.8% is expected) means we won’t actually be in a declared Recession until Q4 – that is already further out than people were predicting just a month ago.
Recent surveys of U.S. purchasing managers found that higher interest rates and persistent inflation weighed on demand in January in the manufacturing and service sectors. Parts of the economy also showed signs of cooling at the end of last year. Retail sales fell last month at the sharpest pace of 2022, existing-home sales fell for the 11th straight month, and hiring and wage growth eased.
The trajectory of the economy largely depends on how consumers fare in the coming months. There are signs consumers are starting to stumble. Shoppers have reined in spending on home electronics, furniture and clothing after stocking up on those goods earlier in the pandemic
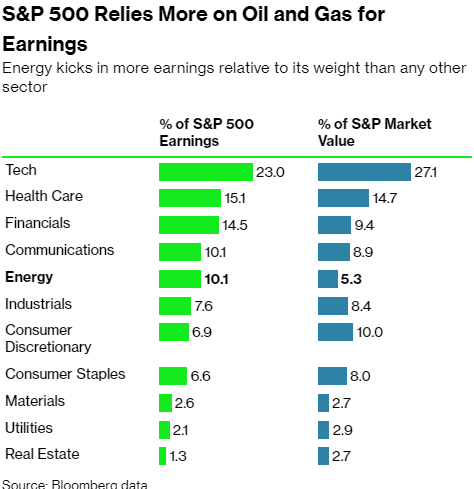 Energy Stocks and Financials have contributed outsized proportions to the GDP with Energy Profits alone over $500Bn. That’s on roughly $4Tn in sales so about 16% of our entire GDP is Energy but, in 2021, that number was 8% so our entire GDP growth is due to higher Oil and Gas prices – that is NOT the sign of a healthy economy.
The Real GDP is adjusted for inflation but it’s an average adjustment and can’t account for a single major sector of the economy having that kind of impact but the numbers are very, very real so lower energy prices alone will plunge us into a technical Recession – even though that will actually be a good thing for the overall Economy.
8:30 Update: GDP came in just a bit better than expected, at 2.9% and that’s because the Deflator (which accounts for inflation) came down from 4.4% to 3.5%. Durable goods was a huge upside surprise at 5.6% vs 2.5% expected but don’t get excited as, ex-transportation, it was down 0.1%.
This is not actually good news for the markets with the Fed looking to cool things down. Despite all the headline news about layoffs, Initial Jobless Claims came in at 186,000, down from 190,000 in the previous report and the country still has 9.4M unfilled jobs – we are miles and miles away from bringing things into balance.
Earnings are still all over the place – look at this morning’s results. Last night, it was easier to talk about the misses (AZPM, BOOT, CACI, CALX, CATY, CNS, CCI, CVB, IBM, LVS, LC, SLG, URI, WOLF) and the guide-downs (TER, XM, PLX, LEVI, LRCX, FLEX, CLS, AXTA, AZPM) than the clean beats (AMP, AXS, CSX, ETD, HXL, LBRT, PKG, CASH, RJF, RLI, STX, NOW, TSLA). That’s 23 to 13 on the negative side!
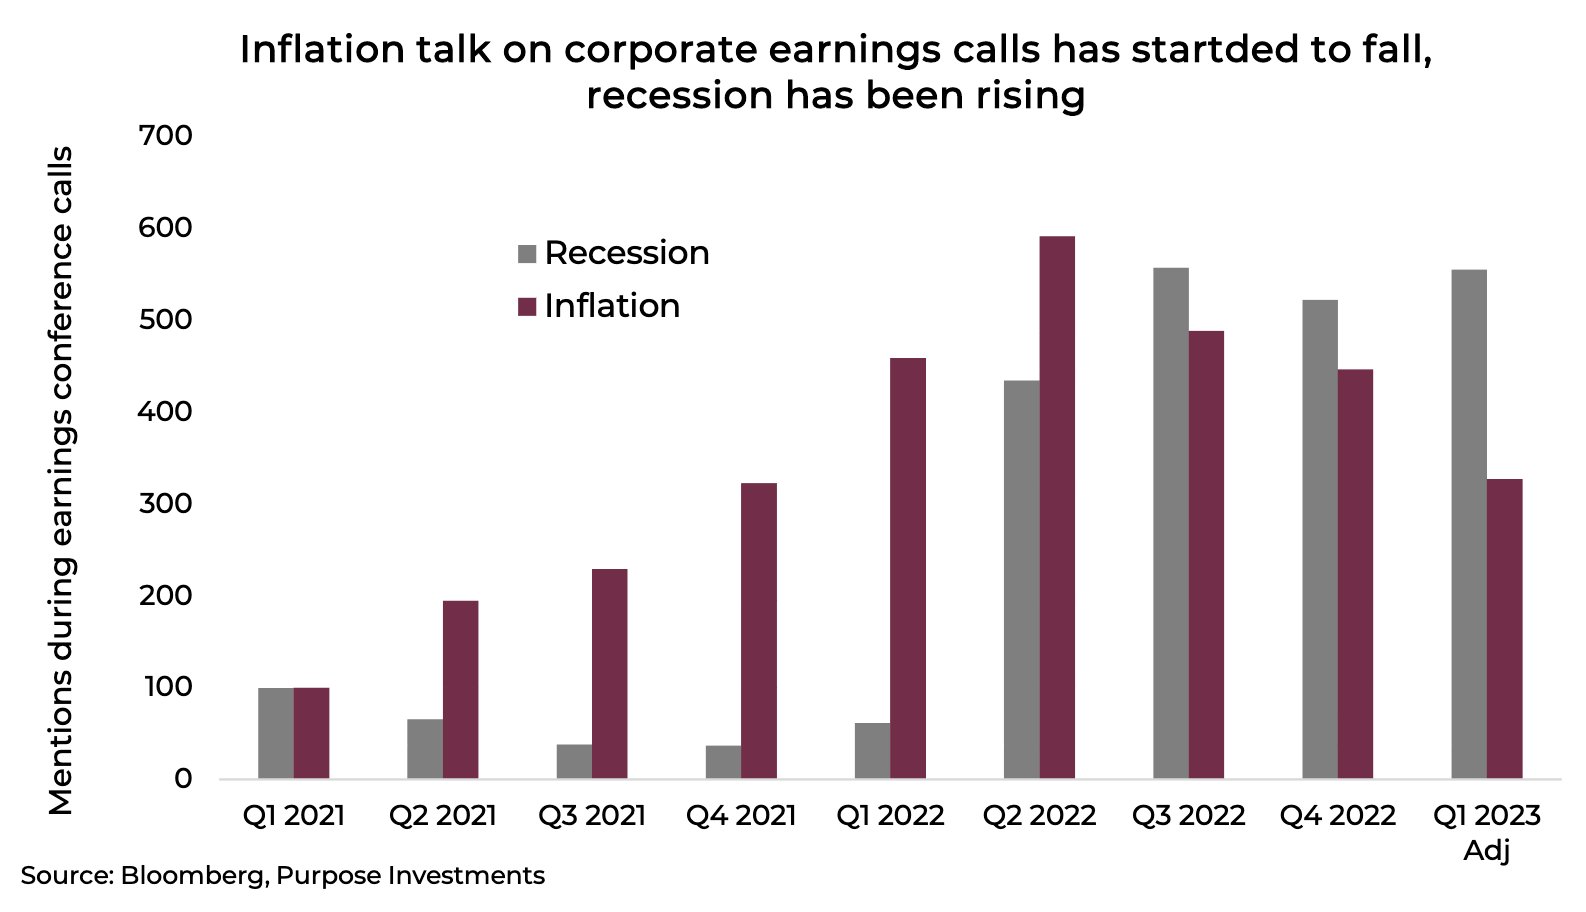
You also have to pay attention to what the CEOs are saying on the Conference calls and, so far, the 2023 conversations have switched from Inflation to Recession – but we still have both and that is called STAGFLATION!
Here’s a good chart. As we discussed yesterday in our Live Member Chat Room, the S&P 500 is currently trading at 22.37 x 2022 earnings and we SHOULD be trading at 16x, which would be 2,861 though we can allow for inflation and growth and hopefully closer to 3,200 at a normal multiple. Well, here’s an illustration of what normal multiples do look like under various rate environments:
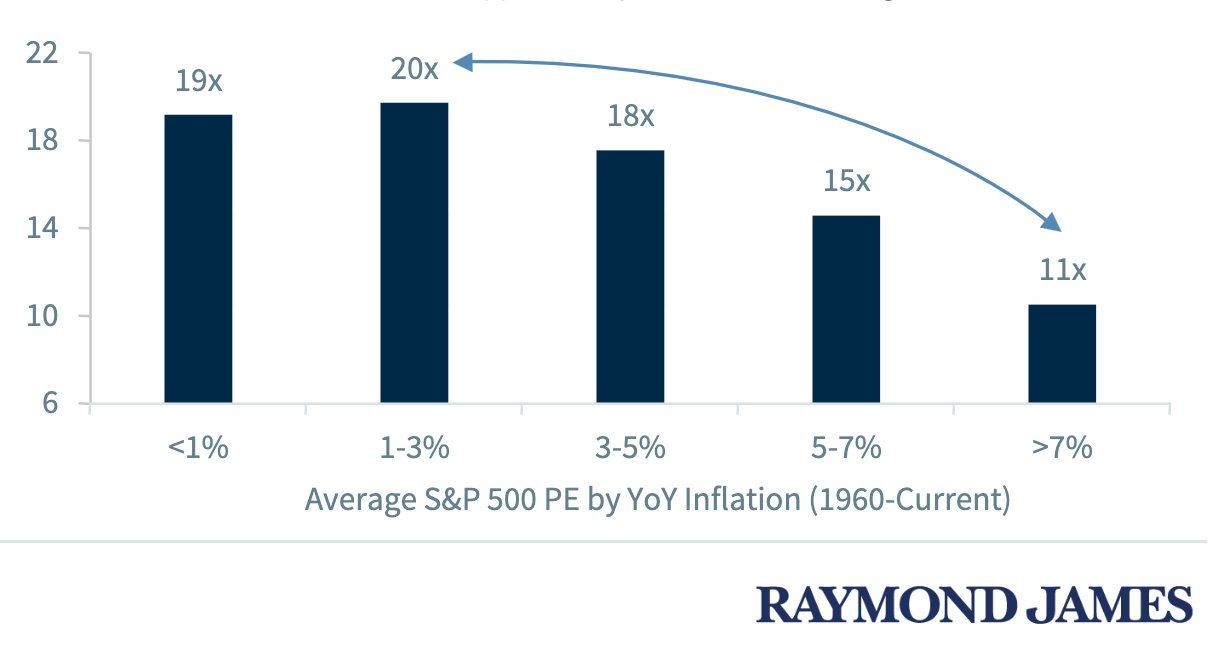
The Fed (rate decision next week) believes that, by knocking inflation back down, they will benefit the stock market to offset the pain they will cause with higher interest rates. I say that’s BS because the data they rely on, which goes back to 1960, doesn’t account for the MASSIVE amount of Corporate Debt we have today – apples and oranges…
Non-Financial Corporate Debt in the US is $14Tn, which is 56% of our GDP. In 2010 it was $6Tn so more than doubled in a decade, which renders the P/E to Inflation Chart relatively meaningless. What’s even worse (how can it get worse?) is how Corporate Debt has STUPIDLY jumped into short-term maturities – to take full advantage of the recent low interest rates. Had they been smart enough to lock down the rates, this would not be such a problem:
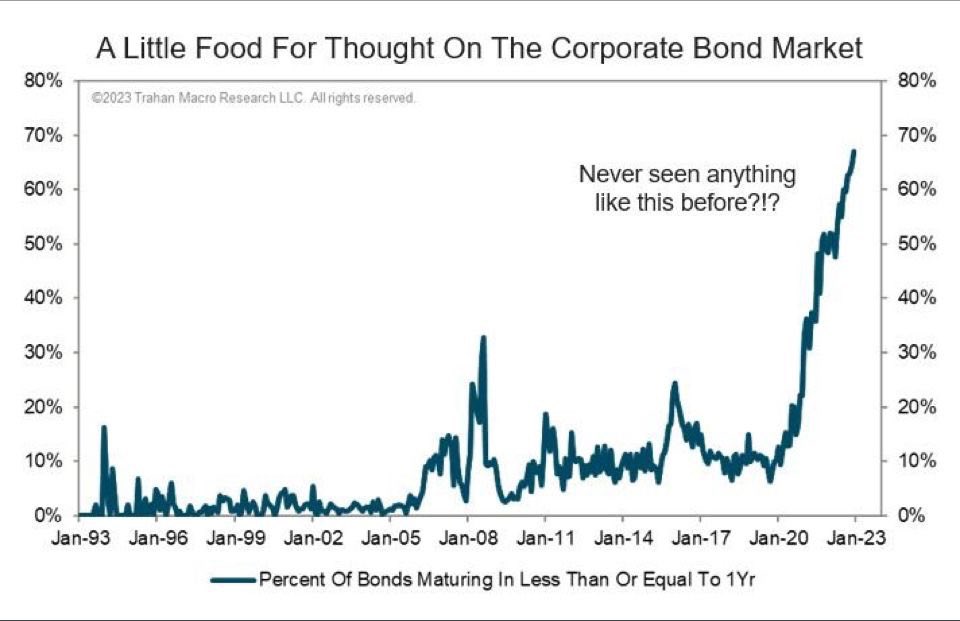
Unfortunately, Economorons are not generally flexible thinkers and, if they didn’t learn it in college, they are not likely to understand the underlying changes that invalidate their assumptions now. Heck, I wouldn’t have even guessed 66%, I was closer to 33% in my assumptions – now I’m depressed…
So are the British, who are often the canaries in our coal mine:


