
 Wishy-washy.
That’s what we got from the Fed Minutes yesterday as the Fed suggested it could raise interest rates higher than anticipated to tackle high inflation, following a quarter-percentage point increase earlier this month. Most policymakers at the meeting agreed that a slower pace would better manage the risks of raising rates too much or too little, however, a few officials believed stopping or slowing the inflation-fighting campaign too soon would not be the right decision. The latest increase took the Fed Funds rate to between 4.5% and 4.75%, the fastest rise in rates since the 1980s.
Stronger growth data has led investors to radically rethink the policy outlook for the coming year. Investors now expect the Fed to lift the fed-funds rate by a quarter point at each of its next three meetings, to around 5.4% by June with the next official rate decision on March 22nd. From yesterday’s Live Trading Webinar, our analysis has us leaning towards a 0.5% increase at the next meeting – still going to be a surprise to most investors.
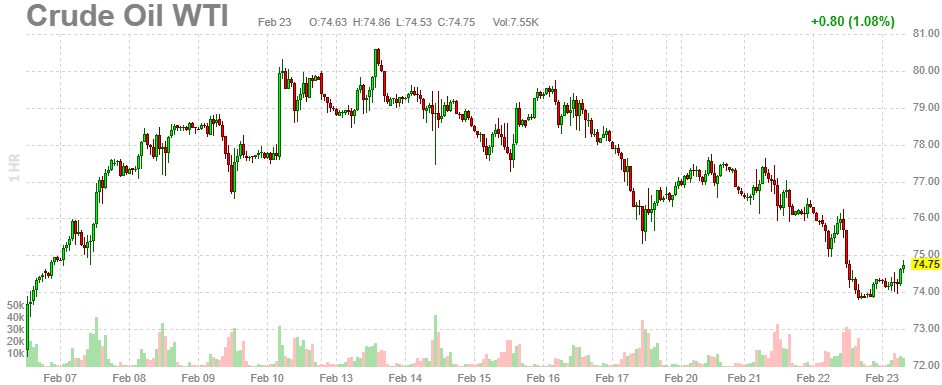
Meanwhile, Oil dropped back below $75 (told you so!) as Western countries’ efforts to reduce Russia’s energy revenues without disrupting global oil supplies and raising prices, have been successful so far. The G7 and the EU recently imposed a price cap on the global sale of Russian crude and refined products, while Russia said it would reduce production by 5% in March in response to the sanctions.
The price cap prohibits Western insurers, financiers, and shippers that underpin much of the world’s oil trade from handling seaborne Russian crude, unless it is sold below $60 a barrel. Despite concerns that Russia would struggle to find buyers, its crude exports rose in January. However, Russian Oil and Natural Gas revenues fell 46% in January from the same month last year, which is the perfect combination of still getting Russia’s Oil while also giving them less money.
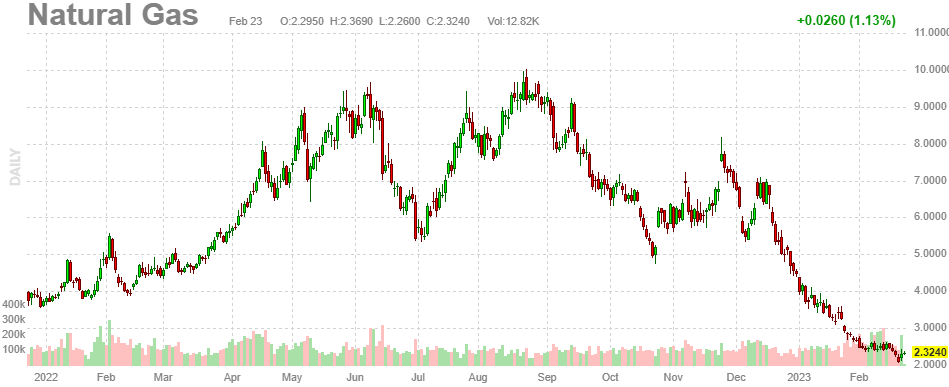
Natural gas prices have plummeted over 65% since mid-December, resulting in producers throttling back drilling in response. This change in the market for heating and power-generation fuel is beneficial to American bill-payers, particularly during the coming air conditioning season. The declining prices also help companies’ bottom lines, which have been damaged by rising input costs.
The current oversupply in the market suggests that prices will continue to drop until producers slow output, with drilling activity expected to decrease most sharply in the Haynesville Shale and in West Texas, where gas is an abundant byproduct of oil drilling. Big producers in the region have already started to park drilling rigs in response. Bank of America analysts predict that prices have bottomed out and will average $2.45 per million BTUs during the first half of the year before rising in the second half.
UNG is the ETF that tracks Natural Gas and we called the bottom with the $5/15 spread on Feb 13th in our Short-Term Portfolio. As a new trade on UNG, I would go with the following:
-
- Sell 10 UNG 2025 $10 puts for $4.20 ($4,200)
- Buy 25 UNG 2025 $7 calls for $3.40 ($8,500)
- Sell 25 UNG 2025 $12 calls for $2.10 ($5,250)
We are collecting net $950 on the $12,500 spread so we’ll make $13,450 (1,415%) if UNG is over $12 in 2025. Since new wells are being shut down or delayed and since Natural Gas wells deplete rapidly (50% per year) – I think the seeds of supply disruption are being sown.
The aggressive put sale obligates us to own 1,000 shares at $10, less the $950 we collect (and assuming the longs expire worthless), would be net $9.05, about $1.50 (20%) higher than UNG is now and that would be roughly $3 on /NG.
 Our premise was that $2.20 is about the price at which production shuts down (and this morning’s WSJ report bears that premise out) which creates a floor on pricing and that’s about $7.50 on UNG. Even if we expect 10% decay in the ETF (due to fees and contract churning), we’re still about $7 and $7.50 would be about our break-even with a $1,250 gain on the $7 calls and a $1,500 loss on the puts but we’d still have our original $950 in our pockets to pay the difference with and leave us with plenty of money to fill up the tank!
Early in the year, /NG tends to be low in it’s cycle, towards the end of summer, into hurricane season, prices tend to be higher. We simply take advantage of that buy buying early in the year and selling when there’s a nice spike. We won’t NEED to keep the above trade until 2025 – but we’re giving ourselves that long to hit an up cycle – just in case.
8:30 Update: Our Stock of the Year, YETI, is off to a poor start with earnings disappointment that has dropped them back to $35 pre-market. That’s well below our $40.85 entry on 12/3 so it’s a great time to jump in because the miss was due to a $38.4M recall in Q4 and, outside of that one-time issue, sales and profits were pretty much in-line with expectations. Adjusted 2023 earnings expectations are $2.12-2.23/share.
Jobless Claims remain stubbornly low – indicating the Fed has been ineffective in cooling the economy. Along with that, we have the 2nd estimate of Q4 GDP, which is indicating 2.7% growth vs 2.9% in the previous estimate. That’s interesting because the Atlanta Fed just raised their expectations for Q1 – so you’d think things would be looking up in the revisions as well?
Adjusted for Inflation, we’re really not growing at all – so there’s nothing cheery about this data, is there?
Hey, I just learned a new ChatGPT trick:
It’s a brave new World…


