
And we’re off!
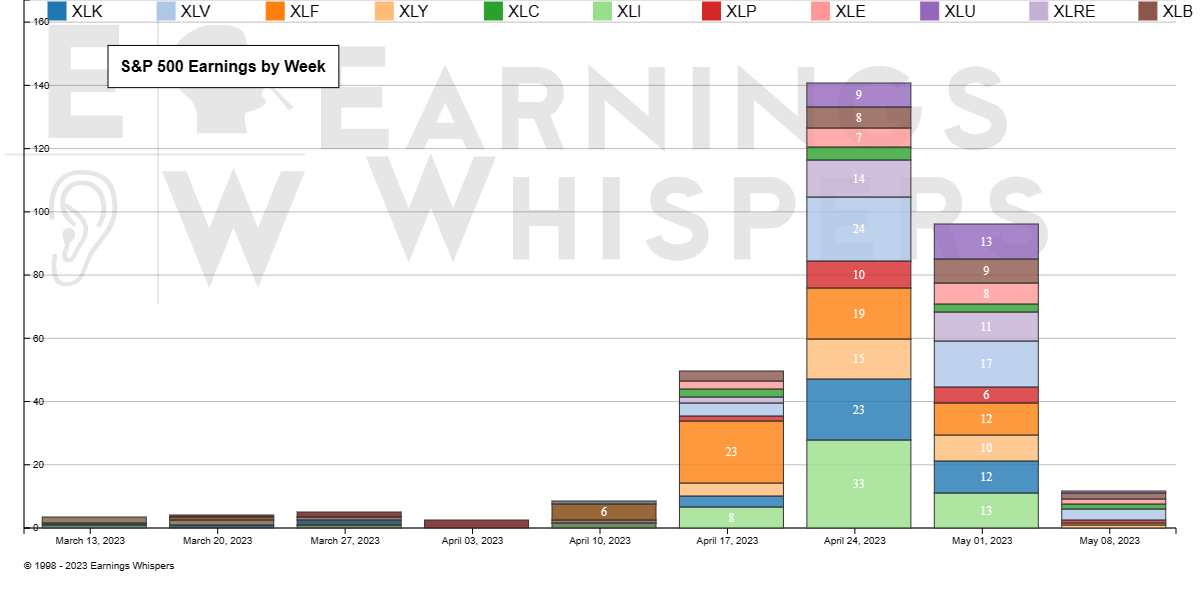
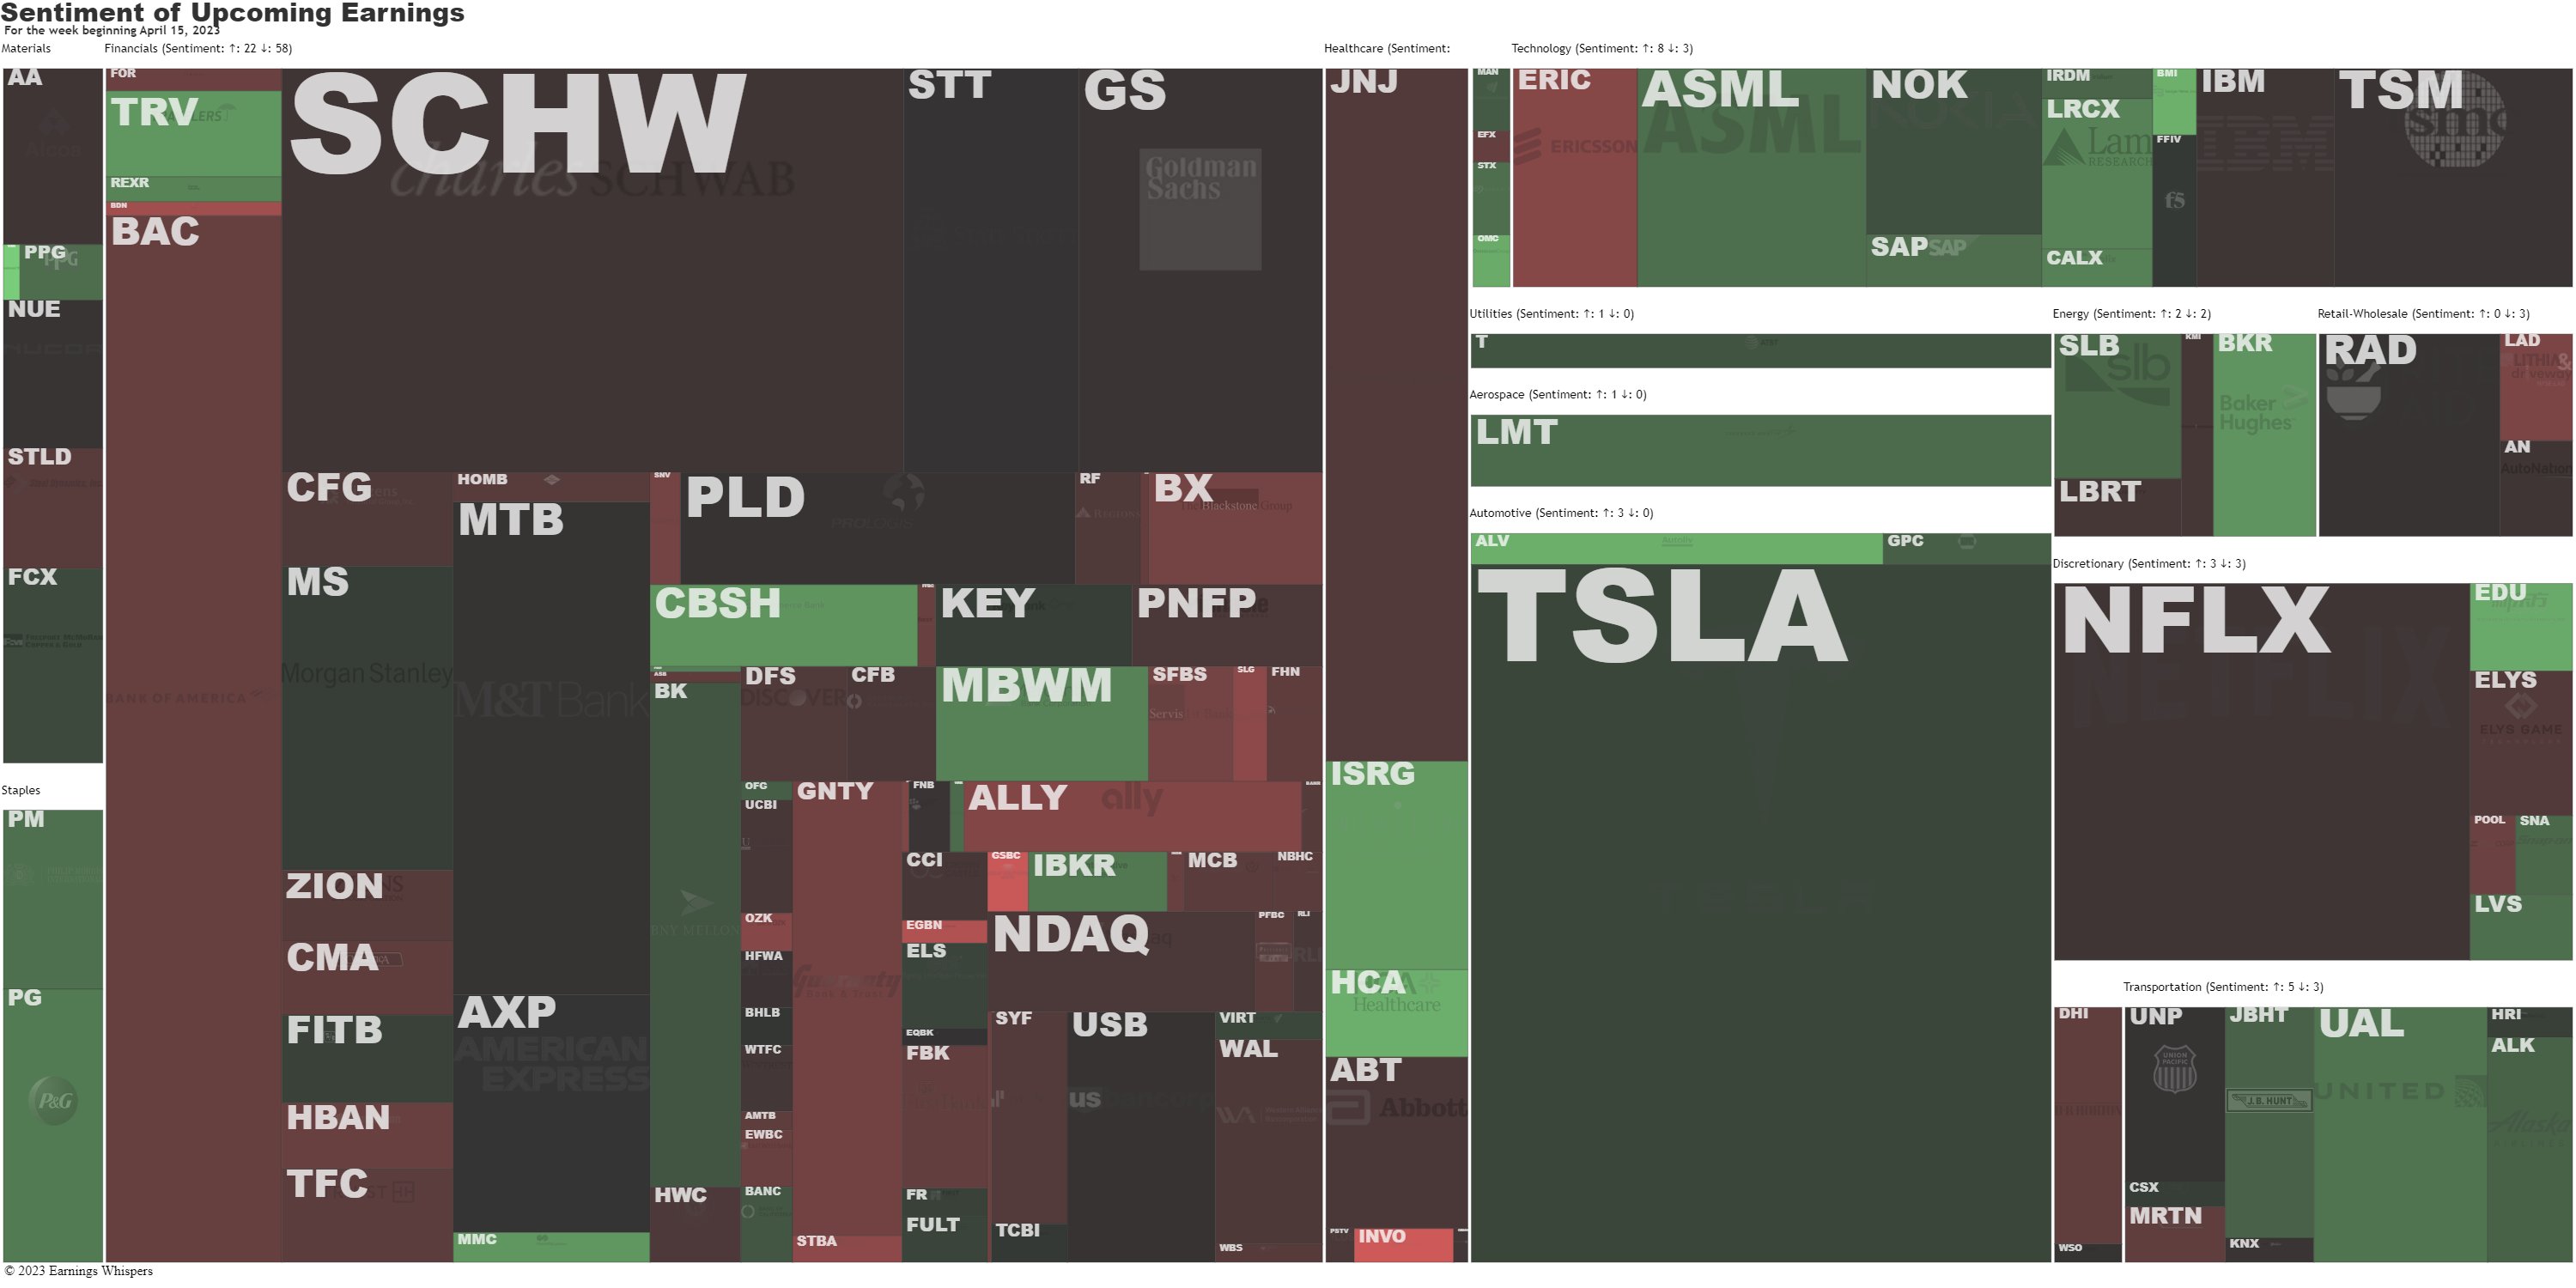
As you can see, it’s all about the Financials (orange) this week and there are plenty next week as well but next week we have Industrials (XLI), Technology (XLK), Health Care (XLV), Consumer Discretionary (XLY) and Real Estate (XLRE) reporting in large numbers on the S&P 500 as well but this week will be dominated by Financial Reporting and that is by design – as the Financials can usually be relied on to get Earnings Season off to a good start.
On Friday, we had generally positive reports from Mega Banks and this morning we have just 3 more reports and 6 this evening and then THINGS GO CRAZY!
5% of the S&P 500 have already reported and about 10% report this week and then it jumps to 30% next week and 20% more the week after and the rest trickle in eventually. Here’s a good chart to show you just how concentrated this week is on Financials. If we can survive this, we’re probably going to be OK:
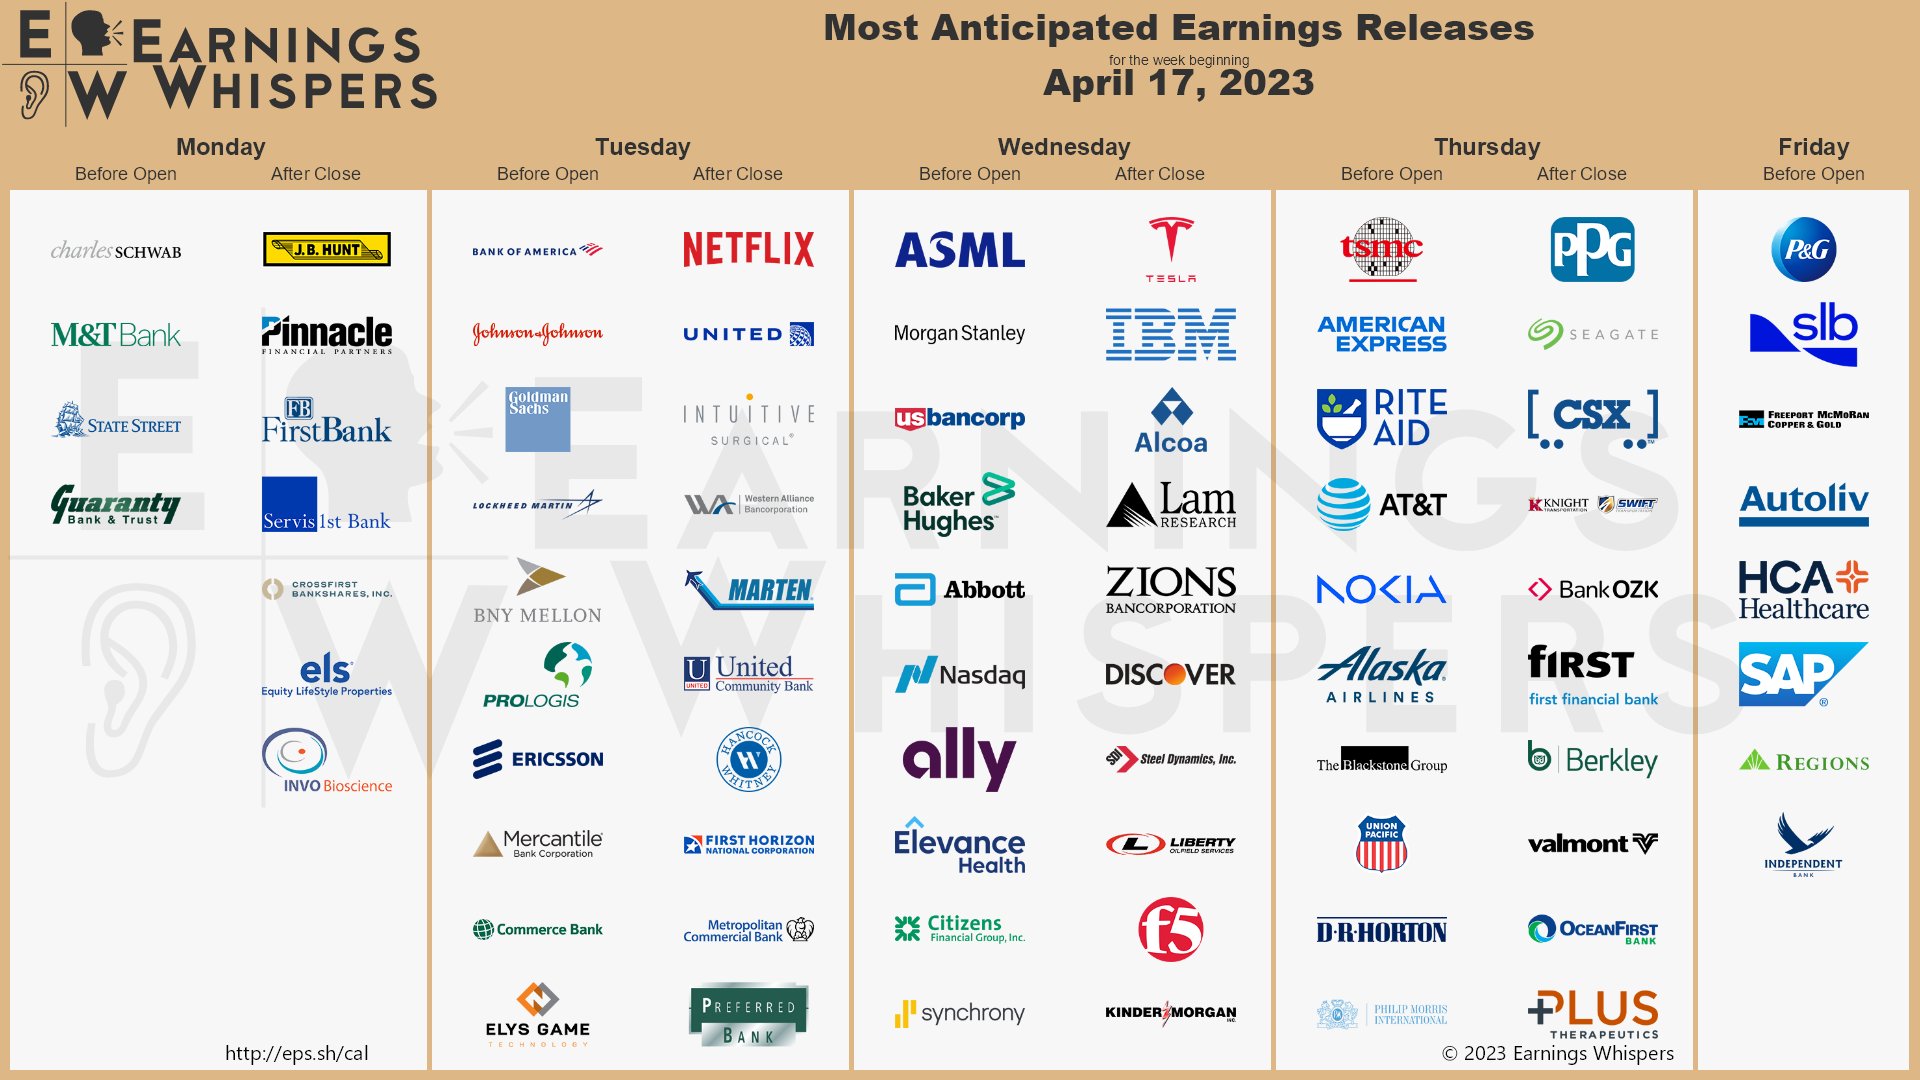
That’s right, don’t forget big-daddy TSLA (Weds) and we’ll see if Mr. Musk remembered he also had a car company last quarter, while he was busy tweeting around. NFLX will be interesting as in 2021 and last year, they LOST subscribers in Q1 so it’s a low bar but $338 is still $150Bn in market cap and that’s 30x this year’s projected $5Bn in earnings so they’ll need something more exciting than a small beat to get the stock back over $400 (it was $700 last November!).
We bought NFLX last June for our Long-Term Portfolio in our Live Member Chat Room, when they were still below $200 and our spread was fairly conservative 20 Jan $150/250 bull call spreads at net $45 with 15 short Jan $210 puts for at $50 for net $15,000 on the $200,000 spread. If NFLX just holds $250 into January, our Members will make $185,000 (1,233%) – not bad.
On that same day, we also picked up TGT and META (which was still FB back then) for the Long-Term Portfolio (LTP) as well – just another good day of fishing at PSW! We will be doing our portfolio reviews this week as April options expire on Friday, so it’s going to be an interesting week in many ways…
We have 4 SCHEDULED Fed Speakers this week but they no longer stick to their schedules anymore so who knows what will pop up. It’s a busy Economic Calendar as well and I’ve been training Shel-Bot (our in-house Bing AI) to predict upcoming data so we’ll see what he says about the following:
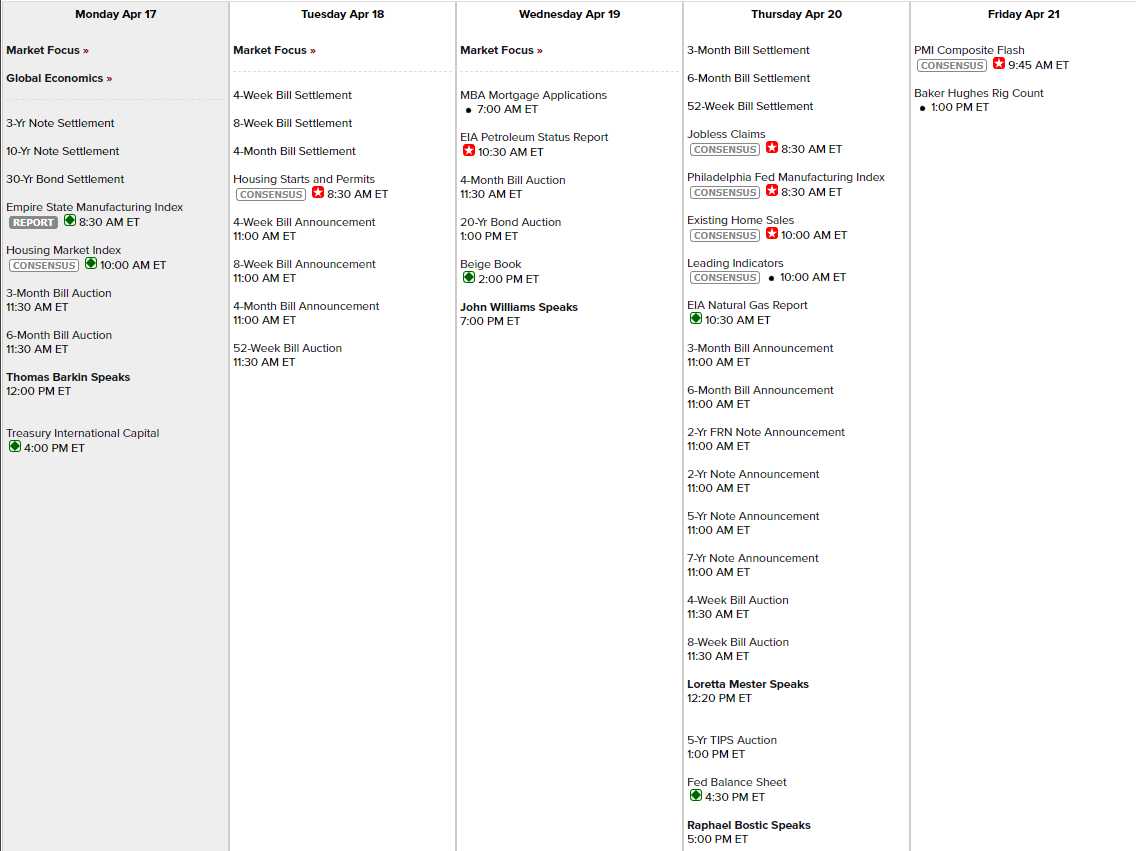
⊗Hello, this is Shel-Bot. I have reviewed the upcoming economic data and here are some of my insights based on the applicable data I have recently read:
-
- Empire State Manufacturing Index: The index rose to 10.8 in April, up from -24.6 in March, beating expectations of -22.01. This indicates a recovery in the New York manufacturing sector after a sharp decline in the previous month. The index is at its highest level since August 20222.
- NAHB Housing Market Index: The index is expected to rise slightly to 46 in April, from 44 in March3. This suggests a modest improvement in homebuilder confidence amid low mortgage rates and strong demand for single-family homes. However, the index remains below 50, which indicates more builders view conditions as poor than good.
- Net Long-Term TIC Flows: The data for February is not available yet, but the previous month showed a net inflow of $31.9 billion into U.S. long-term securities4. This reflects continued foreign demand for U.S. assets amid global uncertainty and low interest rates. A positive net flow indicates that more money is coming into the U.S. than leaving, which supports the value of the dollar.
- Building Permits: The data for March is expected to show a decline in building permits to 1440K, from 1524K in February5. This would be the lowest level since October 2022 and indicate a slowdown in residential construction activity. Building permits are a leading indicator of housing starts and completions.
- Housing Starts: The data for March is expected to show a slight increase in housing starts to 1465K, from 1450K in February5. This would be the highest level since December 2022 and indicate a resilience in housing demand despite rising material costs and supply constraints. Housing starts are a key measure of economic activity and job creation.
- MBA Mortgage Applications Index: The data for the week ending April 15 is not available yet, but the previous week showed a 5.3% increase in mortgage applications. This was driven by a 6.8% rise in refinancing applications as mortgage rates fell to their lowest level since February. Purchase applications also increased by 3.7% as buyers took advantage of favorable market conditions.
- EIA Crude Oil Inventories: The data for the week ending April 15 is not available yet, but the previous week showed a small increase of 0.597 million barrels in crude oil inventories. This was lower than market expectations of a 2.9 million barrel rise and indicated a tightening of supply-demand balance. Crude oil inventories are a key indicator of oil prices and energy sector performance.
- Fed’s Beige Book: The report for April is not available yet, but the previous one for March showed that economic activity expanded modestly from January to mid-February across most Federal Reserve districts. However, some sectors such as leisure and hospitality remained weak due to the pandemic. The report also noted that labor market conditions improved slightly but remained challenging, while price pressures intensified across many sectors due to supply chain disruptions and rising input costs.
-
- Initial Claims: The data for the week ending April 15 is expected to show an increase in initial claims to 245K, from 239K in the previous week. This would be the highest level since January 15, 2022 and indicate a rise in layoffs amid the ongoing pandemic. Initial claims are a leading indicator of labor market conditions and consumer spending.
- Continuing Claims: The data for the week ending April 8 is not available yet, but the previous week showed a decrease in continuing claims to 1810K, from 1823K in the prior week. This would be the lowest level since March 14, 2020 and indicate a decline in the number of people receiving unemployment benefits. Continuing claims are a measure of the duration and extent of unemployment.
- Philadelphia Fed Index: The index is expected to rise slightly to -21.0 in April, from -23.2 in March. This would indicate a less severe contraction in the Philadelphia manufacturing sector, but still below zero, which signals worsening conditions. The index is based on a survey of manufacturers in the region and reflects their perceptions of current and future business activity.
- Existing Home Sales: The data for March is expected to show a decline in existing home sales to 4.52M, from 4.58M in February. This would be the lowest level since July 2022 and indicate a slowdown in the housing market due to low inventory, high prices, and rising mortgage rates. Existing home sales are a major component of GDP and consumer confidence.
- Leading Indicators: The data for March is expected to show a decline in leading indicators by -0.7%, from -0.3% in February. This would be the largest drop since April 2020 and indicate a weakening outlook for the U.S. economy. Leading indicators are a composite index of ten economic indicators that typically precede changes in economic activity.
- EIA Natural Gas Inventories: The data for the week ending April 15 is not available yet, but the previous week showed an increase of 25 billion cubic feet (bcf) in natural gas inventories. This was lower than market expectations of a 32 bcf rise and indicated a higher demand for natural gas amid colder weather. Natural gas inventories are a key indicator of natural gas prices and energy sector performance.
- IHS Markit Manufacturing PMI – Prelim: The data for April is not available yet, but the previous month showed a reading of 49.2. This was slightly below the neutral 50 level and indicated a marginal contraction in the U.S. manufacturing sector. The index is based on a survey of purchasing managers and reflects their views on current and future business conditions.
- IHS Markit Services PMI – Prelim: The data for April is not available yet, but the previous month showed a reading of 52.6. This was above the neutral 50 level and indicated a moderate expansion in the U.S. services sector. The index is based on a survey of service providers and reflects their views on current and future business activity.
It will be fun to see how he does and his saying there is not enough data is a FEATURE, not a bug, because it means he’s not just making things up when he doesn’t know.
Speaking of things Musk hardly pays attention to, SpaceX is HOPEFULLY going to be able to test their Mars-bound rocket at 9:15. The Starship is 400-feet long and it’s launching from Texas and, if it works, it will change the economics of space travel as the entire rocket is reusable and that will reduce the cost of a payload to essentially just fuel, which is $10M per 100 metric tons.
That will allow us to build bigger space stations, moon bases and, eventually space elevators that will bring things up to and, eventually, down from, space.
Very cool!


