

Via ZeroHedge
By Tony Pasquariello, head of hedge fund coverage at Goldman Sachs
The past month has featured an element of animal spirits that haven’t been present in the market in a while. The past week, specifically, has seen S&P blow through the top end of a long-held trading range and decisively take out the highs of last August.
It hasn’t been subtle where all this torque has come from:
- The bright and shining example of the AI buzz has punched above $1tr in market cap (NVDA);
- Arguably the most powerful stock of the entire COVID era is up 14 of the past 16 days for a 41% cumulative rip (TSLA);
- And the biggest stock on planet Earth is on ATH and flirting with a market cap north of $3tr (AAPL)
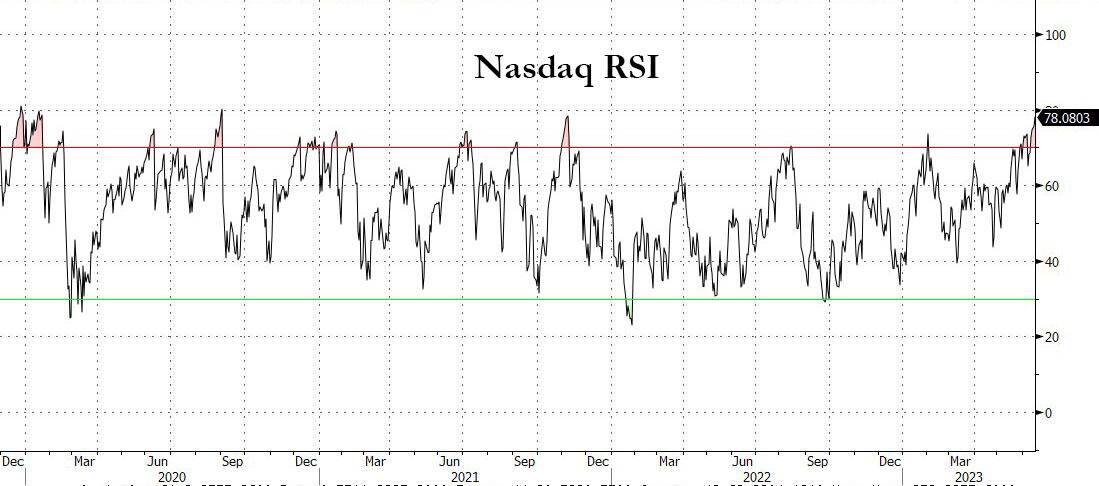
These have been freight trains that leave the RSI of NDX approaching 80…
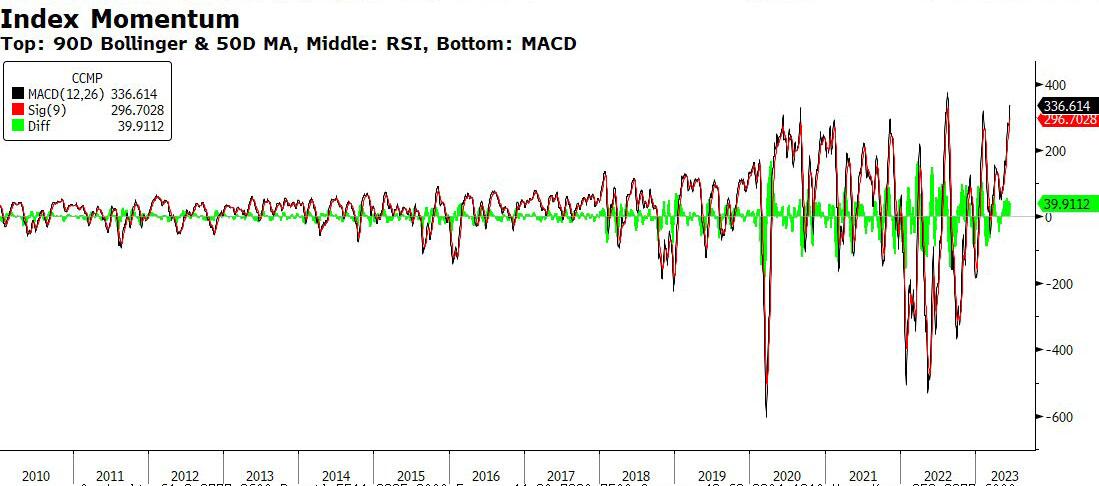
… and index momentum nearing a record high.
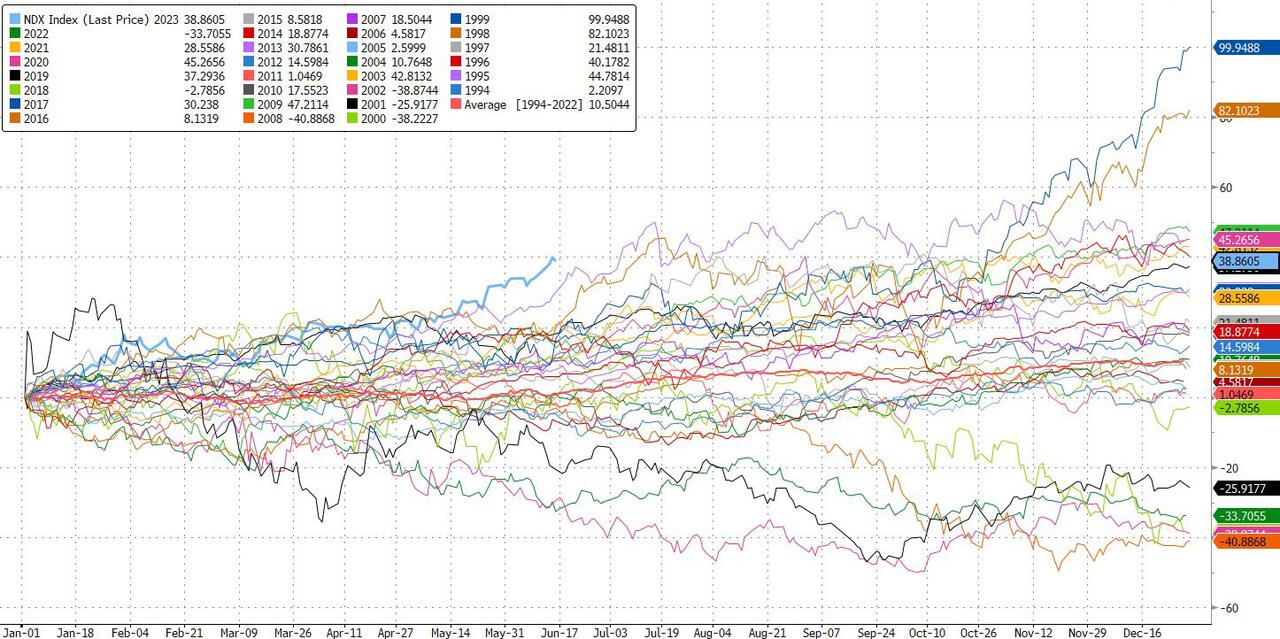
In the doing, AI has exposed the right tail of the market, while the left tail has eased some — the debt ceiling passed, the regional banking story has quieted, the labor market remains exceedingly resilient — driving NDX to its best start ever (data back to 1985).
To be sure, as someone who has been a true believer in the long-held range trade, I clearly underestimated what S&P is still capable of.
The lesson learned: should you ever find yourself bullish of high velocity assets like NDX and NKY, it probably doesn’t pay to bet that S&P will stay on the porch forever.
What follows from here is a full check-down of the market framework from several angles.
1. flow-of-funds / positioning:
I start here because market technicals have held genuine sway along this breakout. Looking across the GS franchise mosaic, it’s clear the trading community has been stopped into some incremental length over the past month.
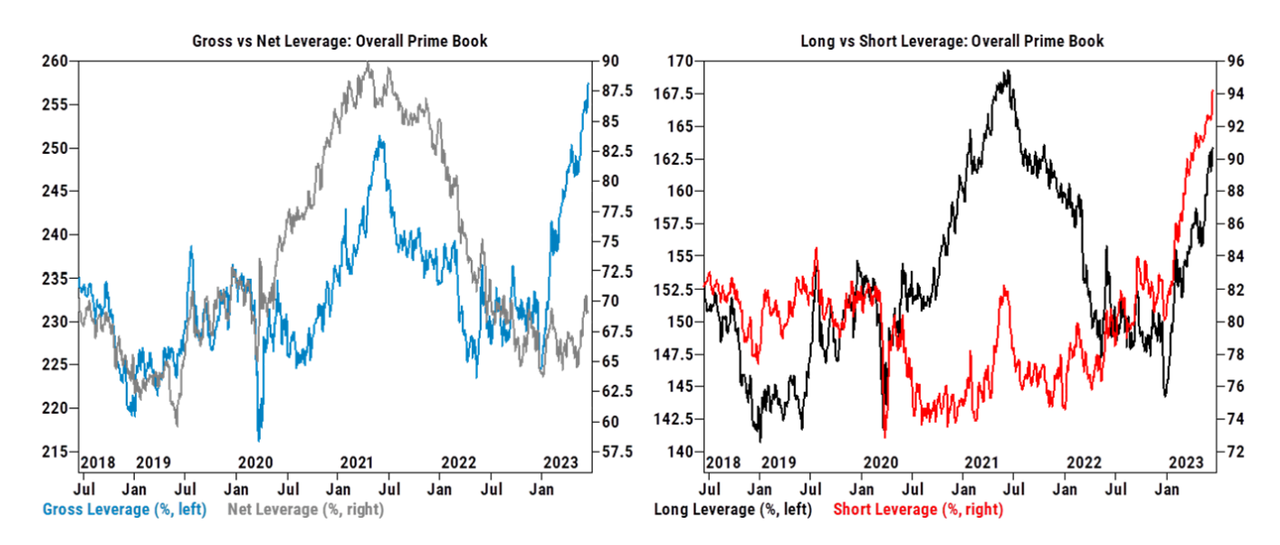
Start with a good teller of truth, Prime Brokerage data: on a 3-year lookback, net exposure has moved from sub-10th percentile just a few months ago to more like the 25th percentile today.
Alongside this, the systematic trading community is now significantly long of both S&P and NDX exposure.
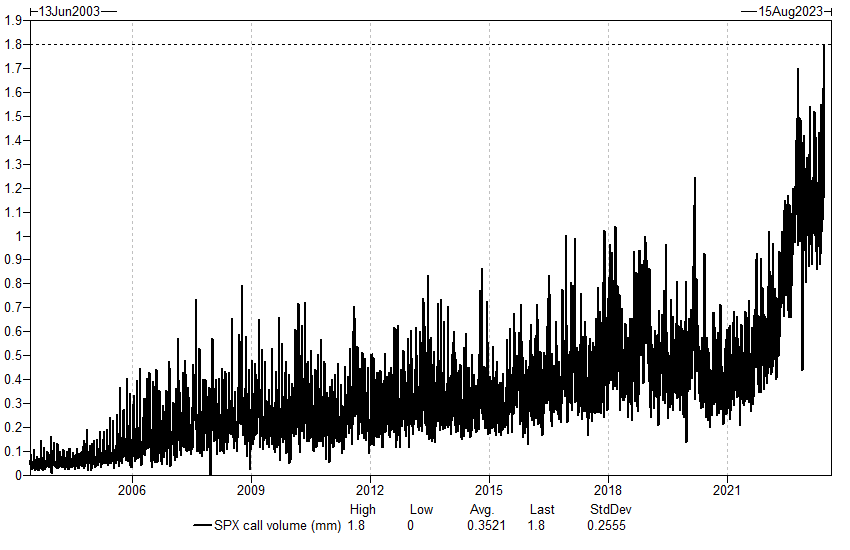
Furthermore, yesterday saw a very clear grab for upside — witness record volumes in S&P calls and the rarely seen spot up / vol up dynamic.
Where it continues to be very interesting: we came into this week with a near-record spec short in S&P futures; exchange data suggests only some of that has been covered.
Short covering continues two weeks after net non-commercial emini specs hit a record short. pic.twitter.com/zk5m04KJ5m
— zerohedge (@zerohedge) June 16, 2023
All taken together, I think there’s a valid argument that many folks — not all, but many — are now as long as they’ve been all year.
That is consistent with what you can observe in measures of investors sentiment: CNN fear/greed has gone into the extreme (link) and the GIR indicator hasn’t been this high since late 2021 (link).
The final piece here is corporates, where buybacks are clipping along, while any incremental supply (mostly follow-ons) has been absorbed.
My bottom line: positioning has been a very clear tailwind for the market over the past month; now the question becomes how much gas is left in these tanks.
2. The money markets:
To address that last question, this is the obvious place to start. Since May, another $167bn has flowed into US money market funds, which takes the stockpile up to … $6.5tr.
Can you make the argument that some of this will make its way into the domestic stock market?
It’s certainly possible — and, we’ve only very recently gotten to a place where the sure-fire bet on allocating to cash feels less brilliant, see chart 15 below — but, I don’t necessarily see a major switch.
I say that given my memories of the 2009-2019 era: a very long and high quality bull market failed to truly captivate US households, despite money markets offering terrible returns.
Said another way: will investors genuinely pile into stocks now when the nominal yield on cash is as good as it’s been in over 16 years?
Here’s my point: while taking nothing away from certain parts of the equity market — more on NDX and NKY below — my guess is the trend of folks leaving most of their spare capital in the money markets will continue for a while longer.
3. The Fed:
Call it a pause, call it a skip, call it a shift to a newly presumed pace of hiking at every-other-meeting — all we know is the Fed held their fire, while flashing two more hikes (with four meetings to go) in 2023.
In the end, given the stubbornness of core inflation, the Fed sees a higher terminal rate — with strong internal consensus around that view.
That said, as Mike Cahill pointed out, the markets appear more convinced that inflation will fall than the committee does. The official GS view: “we have not made any changes to our forecast of one additional hike in July to a peak rate of 5.25-5.5%. the combination of the hawkish surprise in the dots and the hint at an every-other-meeting pace strengthens our confidence that the FOMC will hike in July and makes a possible second hike more likely in November than September.”
Regarding CPI … while it’s a little bit funny to celebrate 5.3% core inflation … to the chart work below … the all-important guts of US inflation are trending clearly and considerably lower.
The big picture: recent weeks have demonstrated that central banks are extending the global hiking cycle and have a bit more wood to chop — this likely includes the most important of them all — which leaves July FOMC in play and the onus on the coming data set.
4. US growth:
As one takes stock of H1’23, I think you have to remember where investor psychology was at the outset.
Which is to say: when we walked in the office on January 2nd, recall that recession fears were shot through both price action and market talk.
When you flash forward to today, it appears the US economy is still grinding forward … perhaps nothing has been more significant that the creation of 1.6 million jobs YTD.
So, the health of the US labor market has been as central a story as any — especially when coupled with the fact that the Fed hasn’t needed to explicitly choke it off.
Given that stocks live in the future, I’m inclined to think we’ve taken credit for all that and the big question for the next 18 months is this: from the starting point of full employment, where does the incremental growth impulse come from, particularly when there are a number of soft spots that have emerged?
5. The liquidity variable:
As one of the greats would say, every macro process begins with an assessment of liquidity. Following the debt ceiling, I’d characterize the current debate around the significance of a liquidity drain as intense and two-sided.
This week brought our first real taste of how many Treasuries need to be consumed by the marketplace, and it was absorbed without major issues (while noting there’s plenty more coming from here to the end of the month).
Now, you can’t tell me asset market liquidity is all that tight given the sudden inflows to equities — to say nothing of the retail fervor for short-dated call options on high volatility tech stocks.
So, I admit to being very ambivalent on what to think about all of this, and I’ll defer to Dominic Wilson … to my eye, this is also a two-sided conclusion that tilts slightly positive (link):
with debt ceiling risk behind us, we encounter considerable investor anxiety about the sharp drainage of reserve balances from the large pick-up in bill issuance and TGA replenishment ahead, alongside QT in the US and Europe. We are generally skeptical both about the mechanical view of money flow between reserves and risk assets that these worries sometimes imply, and about the long-run stability of the relationship between liquidity measures and equity markets. Still, the drainage of cash in the weeks ahead is likely to be unusually large and to continue the story of upward pressure on funding costs and on reserve-constrained banks. We also see the risk of further deterioration in market liquidity from the shifts in net supply, though, as we saw in March, that can drive rates sharply lower, not just sharply higher. And the point at which the Fed bumps into reserve scarcity could be temporarily disruptive although it is not likely to be hit until early next year at the soonest.
6. On the interplay between tech stocks and interest rates:
If the central story of last year was a stock market held hostage by the Fed’s tightening campaign, it’s fair to ask why NDX has been flying higher despite the recent backup in rates (note Dec ’23 SOFR has sold off 125 bps since early May).
I’m going to borrow the framework of a client on this one: “the rate relationship is still largely playing out in the unprofitable (i.e. long duration) part of tech. People paint NDX with the same brush, but it’s wrong. The big profitable stocks driving NDX higher have double digit growth (now) and high FCF margins (now) … I don’t think either of those fundamental factors are ‘long duration.’”
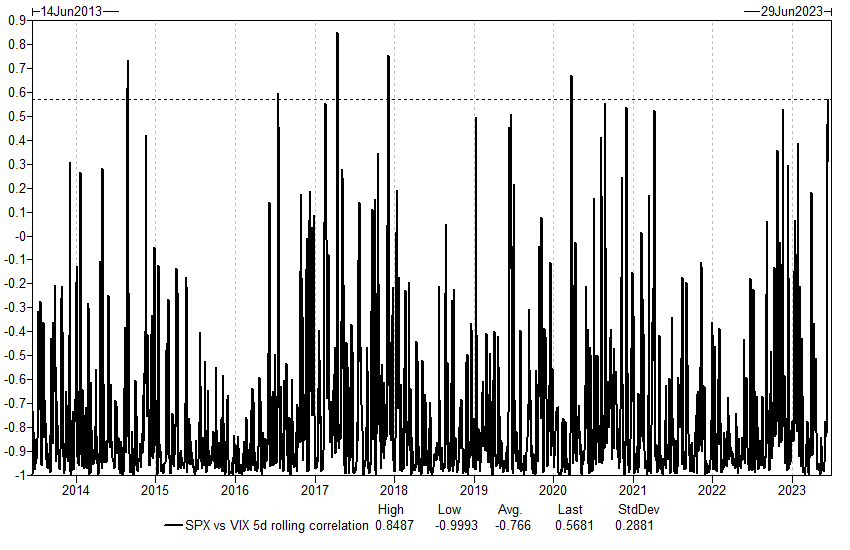
That take is consistent with our formal work on the correlation regime: link.
Where I’m going with this: last year made painfully clear that higher rates matter hugely for stocks, but at this stage of the game, it’s not obvious that the mega cap names should be forever threatened by a modest backup in US rates.
7. Japan:
This week saw another blistering move higher in Japan, which puts NKY up ten weeks in a row (for a cumulative rip of 22%). The market has now seen 11 straight weeks of foreign demand, which is the longest streak since 2014.
Again, I suspect that we’ll need to hand that baton to global real money and domestic investors for the strength to extend, and that’s not happened yet.
I’m also very curious if US households begin to engage on the theme; note shares outstanding in EWJ and DXJ have hooked higher, but remain well off the fever peaks of 2015.
The BOJ remains status quo, with no hints this week on a break from YCC — which is to say, they’re sticking with a monetary policy that I’d argue is both (1) inappropriately dovish and (2) supportive of domestic equities.
Finally, the last three charts at the very bottom of this email are all Japanese thematics — and they are all breathtaking.
8. China:
In an ongoing and stark contrast to the prior point, Chinese asset markets have underperformed significantly.
This is a very good check-down of the core economic story: link (in a line: sequential growth has weakened meaningfully, such that we see downside risks to our Q2 GDP forecast, but some upside risks to Q3).
Regarding sponsorship, if global real money was reticent to commit before 2023 even began, given the recent opportunity set in the US and Japan, it’s hard to see that pattern suddenly inflecting.
This FT story also paints a very tough picture for global demand: link.
If there’s a contra-argument here, it centers on supportive policy (witness this week’s rate cuts) and genuinely dreadful sentiment … while noting that local assets have traded a bit better in recent weeks.
9. Odds and ends:
- i. A punchy analog from colleague Mark Wilson: “[last] week Nasdaq 100 traded 20% above its 200 day moving average. This has happened on 15 prior instances since 1983. Looking back at those 15 prior instances, in 14 out of 15 occurrences the index return 12mths forward was positive, with an average 12mth gain of 35%.”
- ii. The latest demonstration of AI muscle, as pointed out by Pete Callahan: “ORCL delivered the goods, at least on narrative … the opening salvo for Oracle earnings call included this: “we remain committed to the fiscal year 2026 targets that we shared with you last fall at our financial analyst meeting, and our exploding AI demand leaves us significant upside.” Note ORCL stock has rallied 15% this week.
- iii. A related take on the big theme: “I will say this about AI. NVDA bottomed in October in the low 100s. if this is a secular move, if this thing is real, you just don’t have ten-month moves. That’s not how it works. Even the Dot-com bubble lasted two or three years, and for many of the guts it lasted four years” (link). I’d add to this that we’re not even seven months into the ChatGPT era.
- iv. One last quote on AI, with an emphasis on the winner-take-all bit, from Bloomberg: “with Microsoft programs in use at almost every major institution on Earth, Nadella and Altman are in by far the best position to sell corporate AI services. “the natural state of large software companies tends toward a winner-take-all approach,” says Scott Farquhar, co-CEO of software maker Atlassian Corp., which is both a Microsoft partner and a rival” (link).
- v. I read this in a note from Bobby Molavi and was struck by the magnitude of growth: from 2010 to 2022, the AUM of private equity grew from $1.7tr … to $7.6tr (link).
- vi. NYC office occupancy just crossed above 50% of pre-COVID levels, which I find to be staggeringly low (link).
- vii. In a year where little has gone as planned, the drive higher in UK rates has been as consistent a trend as any, and it went into overdrive this week (witness GUKG2 on your Bloomberg).
- viii. Friay was quarterly derivatives expiry, which — as a reminder — have an occasional tendency to mark significant inflection points.
- ix. “Easier than falling in love” has no direct relevance to this email, but it’s the single best line from the greatest commercial of the 1990s tech boom, so I’m going with it: link.
* * * * *
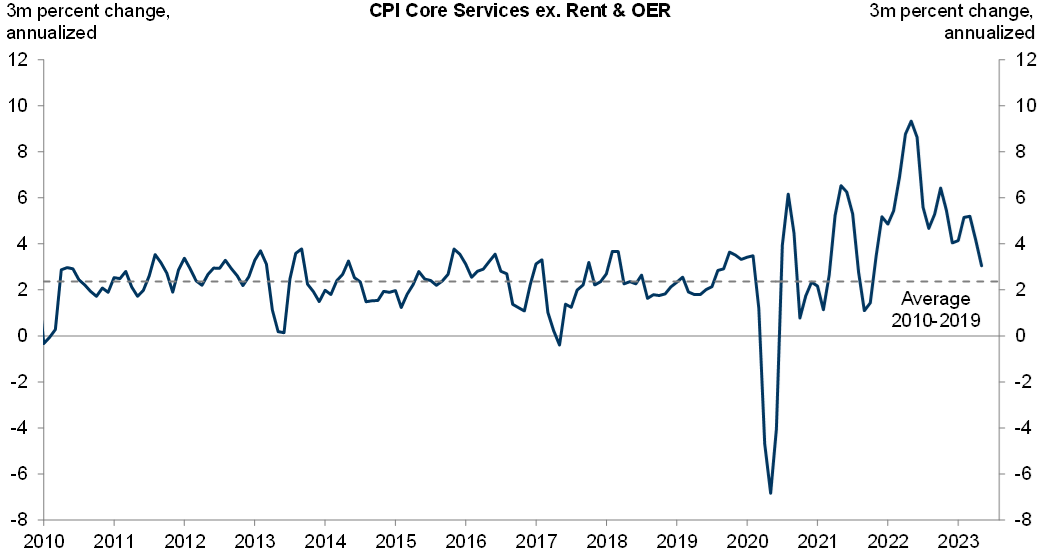
10. This is a powerful chart with emphasis on the horizontal line for the pre-COVID average. As someone who has been more worried than the experts about the persistence of core inflation, it’s hard for me to deny this move on Mr. Powell’s preferred gauge (link):
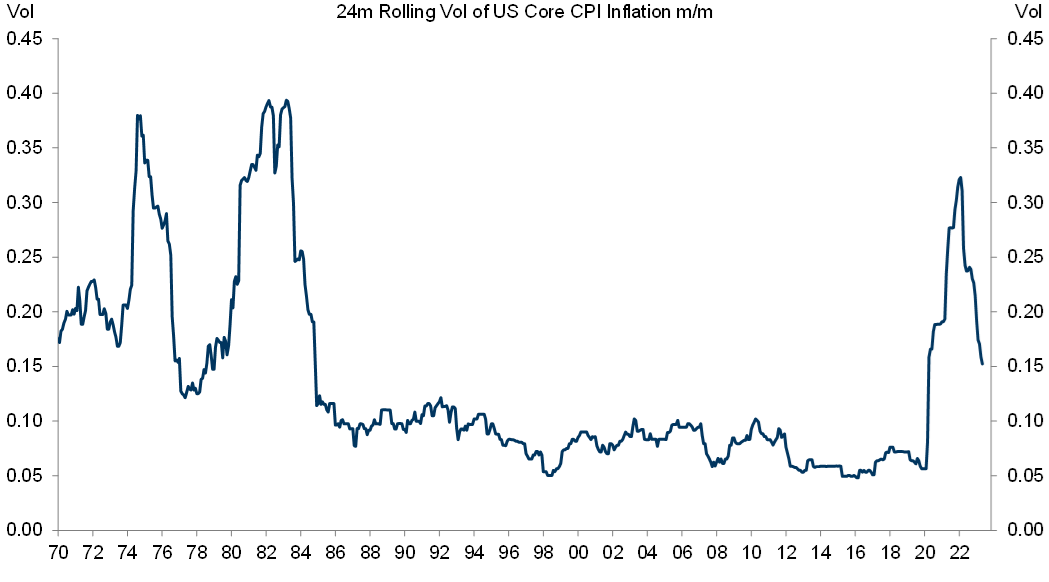
11. In a related spirit, this is an update on the realized volatility of US core CPI:
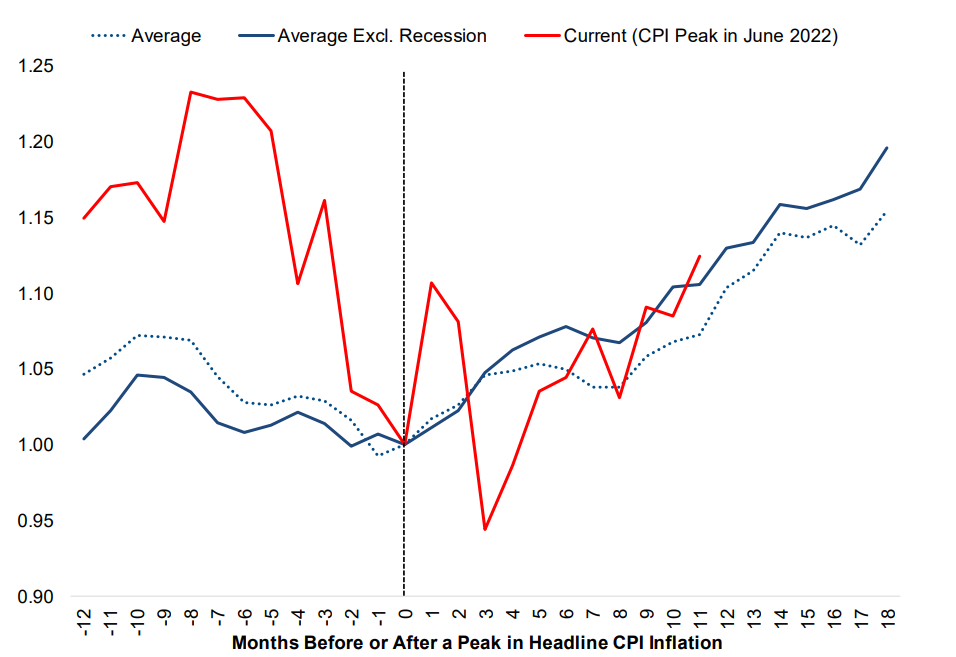
12. Brett Nelson in our Investment Strategy Group flagged this chart to me (they do excellent, big-picture work — and tend to resist “narrative volatility,” something I’m admittedly not always immune to). Speaking of inflation, this shows how S&P typically behaves before and after the peak in CPI — as noted last week by Dominic Wilson, the market is basically doing exactly what it should be doing (link):
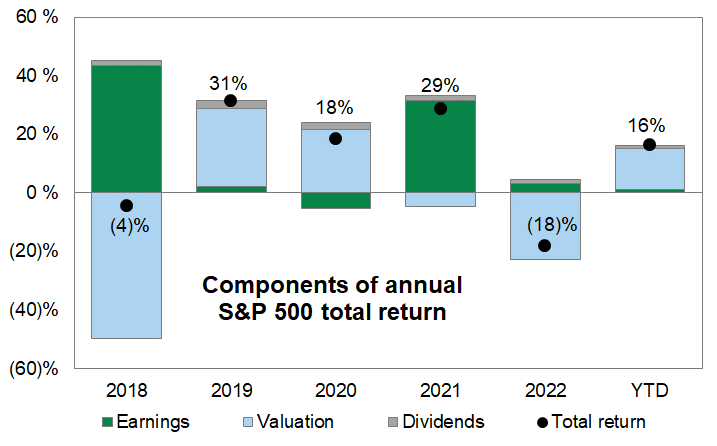
13. Some years it’s about earnings, some years it’s about the multiple; in recent history, it’s usually one or the other … as you can see, this year has almost entirely about the multiple:
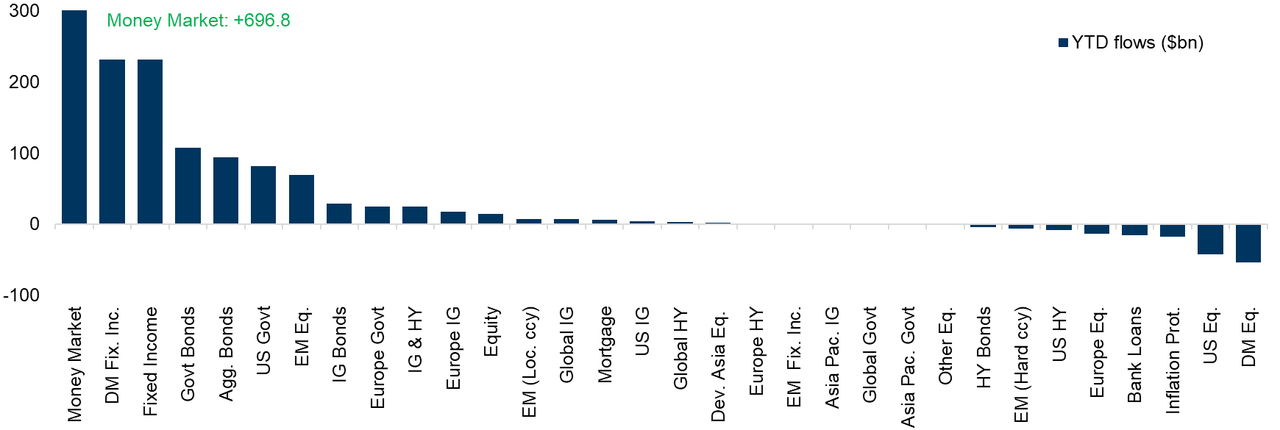
14. Subject to your interpretation, an update on where the money has flowed in 2023:
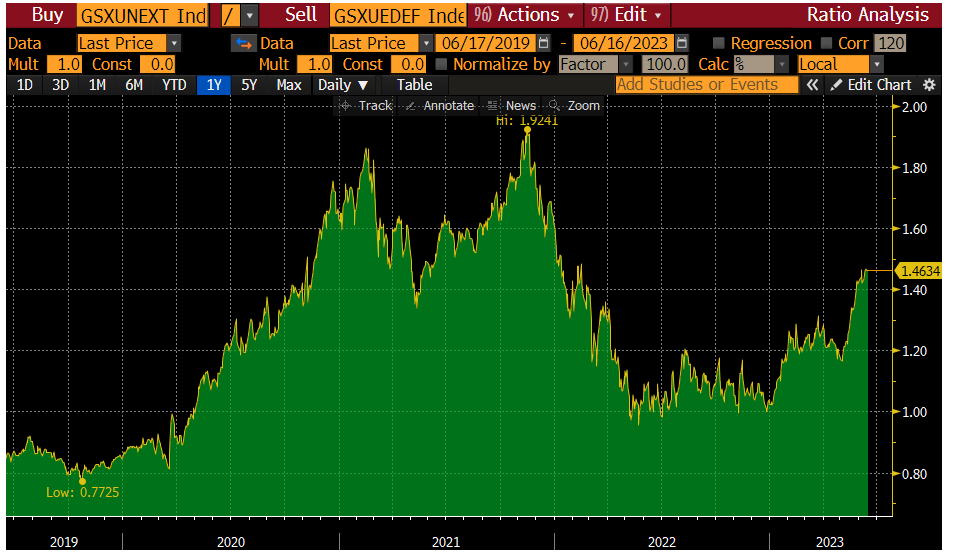
15. A catchy chart and the case for secular growth to outperform. From Lou Miller: the new technology basket (GSXUNEXT) consists of 28 secular growth names that should do well in the current environment, and excludes the mega cap incumbents on the view that breadth improves. We like this theme on the long side and pairing it with a short in “expensive defensives,” such that you’re buying this chart (link):
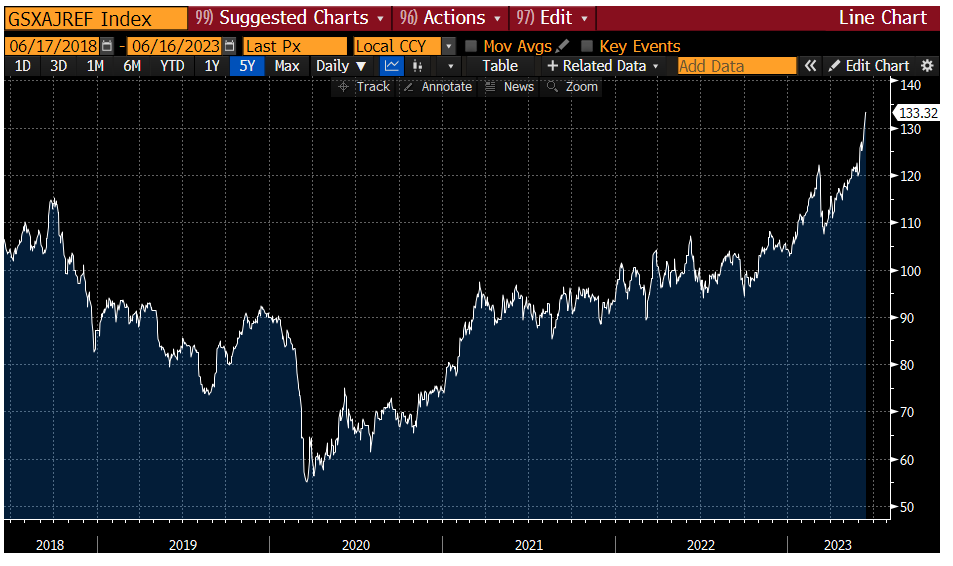
16. This is where it gets fun – these last three charts all reveal what’s going on one level below the surface in Japan, and they all go back five years, starting with the GS Japan reflation basket:
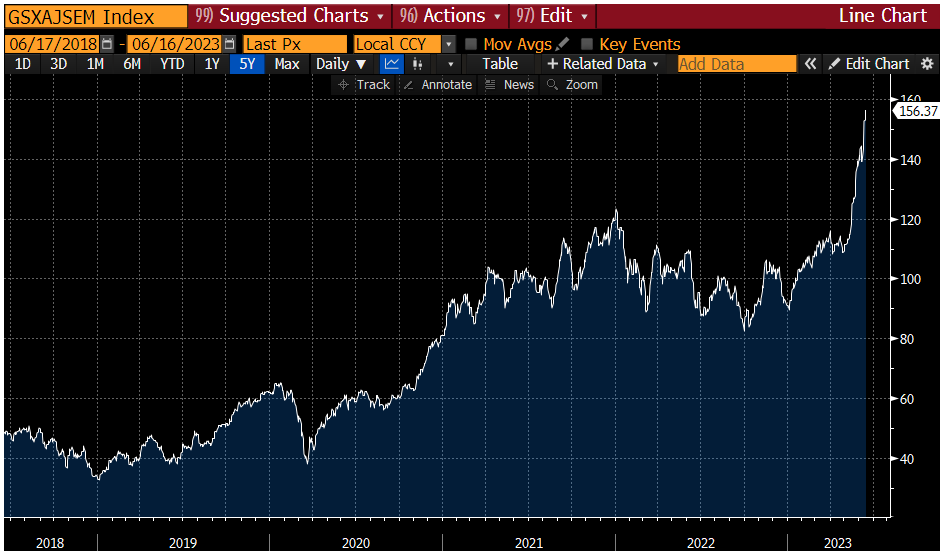
17. You’ve seen this one before: Japanese semiconductors:
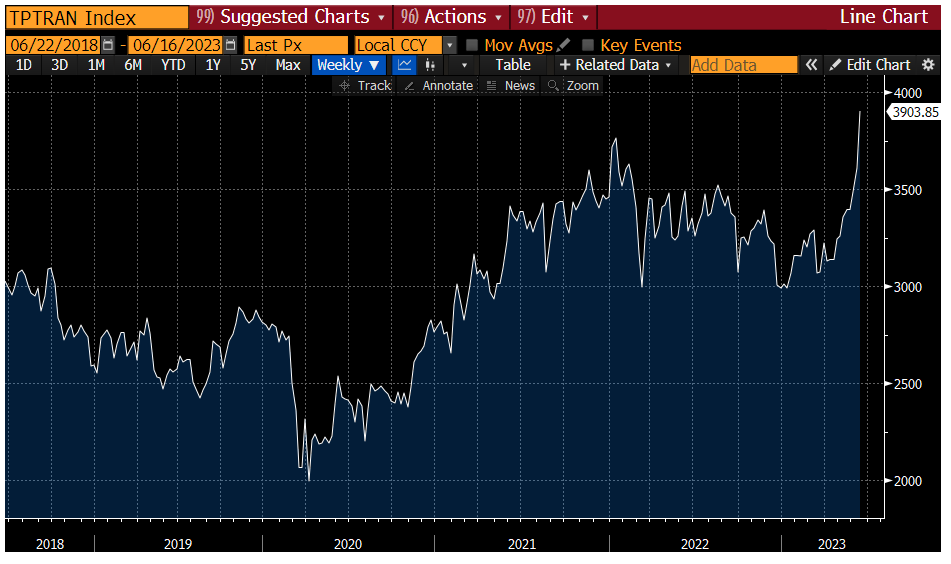
18. Finally, the showstopper of the past month … Japanese transports:
More details in the full note available to professional subscribers.