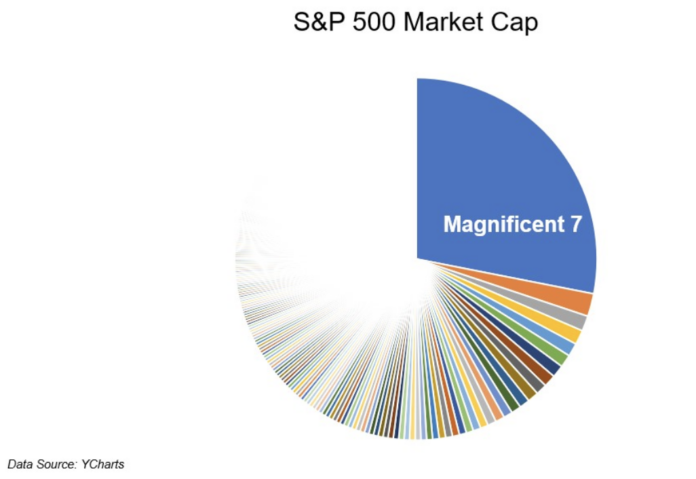
The Not-So-Magnificent 493
Five years ago, I wrote a blog post that would change the world of finance forever. I shared a chart that tried to visualize just how dominant the large stocks had gotten in the cap-weighted S&P 500.

In July 2018, with every FAAMG stock hitting an all-time high, these five companies had a market capitalization that was equal to the bottom 282 names in the index. A lot has changed between then and now, but one thing that hasn’t, or actually has, is how big the giants are relative to the rest of the market. These five names are now as big as the bottom 386 names in the index.
FAAMG picked up two more names along the way, Nvidia and Tesla, thereby making them the magnificent seven. These are seven of the eight biggest names in the S&P 500, with the exception of Berkshire Hathaway, which sits between Tesla and Meta. At a combined $11 trillion, they are as large as the 397 bottom names in the index.
The magnificent seven are now 28% of the market capitalization of the S&P 500.
Gigantic stocks are the outliers, yet they dominate the cap-weighted index. There are four times as many companies with a market cap between $10-$20 billion as there are companies with a market cap over $200 billion.
But the 31 stocks with a market cap over $200 billion are just about equal to the other 469 companies in the index.
Julian Klymochko tweeted that Apple’s market cap is equal to all Nasdaq-listed stocks in 2003. I don’t know if that’s adjusted for inflation, but it doesn’t matter. These tech stocks have broken all the rules we thought were possible. Companies this big shouldn’t have been able to grow this fast with such enormous pricing power and operating leverage.
Over the last decade, their revenue has compounded at 16% a year, while their free cash flow has grown at 13% a year.
The $11 trillion question is, are these stocks overrepresented in the index? Said differently, are they overvalued? Are they priced for lower returns going forward? This chart shows revenue and net income compared with market cap as a percent of the overall index.
They all have an outsized piece of the market cap compared with their revenue and net income. Clearly, there are other factors at play, like growth, margins, dominance, etc that have supported this being the case.
On both forward and trailing P/E’s, the top seven stocks appear to be trading at the upper end of their historical range. They have earned this premium multiple, but whether they can support it going forward is anyone’s guess.
If you got the big tech thesis right, you got the market right. And not just this year, but for the last decade. And if you thought these stocks were expensive in 2015, then it’s been a long and painful ride. Nobody knows what happens next, but the mega-cap stocks will be in the driver’s seat one way or another.
Josh and I were fortunate to talk about this and so much more with the legendary Jeremy Grantham on this week’s The Compound and Friends.


