
It’s the end of the quarter.
It’s still a disaster but not as bad as it was going to be after a 3-day rally. We were BUYBUYBUYing yesterday in our live Member Chat Room, picking up over a dozen new trades for our Long-Term Portfolio as the S&P Futures popped back over the 4,320 (Strong Bounce) line we’ve been watching for the last couple of weeks.
We began preparing our picks on “Watch List Wednesday – Bargain Hunting During the Sell Off” and that was AFTER we boosted our hedges in “Turnaround Tuesday? Bouncing or Busting for the S&P 500?“. Though it wasn’t so much of a boost as it was a cashing in of our winning positions and moving to lower-delta hedges that would stand up better in a bounce. In any case, once we had our hedges in place – we were ready to shop – THAT is the way you play these market dips.
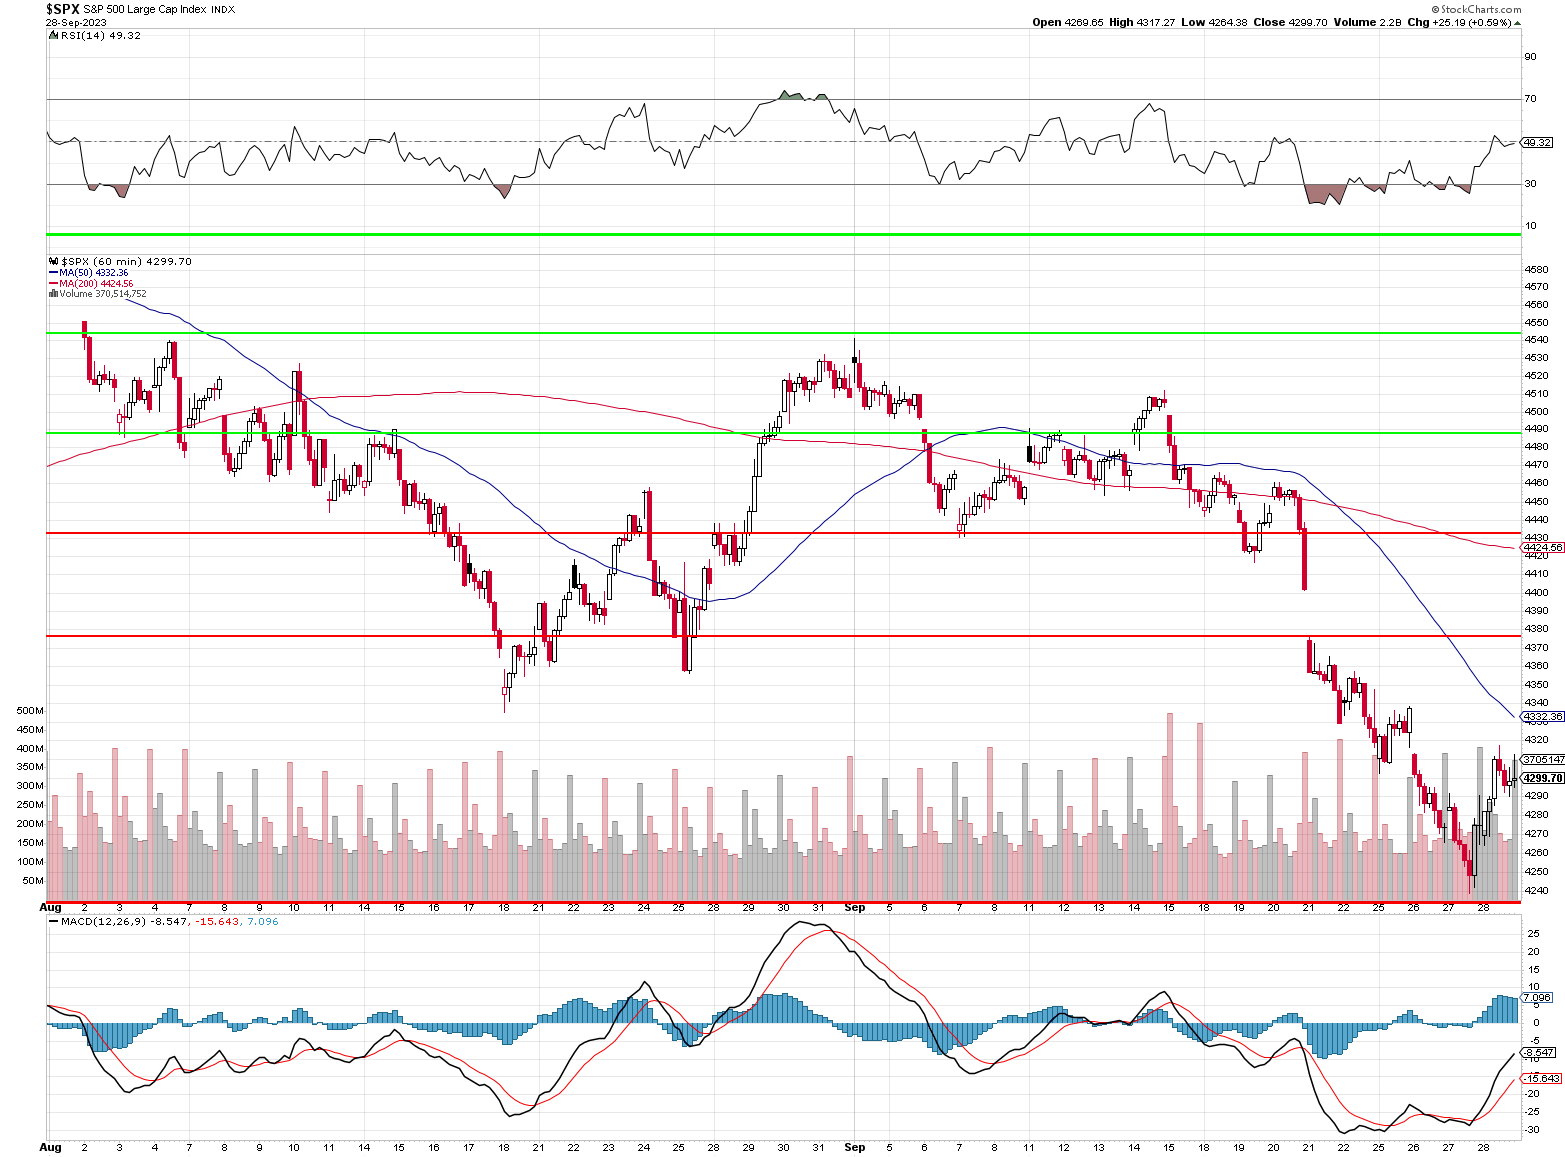
4,320 is our strong bounce line on the S&P and we haven’t been below it since June so of course it is going to be bouncy and we fell from 4,600 so the drop is 280 points and the bounces are 56-points according to our 5% Rule™ so a weak bounce for the summer rally is (4,320 + 56) = 4,376 and the strong bounce is 56 more at 4,432 – that’s what the above chart is illustrating.
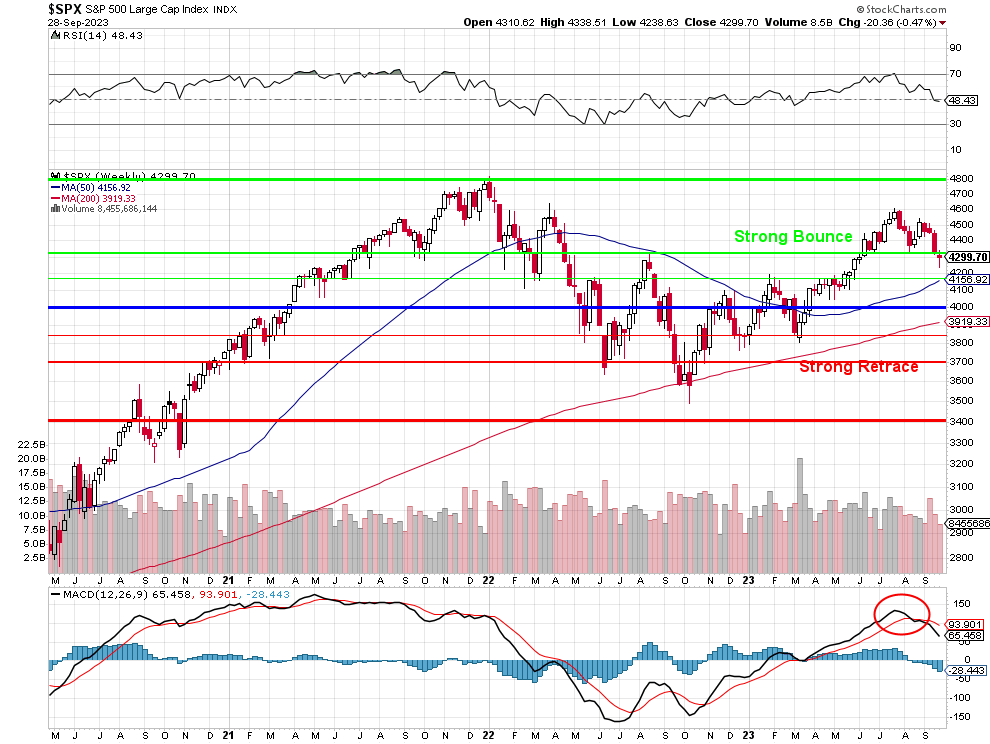
4,332 is the 50-hour moving average and that SHOULD only offer token resistance if this is a real rally that’s heading to the weak bounce line but, failing to get back over the weak bounce line TODAY means the V-shaped recovery isn’t happening and that means we need to refer back to the weekly chart, which shows we’re still in a very dangerous spot.
The short puts in the LTP alone will pay us $100,000 if we rally from here but the hedges we added will pay us $300,000 if we continue to fall so we’re kind of still hoping for a bigger correction (and more bargain-hunting from our list) but, for now, I think we are well-balanced into the weekend and the final quarter ahead.
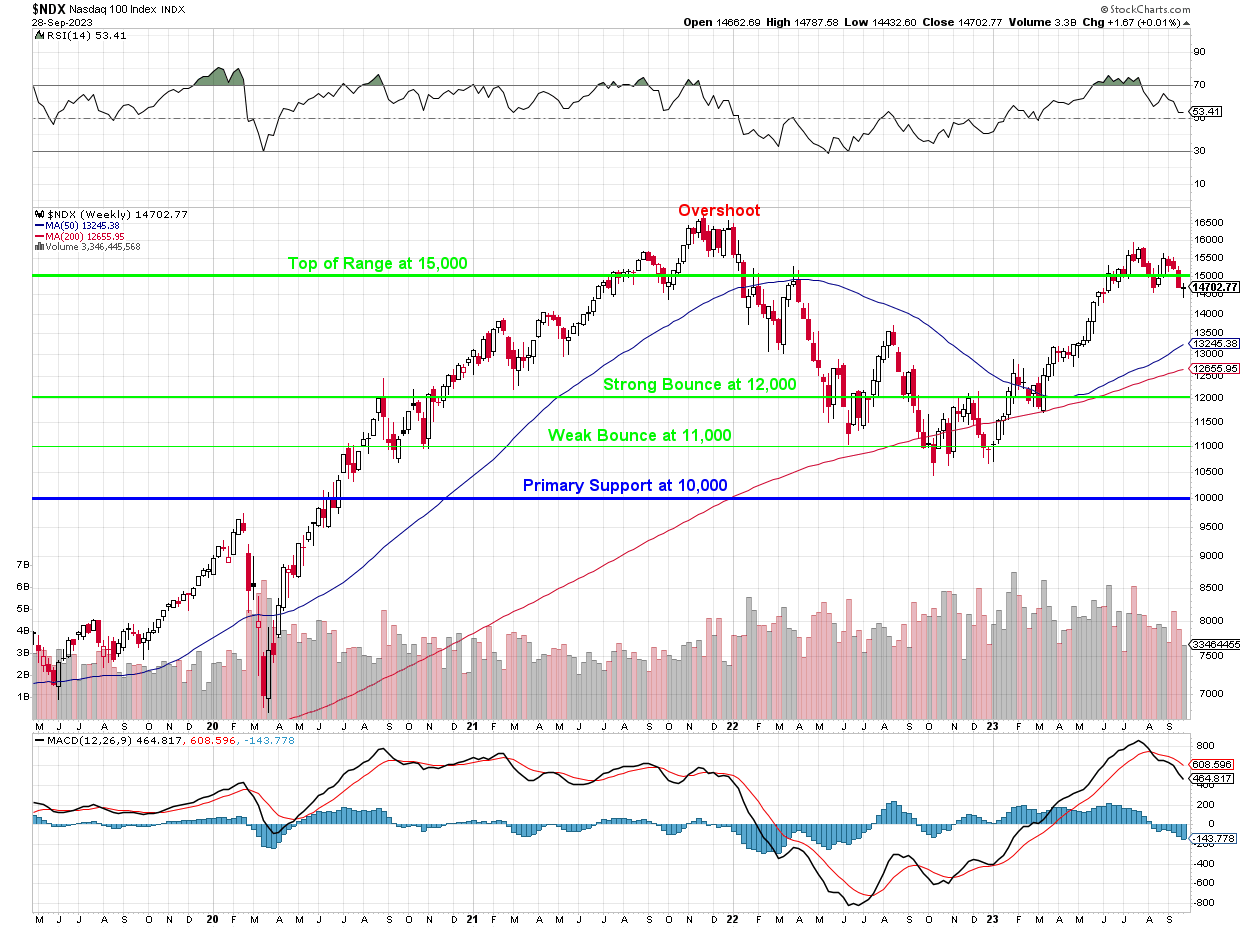
The Nasdaq is halfway back to 15,000 in this morning’s futures but that still leaves 150 points to go in order to get back to the top of its range – which we’ve also been over since the summer began. I’m always suspicious of low-volume rallies – especially when most of the lifting is being done in the pre-market hours, when it’s easy to move the needle and double-especially when it comes in the last days of the month, when the people who sell you the market are eager to pretty up their brochures for next quarter.
I also very much do not trust rallies that come at the expense of the Dollar, which is down 1% in the last two days and a 1% Dollar drop should automatically cause a 2% pop in the indexes and, so far, that is exactly what we have.
The Government is still shutting down this evening, the UAW is EXPANDING their strikes – not ending them, China’s Real Estate market continues to collapse – and it’s 1/3 of their Economy, Oil is still at $92, up from $70 in May and June (end of Q2 and start of Q3) – so starting Q4 at $92 is EXTREMELY INFLATIONARY!
As we predicted, Personal Spending has slowed down from 0.9% in July to 0.4% in August – despite Personal Income rising from 0.2% to 0.4% and PCE prices are up 0.4% so inflation is still booming, labor markets are still tight and Consumers are no longer able to spend more than they make – how is that rally fuel?
The Chicago Purchasing Manager’s Index measures the Economic Health of the manufacturing and non-manufacturing sectors in the Chicago region and under 50 is a strong Recessionary signal and last month it was a worrying 48.7 and today we’re down to 44.1 – dropping 10% in a month is – NOT GOOD!
Consumer Sentiment has been at Recession levels for more than a year and we’ll see how that looks at 10 but NOT GOOD would be my bet as well.
Have a nice weekend – next week is going to be interesting,
-
- Phil


