
Just like that we’re back!
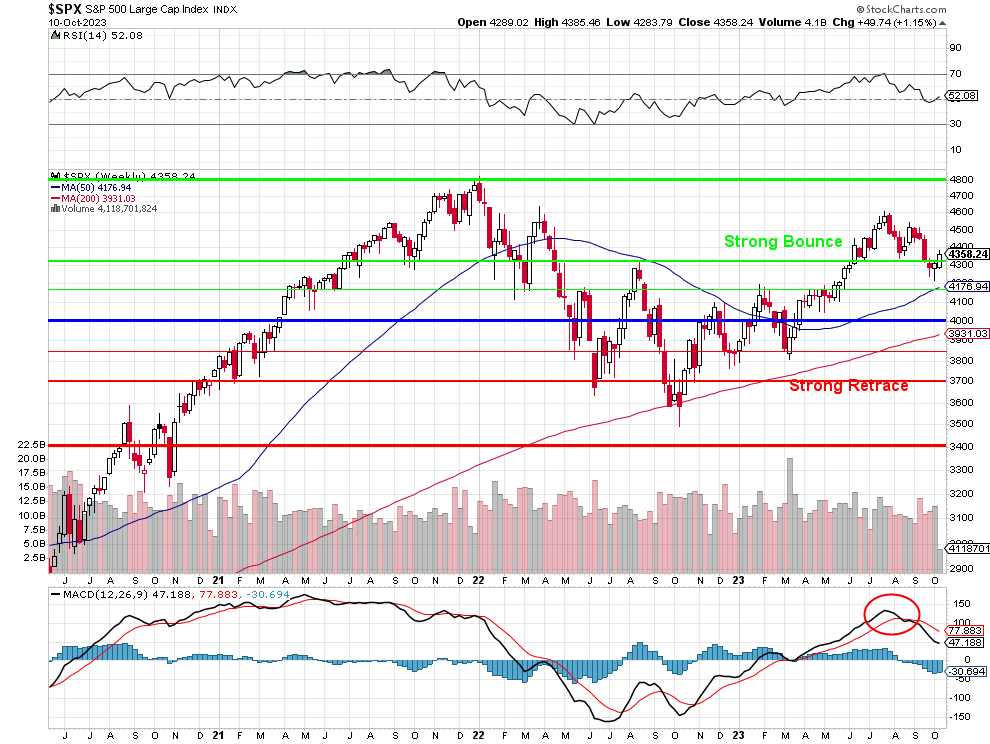
From 4,600 on Aug 1st to 4,250 on Oct 4th we had a 350-point correction. We went past it a little but the rising 50-Week (200 dma) Moving Average was very bouncy and it has now crossed over the longer-term Strong Bounce Line at 4,320 so all is well(ish) again for the bulls – for the moment.
The Russell is still below 1,800 and it would be nice to see some stability in the small caps as that is down 25% from the 2,400 highs of last year and the S&P topped out at 4,800 and 75% of 4,800 is 3,600 – below the Strong Retrace line on the S&P chart above and back to last year’s lows.
Is inflation going away, is the Fed done tightening, are earnings turning positive or are we just paying a fortune for companies who are INVESTING (not profiting) in AI way, way before there’s any justification for it (or any sign of returns)? How many companies are actually making money from these AI initiatives that have sent their multiples back to record highs?
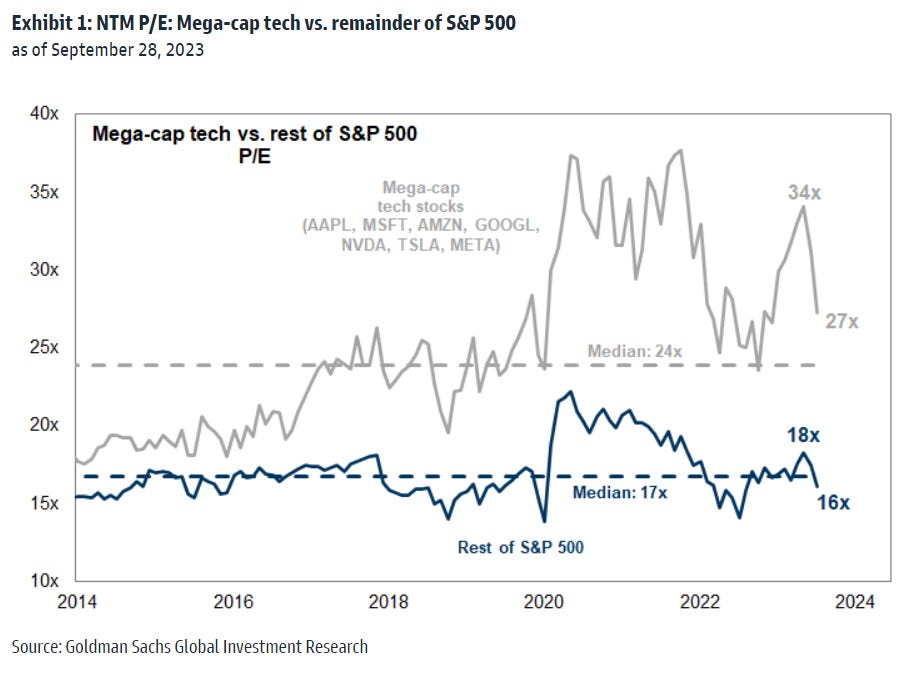
The market in 2023 is primarily driven by seven tech giants: Apple (AAPL), Microsoft (MSFT), Amazon (AMZN), Alphabet (GOOGL and GOOG), Nvidia (NVDA), Tesla (TSLA), and Meta Platforms (META). These companies account for 27% of the S&P 500’s market cap and have seen a 55% YTD increase. The rest of the S&P 500 has only returned 4%. The forward P/E ratios of these companies are at a 69% premium compared to the rest of the market.
Despite increasing yields, bond inflows have been strong, estimated at more than $455Bn in 2023 (so far). This suggests that credit markets may be priced for the end of a cycle rather than the middle, making them vulnerable from a valuation standpoint. The Prime Rate has jumped to 8.50%, 25% above its long-term average of 6.81%. This is a key indicator of tightening financial conditions and has implications for borrowers and lenders.
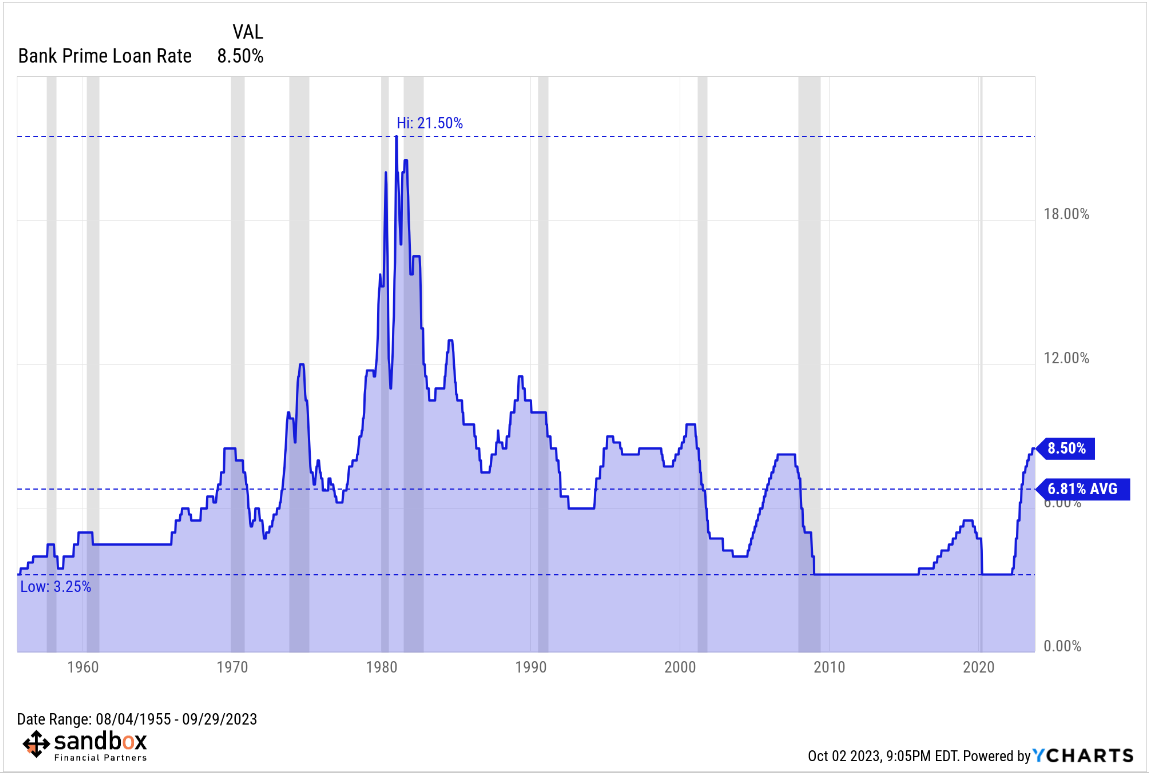
The Prime Rate can affect many areas of our lives, including credit card interest rates, small business loans, mortgages and personal loans. It serves as a baseline that most banks use to determine what interest rate to give customers who want to either open a new credit card or take out a home loan. To determine the rate, commercial banks take the Federal Funds Rate (5.5%), the interest rate set by the Federal Reserve that banks use to borrow from one another, and add about 3% as a guideline. Following updates of this rate helps us make important decisions such as what type of loan or mortgage to choose, or even what APR we should be looking for when opening a new credit card.
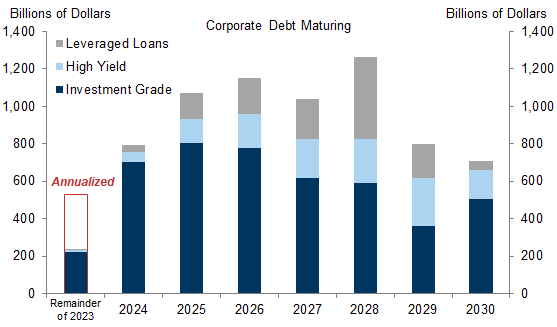
It also, unfortunately, determines the rate that those companies we invest in will pay back the money they borrowed and OH BOY, have the borrowed a lot of money! In March of last year (Q1), the Prime Rate was 3.5%, in June (Q2) it was 4.75% and In September (Q3) it was 6.25% and now it’s 8.5%, which is 36% higher than it was last September. “Only” $550Bn (10%) worth of Corporate Debt Rolled over this year but next year it will be $800Bn and, in 2025, over $1Tn in Corporate Debt rolls over – that’s going to make debt service a much bigger cost for US companies.
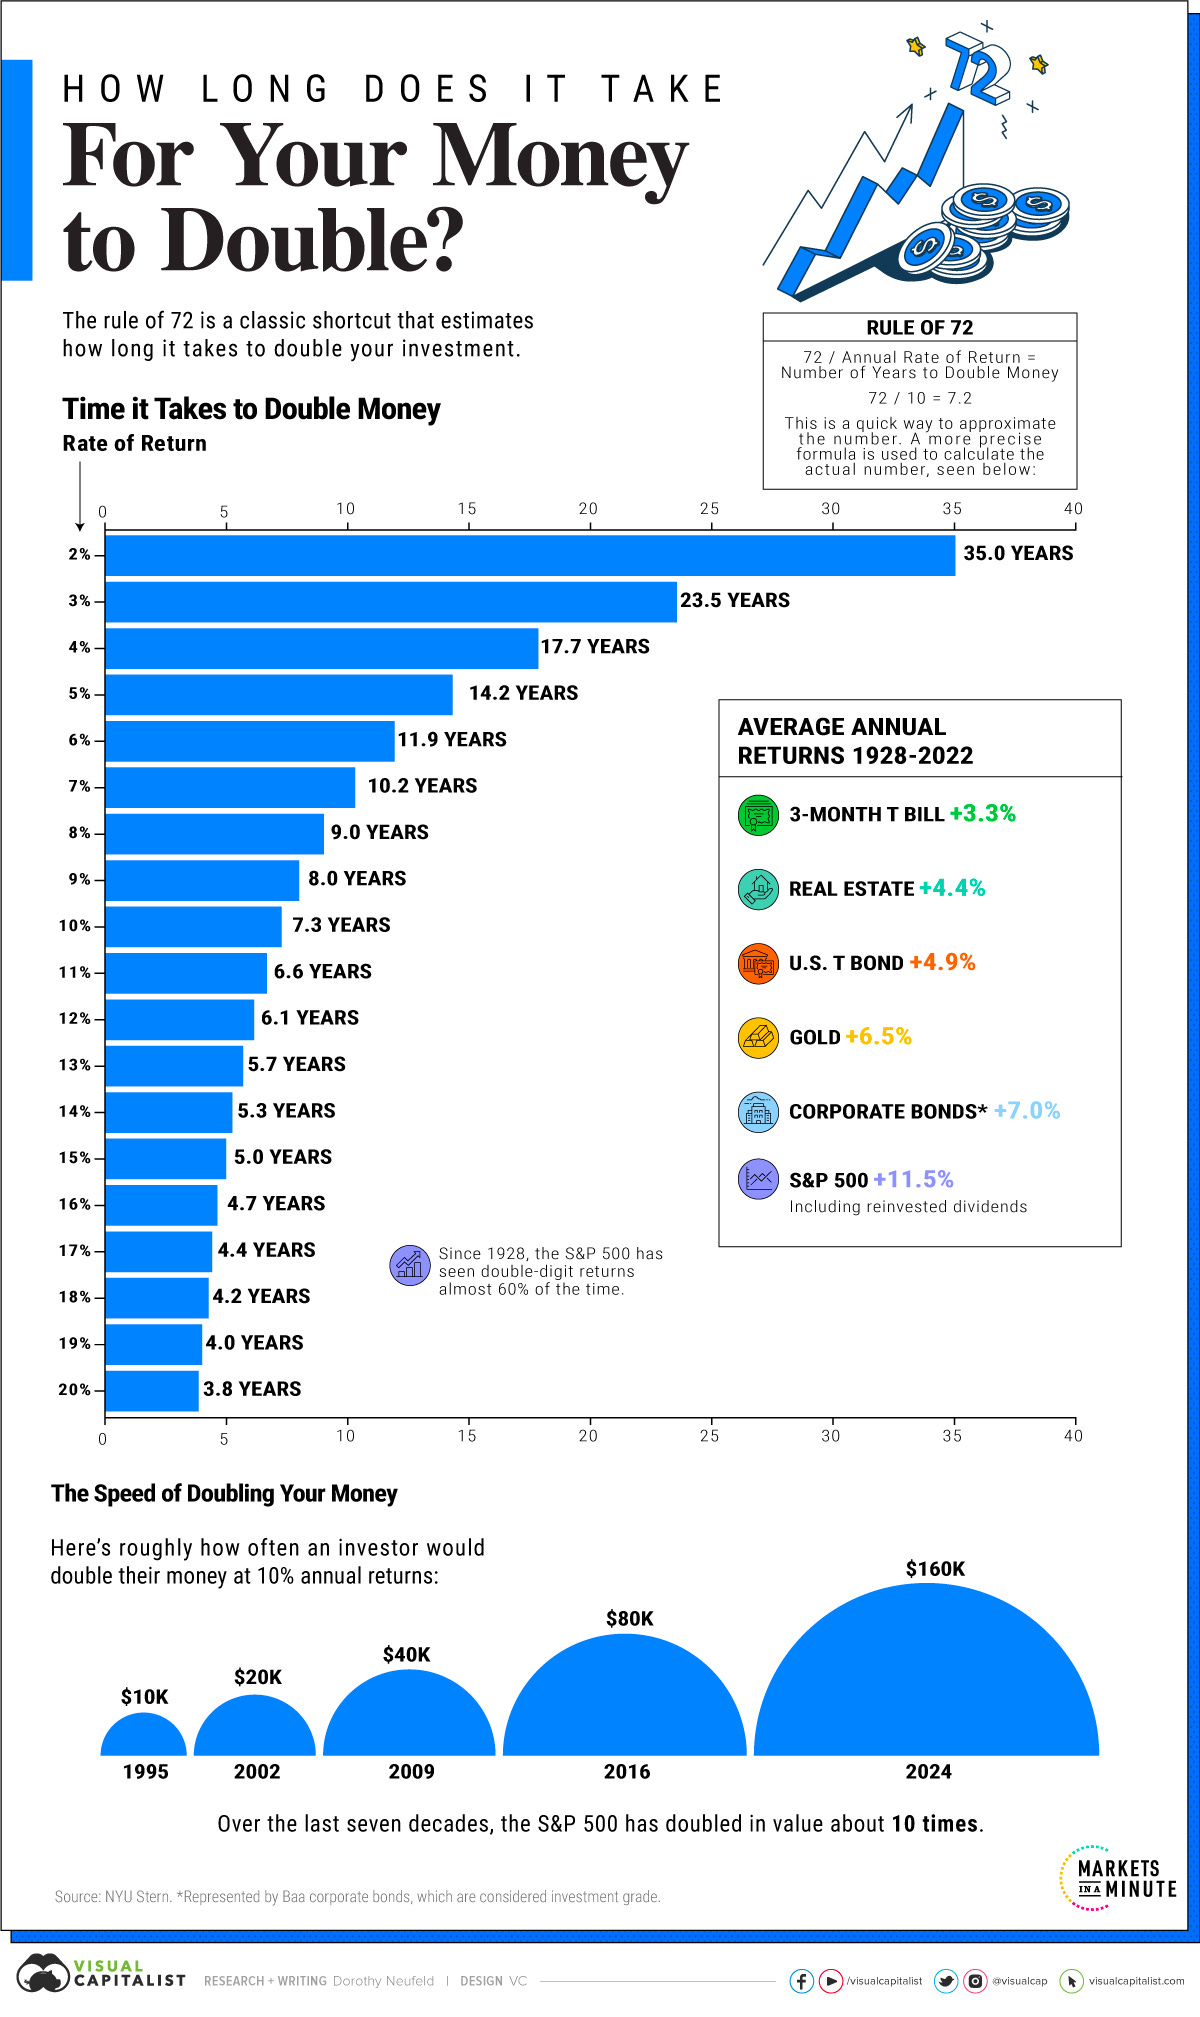
Over time, money tends to get allocated along the “Rule of 72” which is a simple yet powerful formula used to estimate the number of years required to double the value of an investment at a fixed annual rate of return. The rule states that you can divide 72 by the annual rate of return to get an approximate number of years it will take for your investment to double.
For example, if you have an investment that yields an annual return of 6%, it would take approximately 72/6 or 1 years for that investment to double in value. As Corporate Bonds move up to 8.5% for 5 and 10-year notes, they become very attractive compared to the risk of investing in the same companies’ stocks and HOPING the 11.5% streak continues.
God help these valuations if money starts flowing to Bonds or even (gasp!) Real Estate while the Corporations are desperate to roll over Trillions of Dollars worth of their own debt and all of them are competing with TBills, which our Government is borrowing at the rate of $2Tn each year IN ADDITION TO roughly $5Tn that also rolls over each year (on what is now $33Tn worth of National Debt).
8:30 Update: PPI came in feeling hot, Hot, HOT at 0.5% vs 0.4% expected by Leading Economorons and Core PPI, which the Fed cares about, is 0.3%, up 50% from 0.2% last month so inflation is very much still going the wrong way to count on the Fed pausing at their November 1st meeting. That puts a lot more pressure on today’s Fed Minutes (2pm), which we will discuss during today’s Live Trading Webinar (1-3pm, Members only).
Fortunately we have 4 Fed speakers today to spin the data: Michelle Bowman did not make “les mots qui vont tres bien ensemble” when she said “higher rates may still be needed to curb inflation” but the market came back with “La, la, la – I can’t hear you” until the just-released PPI Report and now we know what she was talking about and the Futures have turned back down a bit.
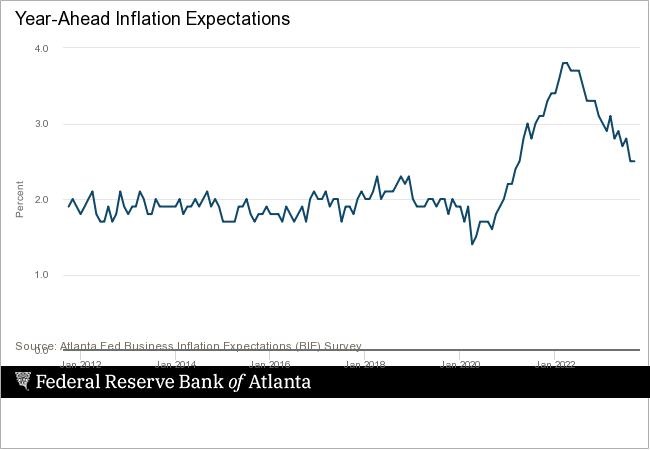 Next we have the Atlanta Fed Business Inflation Expectations Index at 10, followed immediately by Christopher Waller, who has been a little bit hawkish on Inflation and then the Altanta Fed’s top dove, Raphael Bostick will try to calm things down at 12:15 and Susan Collins will give her spin at 4:30 and she’s also a dove – so my theory is the Fed Minutes sound hawkish and they are trying to put out the fire.
Since Oil prices went from $85 to $95 during September – it’s hard to believe the businesses polled by the Atlanta Fed didn’t raise their expectations for inflation but we’ll find out soon enough. Oil is back down to $85 this morning – despite the war and despite last night’s API Report showing a 4.2Mb draw in Oil – but that was canceled out by a 3.9Mb BUILD in Gasoline, which indicated the draw had very little to do with demand.
As we discussed in last week’s Webinar, the US is shipping record amounts of Petroleum OUT of the country this year – almost 4Mb per day! We are also exporting 20Bcf of Natural Gas each day – another record that has sent our local /NG prices soaring as well.
America’s ability to produce natural gas cheaply thanks to fracking and then export it thanks to massive investments in liquefaction technology enabled European economies to ride out the restriction of gas supplies following the Russian invasion of Ukraine in 2022.
We will have plenty more to chat about in the Live Trading Webinar at 1pm – speak to you then!


