
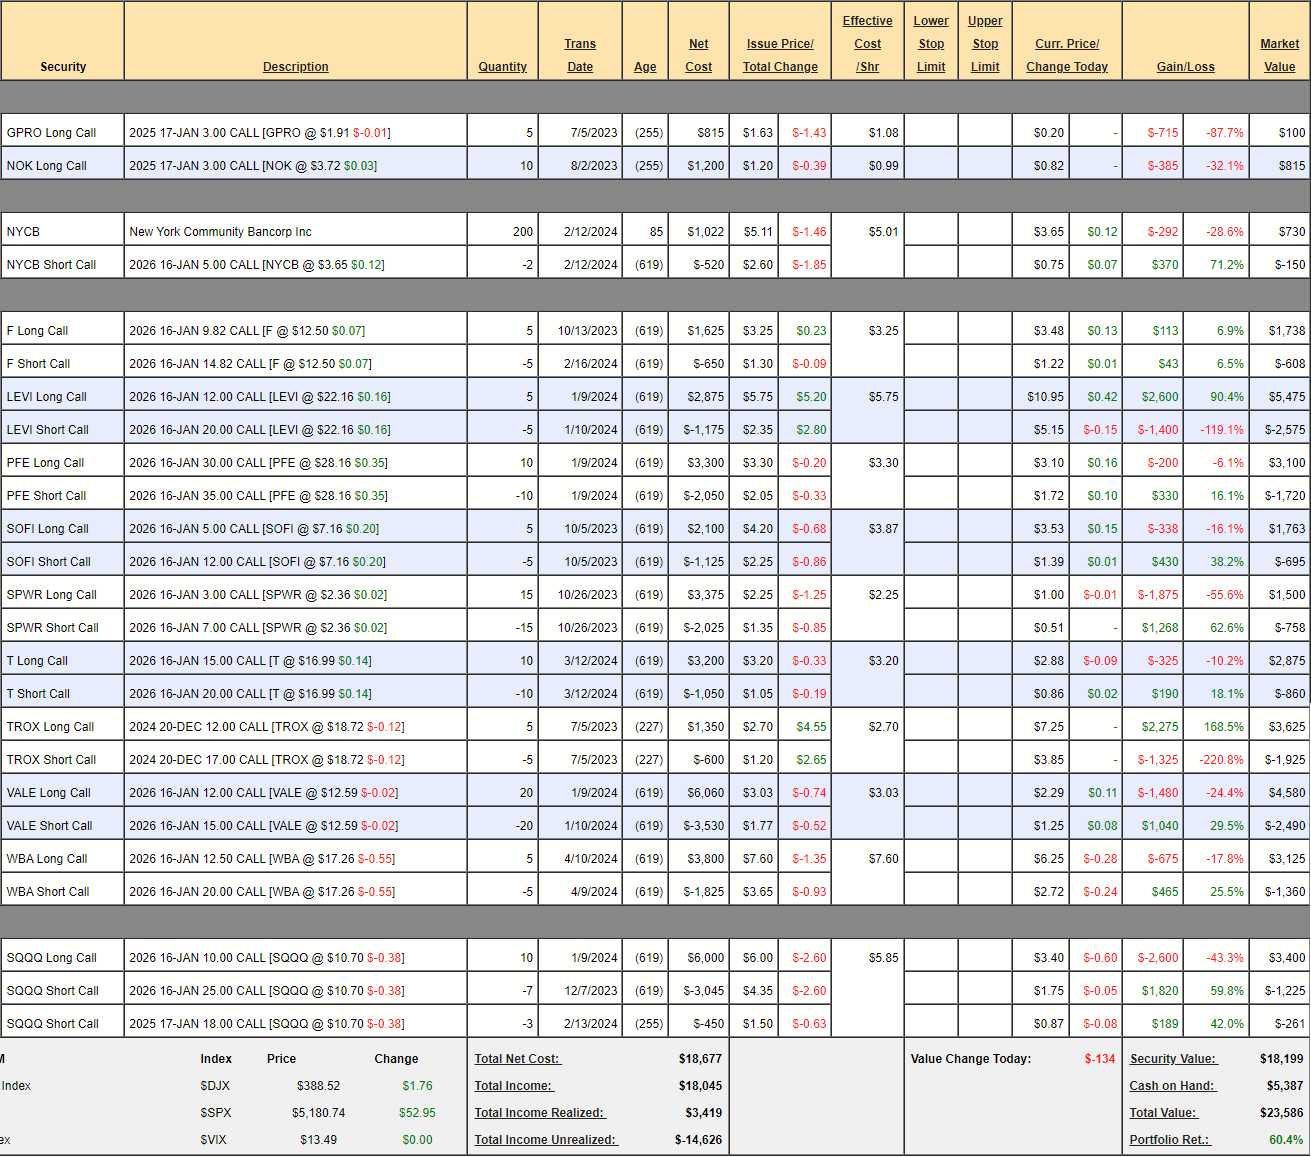
 $23,586!
Including this month’s $700 deposit, we have a starting basis of $14,700 since Aug 25th, 2022 and a profit of $8,886 (60.4%) – up another $1,250 (5.7%) since our April 9th Review, where we made some aggressive moves and earnings have been kind to our positions, so far.
We’re miles ahead of our 10% annual goal and, at this pace, we’ll get to our $1M goal (up $976,414 from here) in 13 years – so you haven’t missed much so far. The way this portfolio works is we add $700 each month and make no margin plays – as you would have to in an IRA/401K so, if you have the time and inclination to turn $23,586 + $700/month into $1,000,000 – now is as good a time as any to start!
You can go over months 1, 2, 3, 4, 5, 6, 7, 8, 9, 10, 11, 12, 13, 14, 15, 16, 17, 18, 19 and 20 to see all the moves we’ve made to get this far. This is a small portfolio, which means we can’t use all of our favorite option techniques yet – but it’s a great way to learn how to get started on a wealth-building adventure.
As of our review on April 9th, we had $17,301 (73.3%) of upside potential in our existing trades – that’s more than we’ve made in our first two years and we’ll be adding to that, of course. After cashing out BCS and FF last month, we are swimming in $5,387 in CASH!!! so it’s a good month to look for new opportunities as well:

- GPRO – Earnings are today and they’ve struggled back to $2 but we were looking for $4.63+ so it would take a miracle but it’s only $100 and we’re letting it ride.
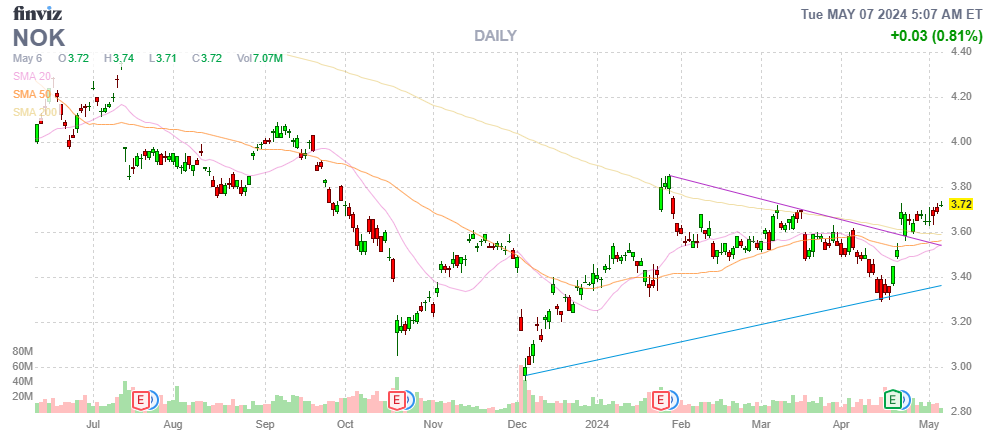
- NOK – Also struggling but a nice pop off earnings so we remain hopeful.
-
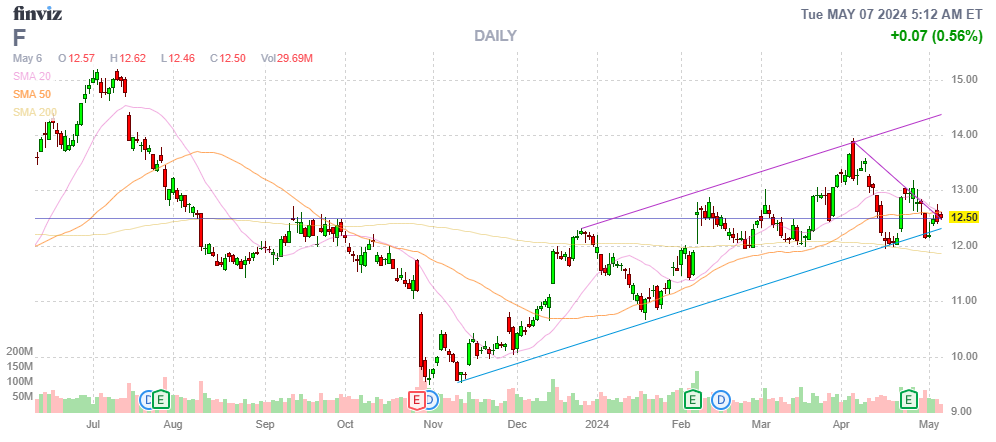
- F – These are kind of strange due to a special dividend For paid out and we’re on track to the full $2,500 at net $1,130 so there’s still $1,370 (121%) left to gain. That’s a keeper! Earnings are on the 24th.
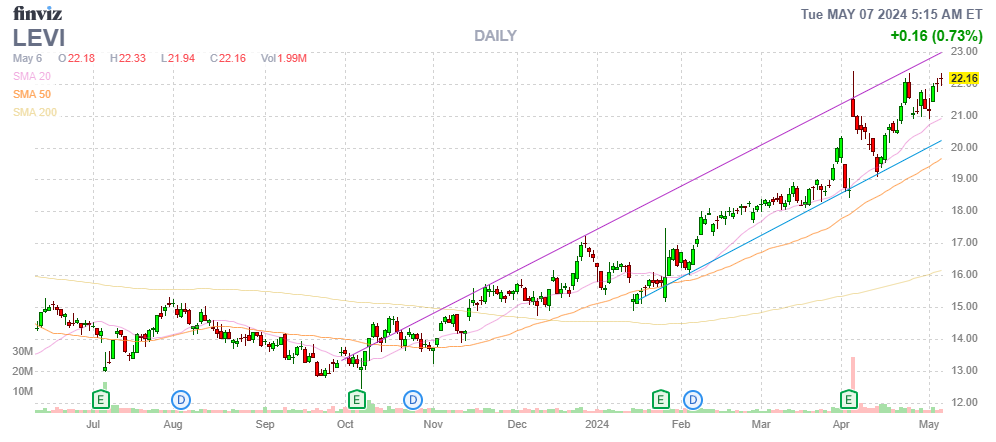
- LEVI – Net $2,900 on the $4,000 spread has $1,100 (37%) left to gain and that’s a huge jump from last month and we’re well over our goal so it’s a fairly safe-looking 37% but still now below our overall returns – so we’ll have to keep an eye on them for a possible early cash-out.
-
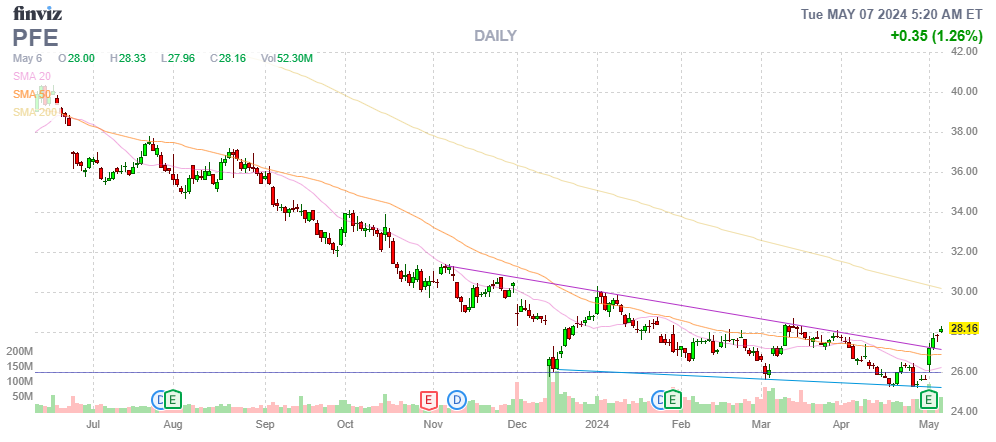
- PFE – Nice pop off earnings – finally! This is a $5,000 spread at net $1,380 so it still has $3,620 (262%) of upside potential if we can get to $35 (+25%) in two years. Still good for a new trade.
-
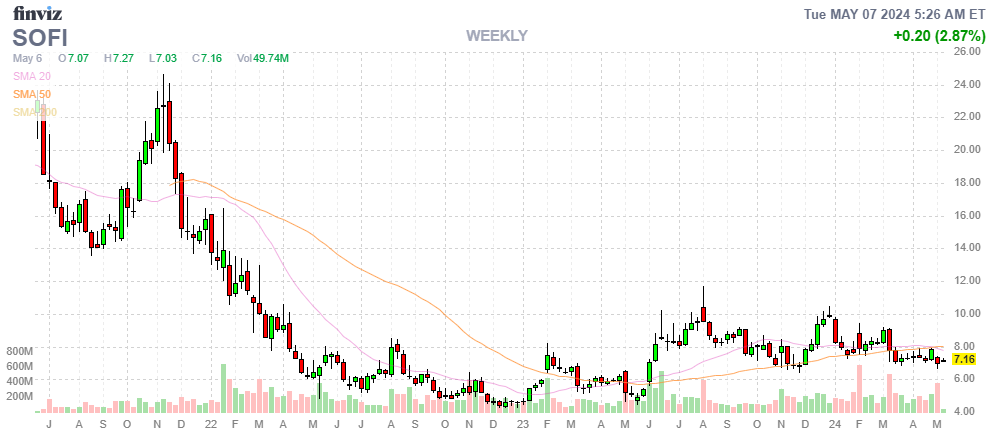
- SOFI – I don’t like the way they are settling in at $7 but we do have 20 months left to get to $12. We are at net $1,068 on the $3,500 spread and we are $1,000+ in the money with $2,432 (227%) left to gain. Earnings were the 29th and they beat top and bottom but sold off anyway – I’m tempted to double down so let’s at least say it’s good for a new trade.
-
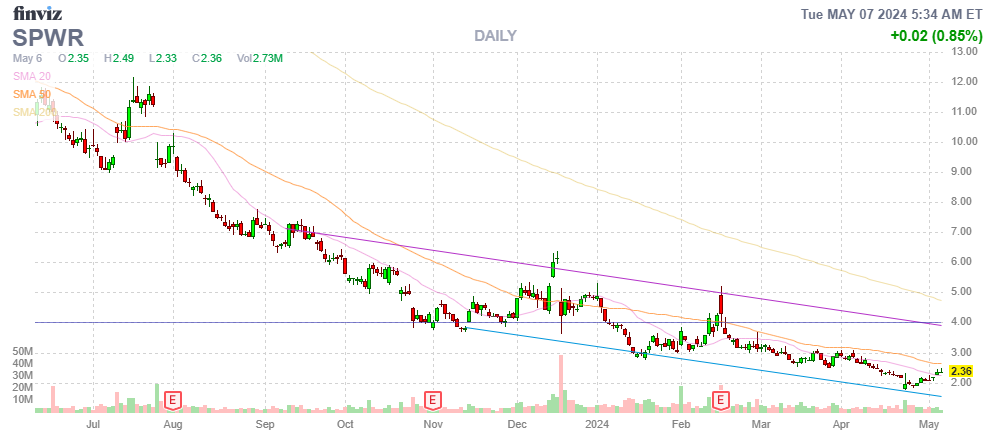
- SPWR – The real problem child of our portfolio but we’re only in at net $742 and it’s a $6,000 spread but out of the money and they just laid off 1/3 of the staff (installers) and they are pivoting to more of a sales operation. It’s hard to walk away from all the pending stimulus but perhaps SPWR management has completely missed the bus? Here’s the upside story but we’re not counting on it.
-
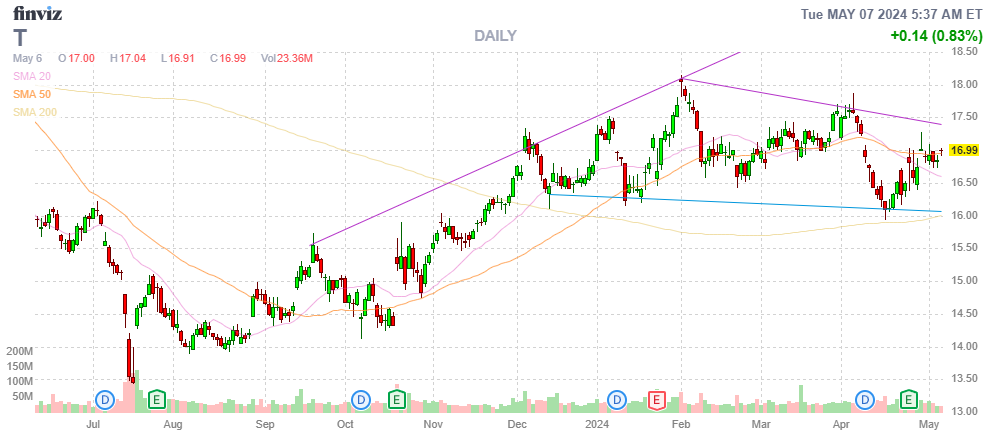
- T – On track at $17 and it’s a $5,000 spread that’s $2,000 in the money at net $2,015 so very little premium and $3,000 (150%) upside potential – I love it!
-
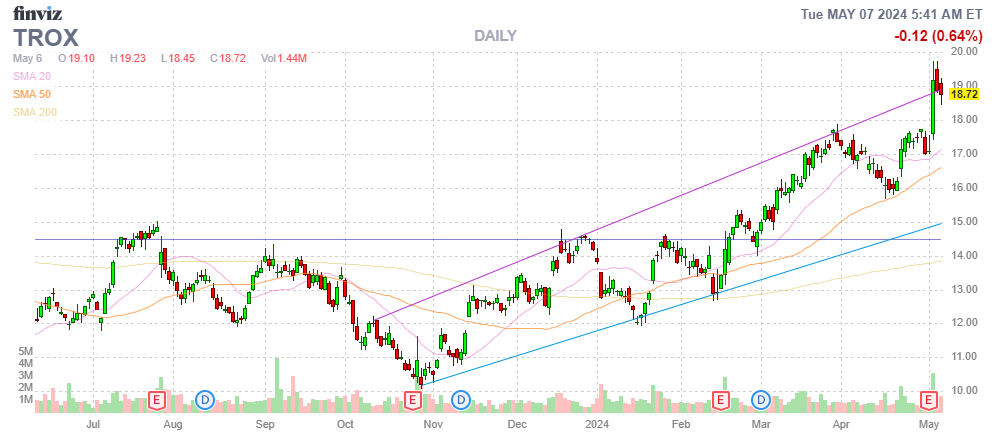
- TROX – Already over our target at net $1,700 on the $2,500 spread so a respectable $800 (47%) upside potential remains and that’s by December.
-
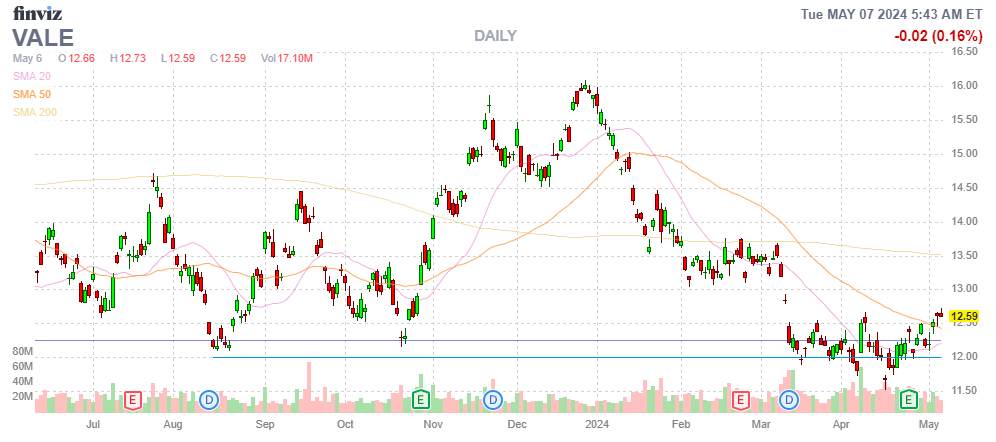
- VALE – Earnings were good and we’re on track for $6,000 at net $2,090 so there’s $3,910 (187%) of upside potential at $15. We doubled down on that dip last month and already made $10!
-
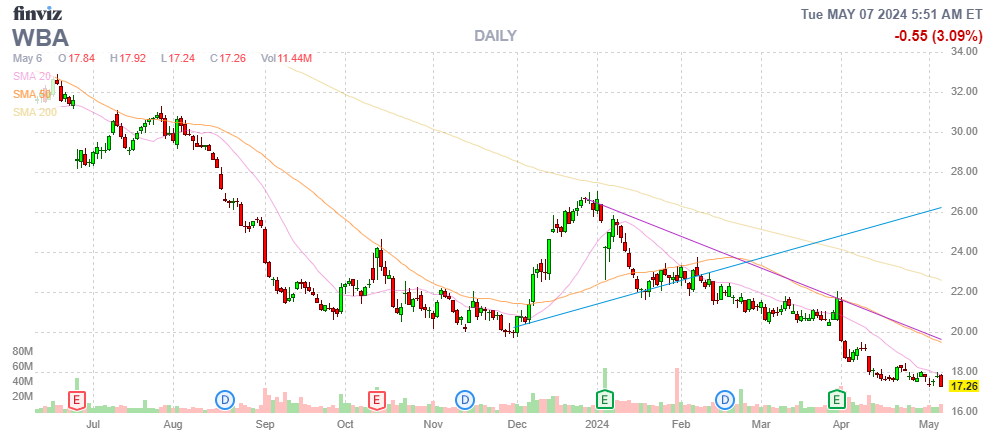
- WBA – Always disappointing but one day… It’s a $3,750 spread and it’s on track at $17.26 and net $1,765 so $1,985 (112%) left to gain but what an awful chart! Earnings are on the 28th, so we’ll see.
-
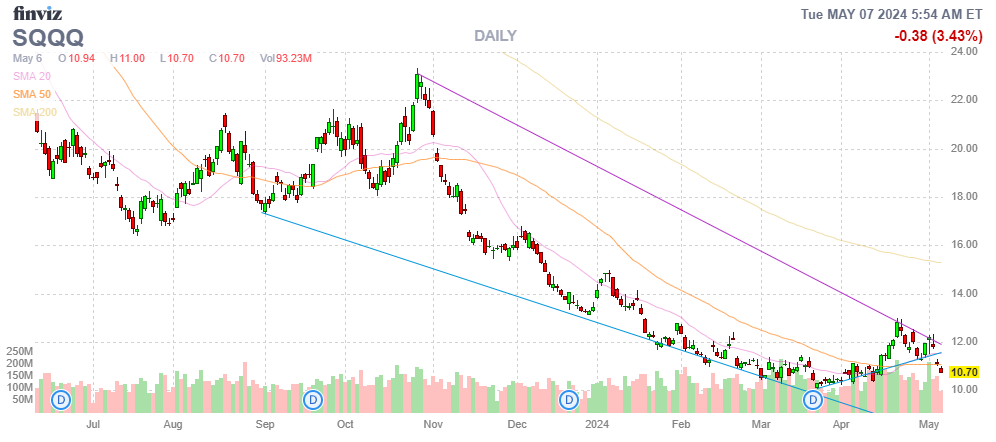
- SQQQ – With SQQQ at $10.70, a 20% drop in the Nasdaq would pop the inverse 3x ETF 60% to $17.12 and that would put us $7,000 in the money and currently we’re at net $1,914 so we have $5,086 downside protection covering our longs.
So we’ve got 12 positions and 1 hedge and there’s $18,217 (77.2%) of upside potential overall and we have some money to spend so let’s see if there are any earnings reactions we disagree with:
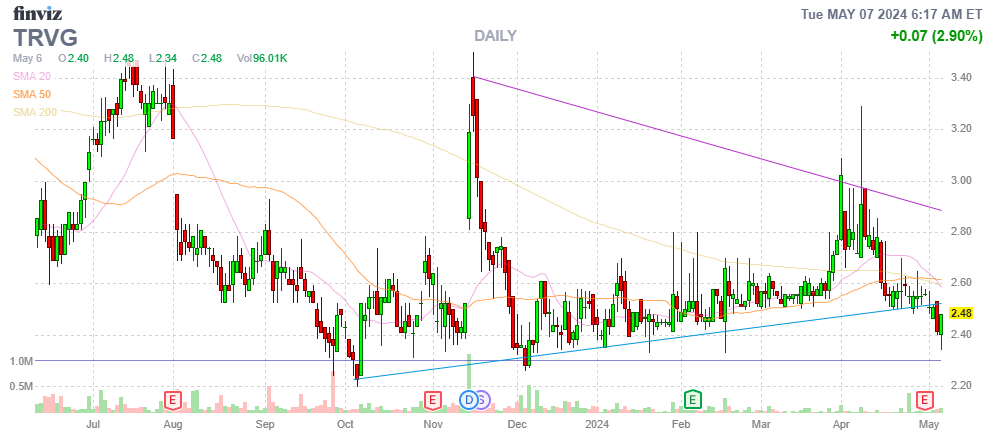
TRVG is one we’ve had our eye on and the just had good earnings and they are at the $2.50 line, which makes this play attractive so let’s do this while we can:
-
- Buy 500 shares of TRVG for $2.48 ($1,240)
- Sell 5 Oct $2.50 calls for 0.60 ($300)
- Sell 5 Oct $2.50 puts for 0.50 ($250)
That’s net $690 and, if TRVG is over $2.50 in October, we will get $1,250 back for a $560 (81%) potential gain in less than 6 months. If it goes lower, then we own 1,000 shares for net $1,940 ($1.94/share) and I think that’s a safe bottom call so low risk, high reward – this is how we play! We will be charged $1,250 in margin for this one but it’s only for 6 months.
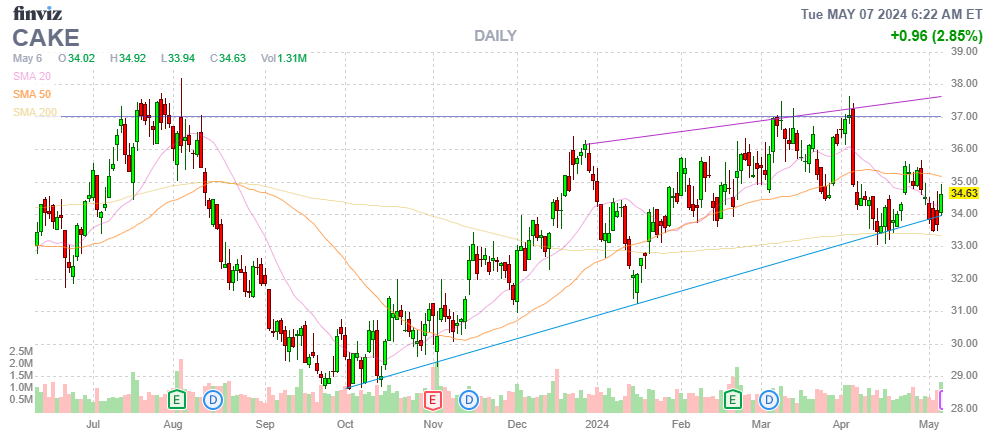
CAKE has earnings tomorrow so a little risky at $34.63 but let’s bet they get to $35 by October with the following:
-
- Buy 5 CAKE Oct $30 calls for $6 ($3,000)
- Sell 5 CAKE Oct $35 calls for $3.20 ($1,600)
That’s net $1,400 on the $2,500 spread so we have $1,100 (78.5%) upside potential and there’s good support at $33 and the net delta of the options is (0.79/0.55 =) 0.24, so hopefully another low-risk, high reward situation – we’ll find out soon!
We’ve used $3,340 of our cash and margin to add $1,660 (49.7%) additional upside potential and it’s short-term money and we still have $2,047 of remaining CASH!!! with another $700 coming next month – I think we’re in very good shape…

 of the S&P 500 Worth $21.5Tn Are Reporting!")


