
As I said back on Dec 13th:
“I don’t know why they (TSLA) get lumped in with these great stocks but they do.” The 7 Magnificent Seven stocks accounted for 90% of the S&Ps gains last year and well-deserved for MSFT, NVDA, AAPL, GOOG, META and AMZN, who are making more money than the US Government (while paying less taxes than your cleaning woman) but TSLA has not been carrying their weight and they just got devastated on earnings – so Cramer, the human weather vane says: “Kick them OUT!“
Like any bad trader, Cramer is fickle and has absolutely no patience but his reaction to a single TSLA earnings report (in which they had record revenues and earnings) is typical of the Mainstream Media’s bandwagon mentality and, I will point out to you, it’s the same media that OWNS the Dow Jones Industrial Average, which is constantly being “adjusted” to add the stocks that are more likely to boost the index.
10 years ago, in late 2013, Alcoa (AA), Bank of America (BAC) and Hewlett-Packard were dropped from the Dow and were replaced by Goldman Sachs (GS), Nike (NKE) and Visa (V). Apple (AAPL) was added in March of 2015 and AT&T (T) was dropped, GE (GE) was replaced by Walgreens (WBA) in June 2018, United Technologies (UTX) was dropped for Raytheon (RTX) in April, 2020 but RTX didn’t do well so, just 4 months later in August of 2020, it was replaced by Honeywell (HON) and Salesforce (CRM) replaced Exxon (XOM) and Amgen (AMGN) replaced Pfizer (PFE).
 So, isn’t it silly to look at a chart of the Dow’s 10-year performance when 1/3 of the stocks have been replaced? IT’S NOT THE SAME INDEX! This is like when a magician puts a girl in one box and pulls her out of another – it’s not the same girl – she just LOOKS the same. Why is it we can understand the magic show is a trick but we think the indexes are real?
These changes can significantly impact how we perceive the market’s performance. A rising DJIA might not necessarily indicate broad market health but could be the result of strategic replacements of underperforming stocks with high-performing ones. This leads to a significant discrepancy between the real performance of the market and its perceived performance. An index might show growth or stability, but this could be more a reflection of its changing composition than an actual improvement in the market or economic conditions.
As investors, it’s crucial to understand the underlying dynamics of market indices. A deeper look into the components and changes over time can provide a more accurate picture of market performance. The mainstream media’s portrayal of market movements and individual stocks often lacks nuance. A critical analysis of these narratives is necessary to avoid getting caught up in the hype.

The S&P 500 is worse than the Dow, by design it constantly drops underperformers and adds whatever mid-caps are the most hot at the time. There’s nothing wrong with the strategy by itself but if you actually BUY the stocks in the S&P and hold them – you are going to underperform the broader index as they constantly switch out to get fresh horses.
The S&P 500 undergoes about 20 to 25 changes per year, on average, due to various reasons such as mergers and acquisitions, spin-offs, de-listings, and market capitalization changes1. In fact, since 2013, the S&P 500 has replaced more than 200 companies, or about 40% of its constituents2. And, of course, the Nasdaq 100 is, by design, the 100 hottest stocks – it’s pathetic if they don’t outperform…
So keep that in mind when looking at the indexes – it’s a bit of a shell game used to keep up appearances. As we keep making money on our Long-Term Portfolio (LTP), which is now up over 100% since May 16th and up $140,780 since our Jan 18th review – we need to lock in our ill-gotten gains before the audience wises up because, CLEARLY, these kinds of profits are not sustainable!
Let’s see if we can add a bit more hedge to the Short-Term Portfolio (STP) for balance:
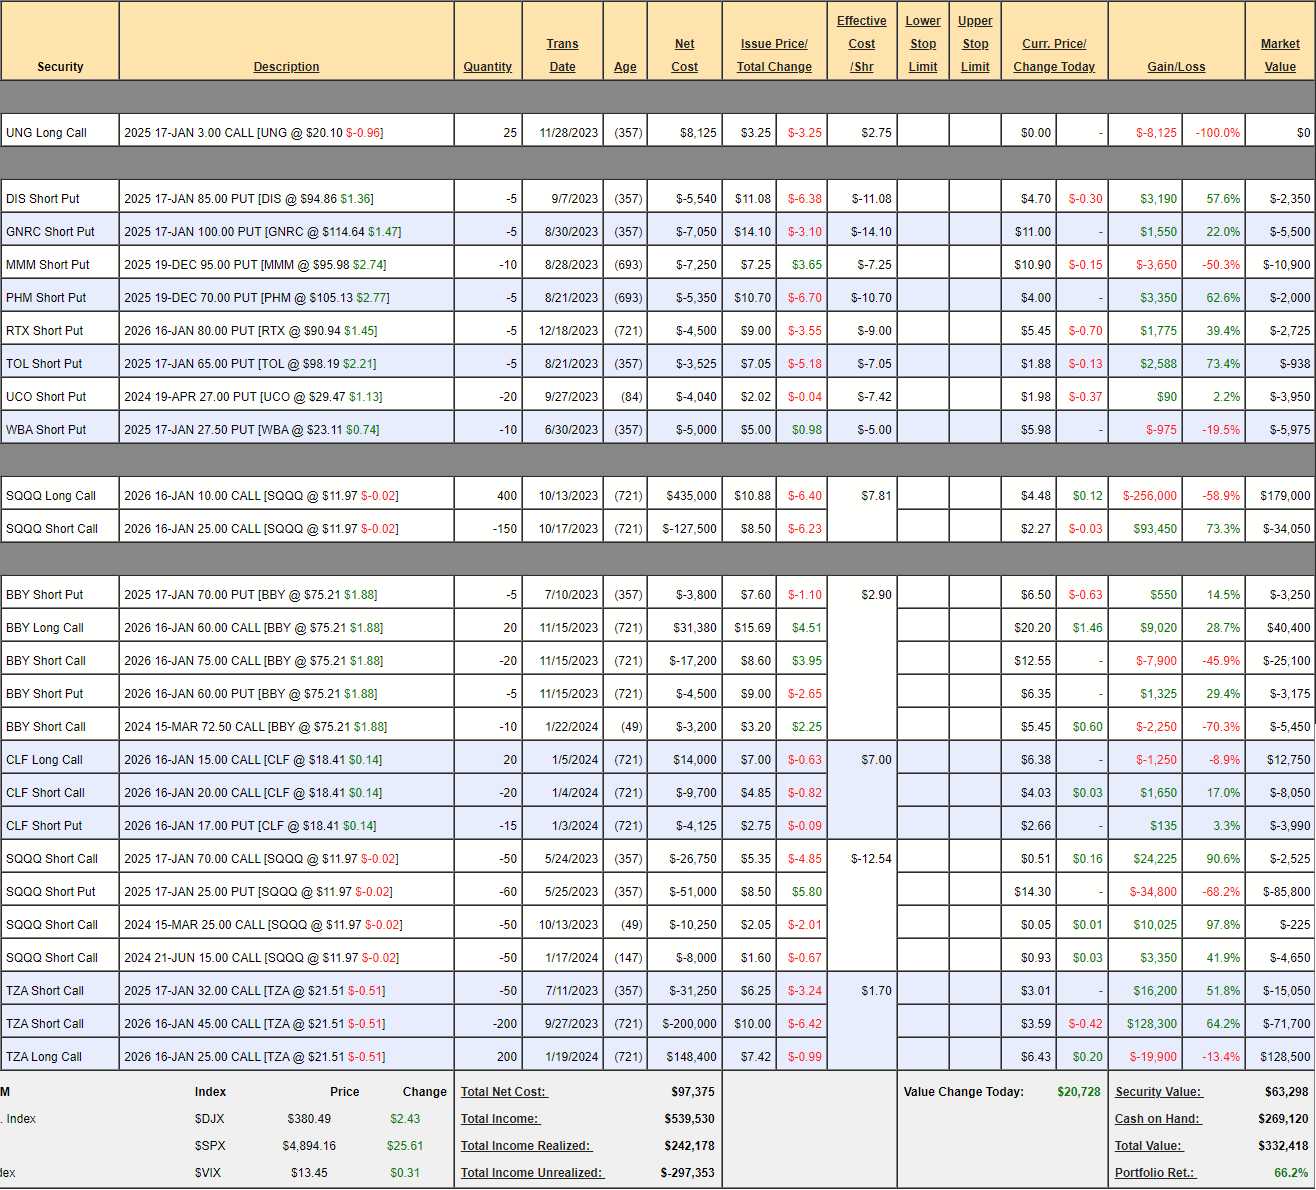
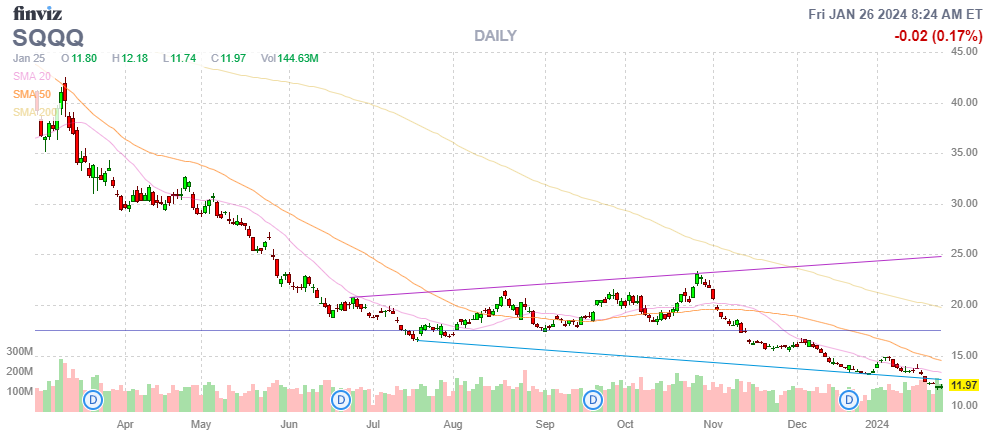
We just removed 100 of the short SQQQ 2026 $25 calls and $12 is so far out of the money (100%) that I don’t see the point in buying any more back. We have 150 short-term calls sold against them at various expirations but they’ve already lost almost all of their value.
-
- Let’s buy back the SQQQ 2025 $70 calls ($2,525) and the March $25 calls ($225) and sell 150 2025 $25 calls for $1.15 ($17,250) to put net $14,500 in our pockets.
- That leaves us with TZA and 2026 $25 calls at $6.43 can be rolled down to the $20 calls at $7.60 for net $1.17 ($23,400) and that’s certainly worth it as it puts us in the money and widens the spread by $5 ($100,000). It also puts us in great position to sell more short-term calls and generate income down the road.
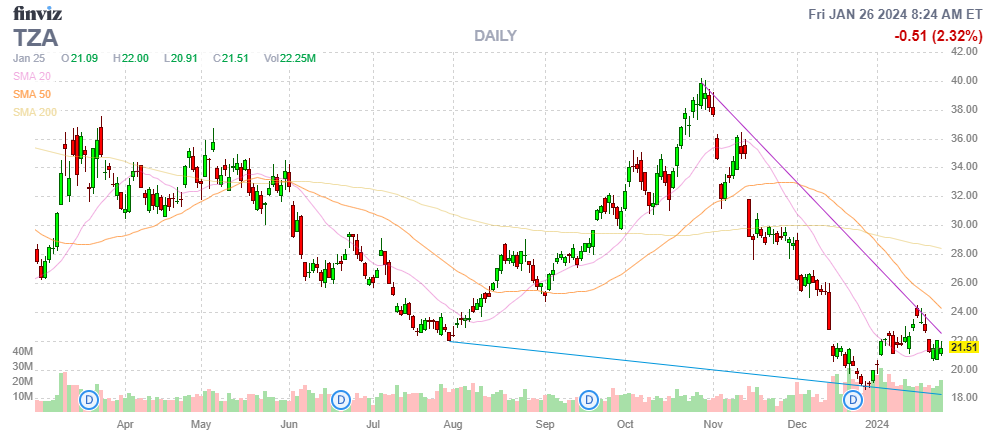
So we’ve spent just $8,900 and added $100,000 more hedge to our TZAs and that protects 2/3 of the LTPs recent gains – now I can sleep well over the weekend!
Have a good one,
-
- Phil


