
 $1,314,149!
That’s up $110,693 since our Jan 18th Review for our paired Long-Term and Short-Term Portfolios and, from our $700,000 start back on May 16th of last year, we’re up $614,149 and that’s getting close to a double with an 87.7% gain in 9 months. The S&P is up 150 points (3.1%) for the month and we’re up 9.2% so I’d say we are certainly bullish enough – the question is are our hedges still providing adequate protection?
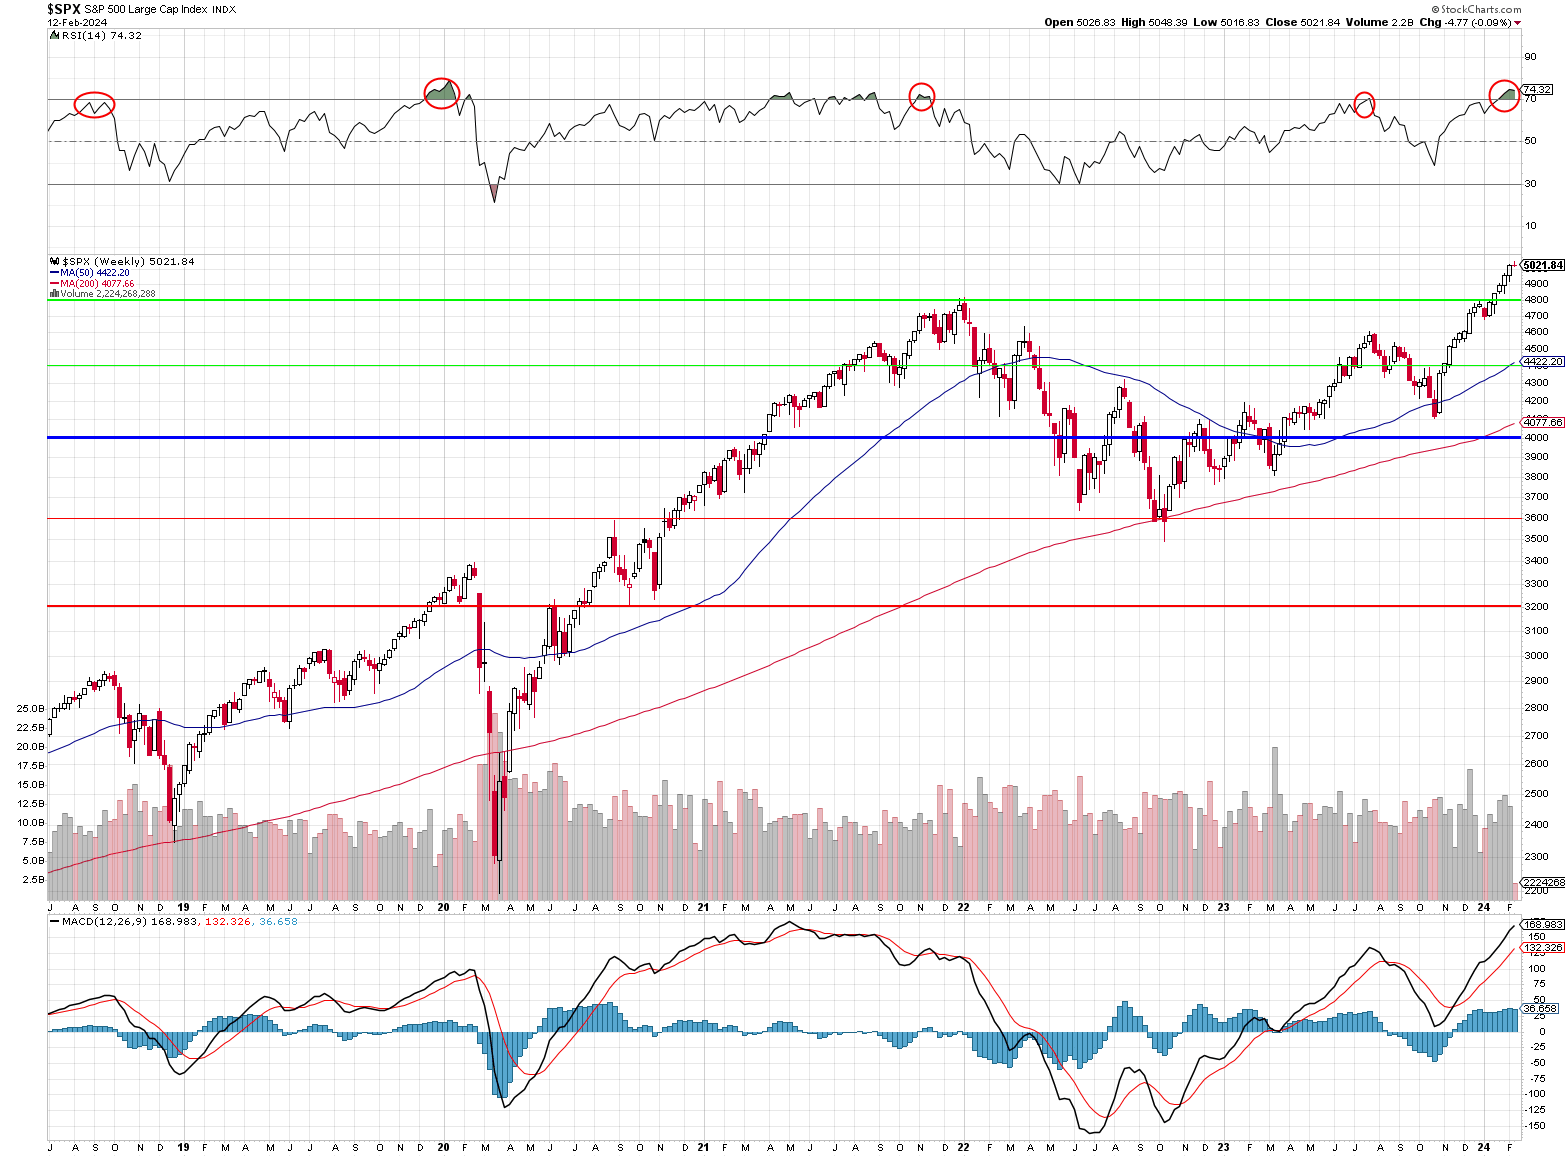
Last week we talked about that RSI line hitting 70 and last month I said I didn’t think earnings would give us a reason to be over 4,800 but here we are at 5,000 but, as I said, I think we’re bullish enough and I’d rather be locking in these gains than adding more risk at the moment.
We just reviewed our $700/Month Portfolio on Friday and that’s doing great, up 41.1% and that’s a 26% annual pace – miles ahead of our 10% goal. That portfolio has no margin and we trade it very conservatively but now let’s see how our less conservative portfolios are looking:
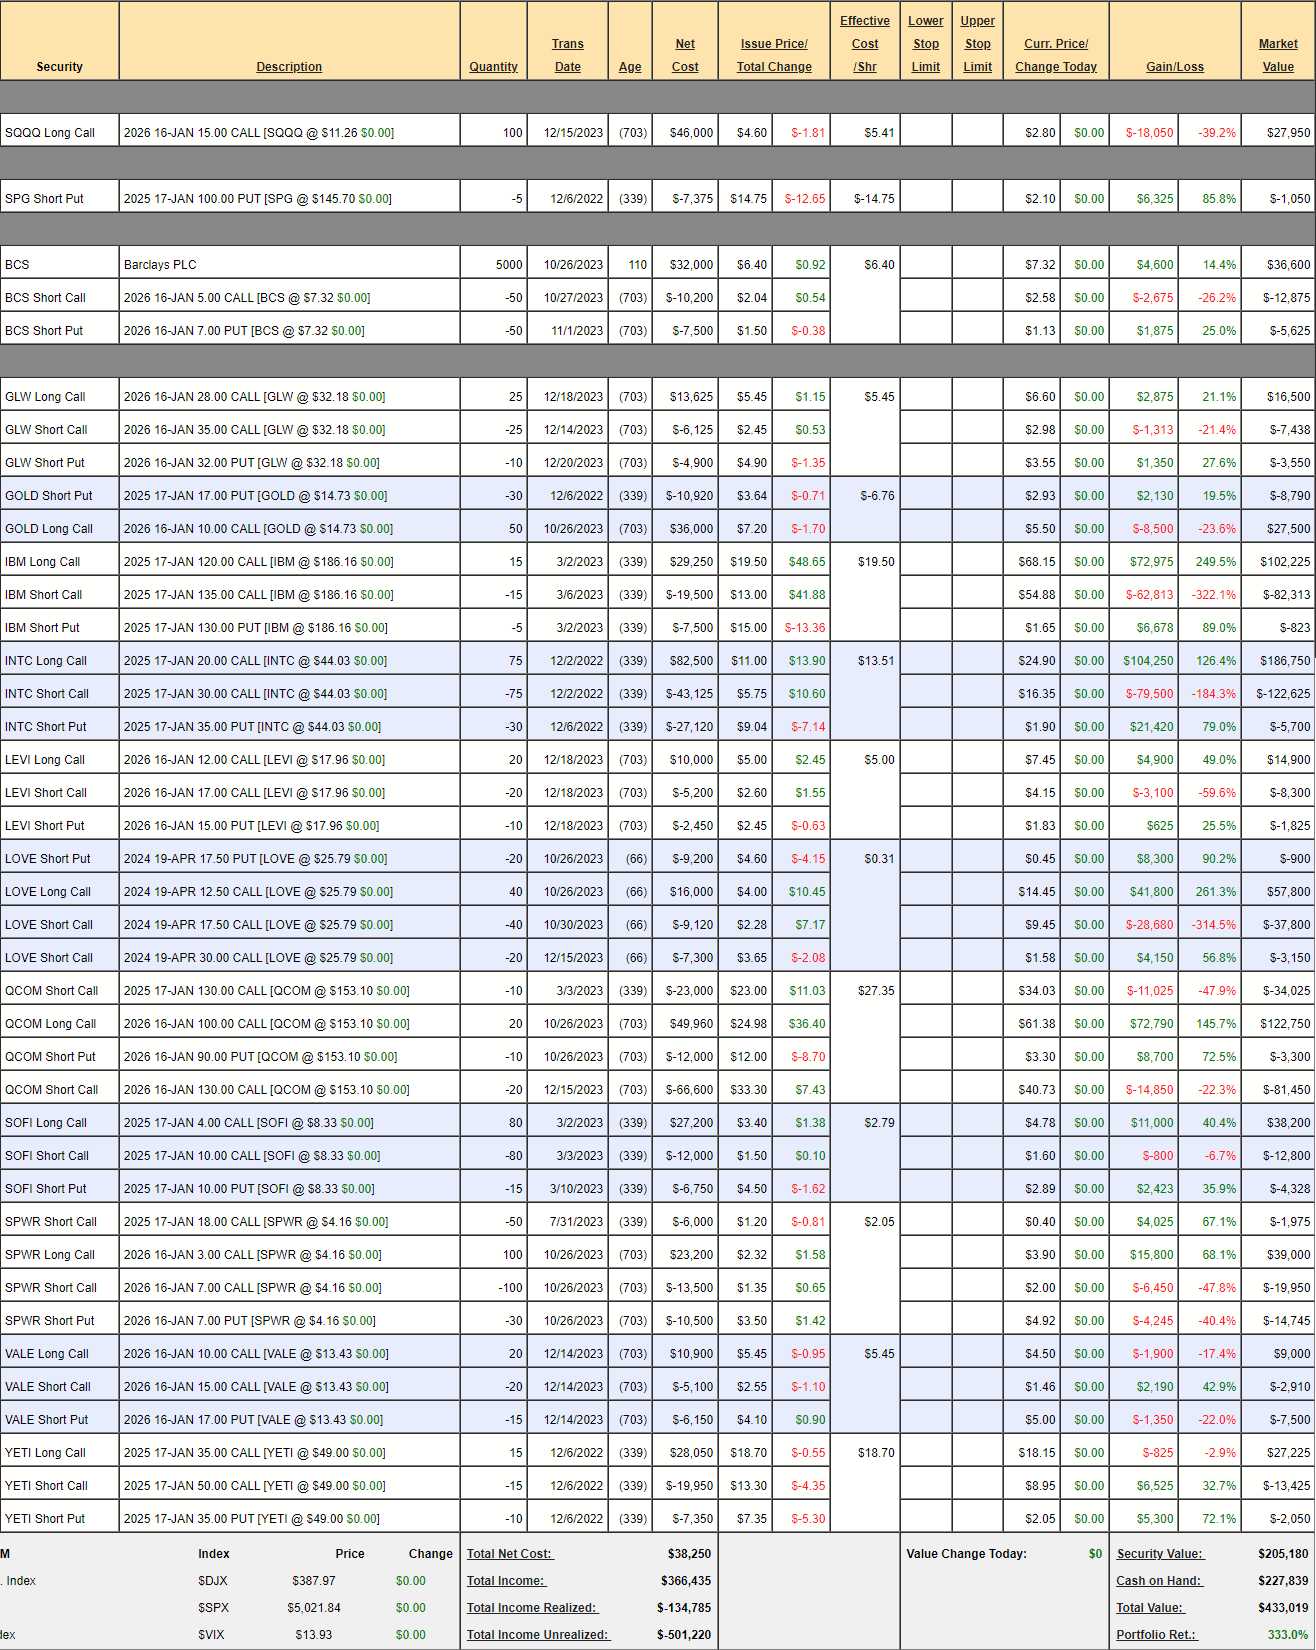
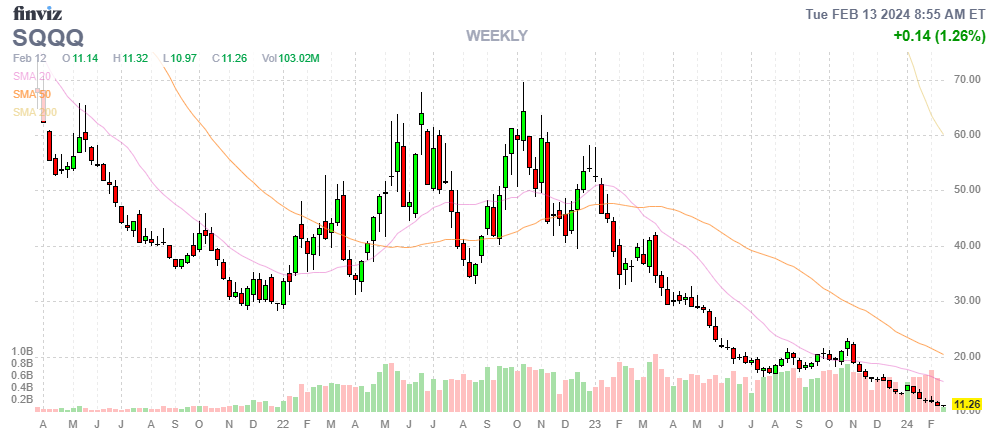
Money Talk Portfolio Review: We only adjust this one on the show and I was last on on Dec 13th – so maybe back next month. At the moment, that portfolio is up 333% at $433,019 and that’s up $9,210 since last month. We were worried about a correction on earnings in December and that didn’t happen so we’ve taken a hit on our SQQQ hedges but we also had short SQQQs that expired worthless for $11,000 in gains and we’ll sell another set next month – so all shall be well.
8:30 Update: As I’m writing this, CPI just came out hot – up 0.3% vs 0.2% expected (not by us – we thought inflation would come back) and, even worse, Core CPI is up 0.4% vs 0.2% expected by leading Economorons so that’s a disaster for the bulls and THIS IS WHY WE HEDGE!!! To add to the misery, Small Business Optimism has slipped from 91.9 to 89.9 and the Futures have turned down sharply – we’ll see what holds…
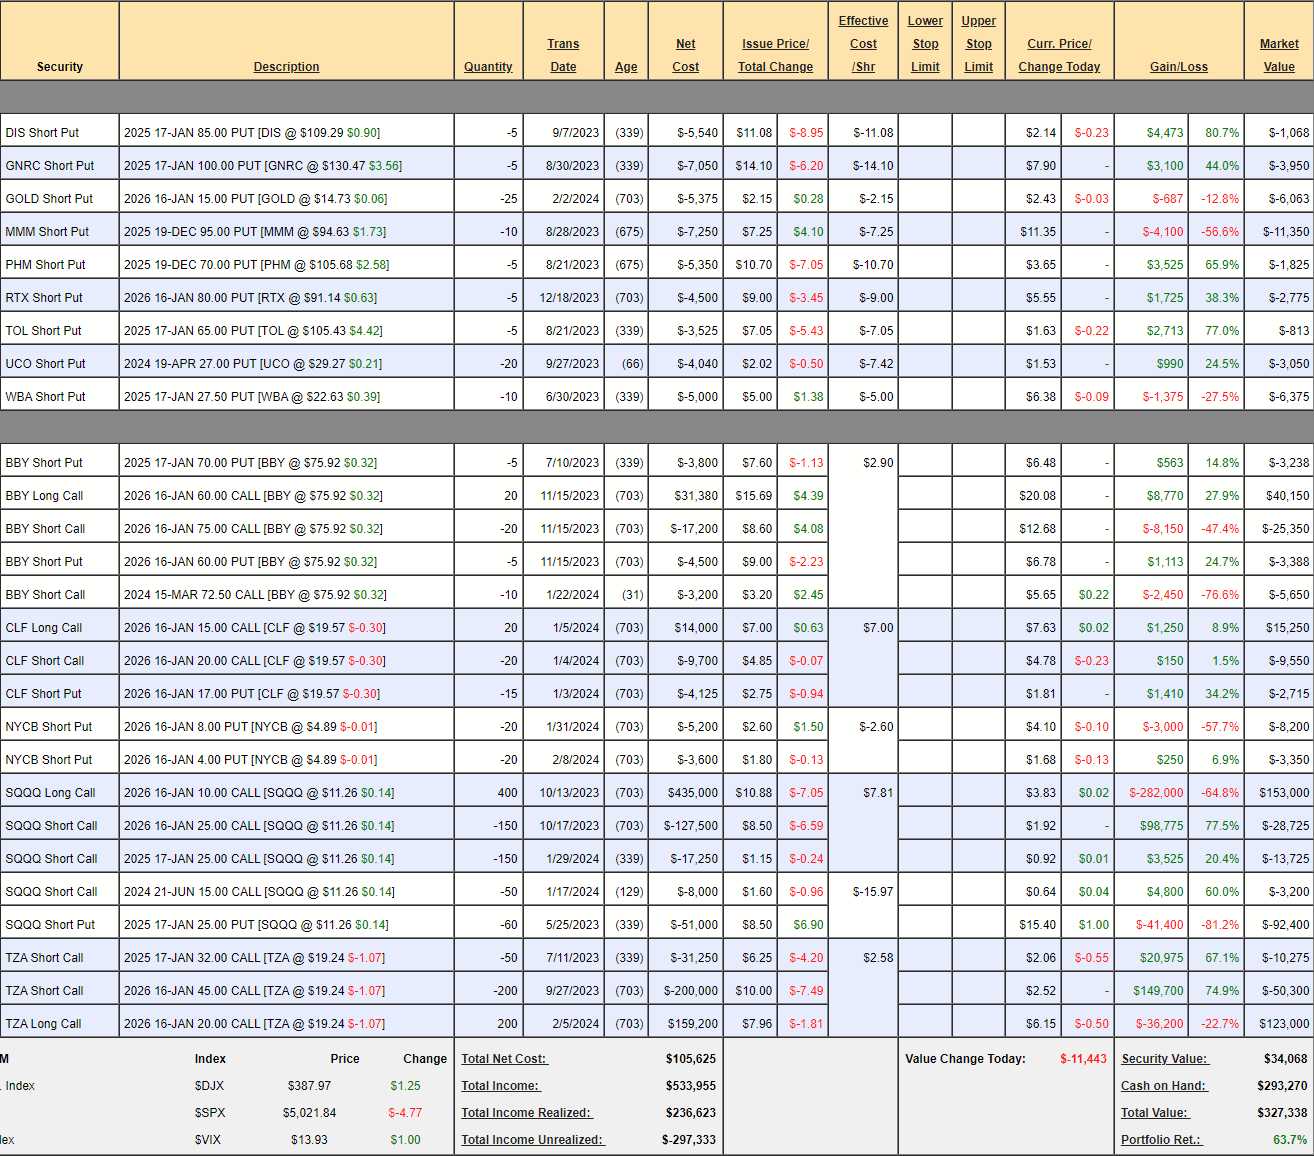
Short-Term Portfolio (STP) Review: $327,338 is up 63.7% and up $9,868 since our Jan 18th review and that’s because we fortunately sold a lot of short calls to cover our hedges. Hopefully we are still adequately covered for the downside so let’s see if we need to adjust:
-
- Short Puts – Performing on the whole and none of them we don’t mind turning into long-term positions so we’ll see how bad this sell-off is before making any changes.
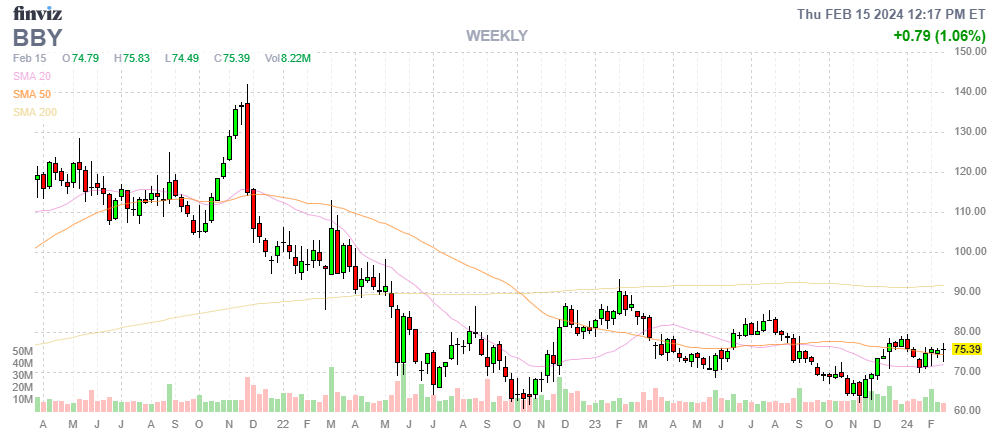
- BBY – We are getting burned on the short March calls but our $30,000 spread is now in the money at net $2,524 so there’s $27,476 (1,088%) left to gain if $75 holds and we sold $72.50 calls that we’ll just roll along but, for now, they are protecting our gains and they are only $2,500 in the money – the rest is premium that will burn off anyway. Good for a new trade if you like making 500% a year back on your cash outlay.

-
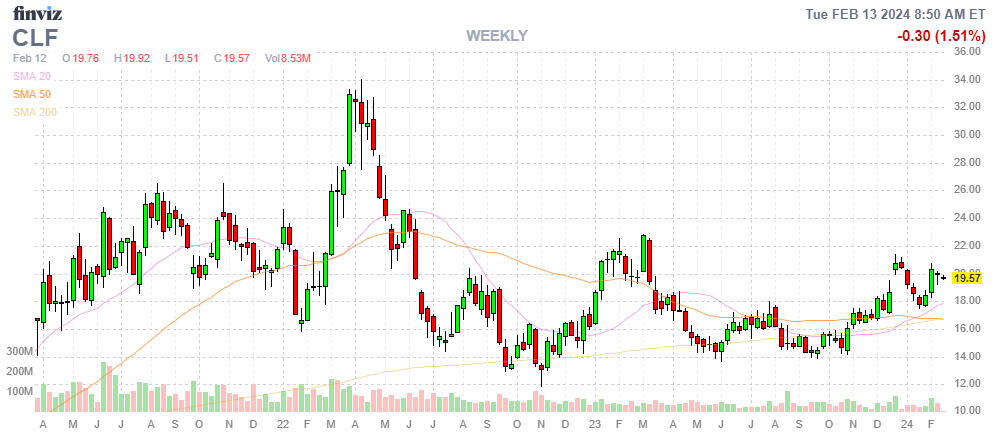
- CLF – We’re at goal on this $10,000 spread we paid net $175 for so you can see why I love these kinds of spreads as cash generators in the STP – they pay off well when our hedges don’t and the worst case is owning a perfectly good stock for a good price. At the moment, we’re at net $2,975 so “only” 235% left to gain from here if CLF can make it to $20 in the next 24 months – I have faith…
-
- NYCB – We just added more short puts. I have faith.
- SQQQ – Now we have the hedges. The main spread is the 2026 $10/25 spread but SQQQ is at $11.26 and it’s a 3x inverse ETF so we expect a 60% gain on a 20% drop in QQQ and that would take us to $18 and that’s $8 ($320,000) in the money and all the short calls are rollable and we’re currently at net $14,950 so net $305,000 worth of protection on a 20% drop and almost double that in a real catastrophe.
-
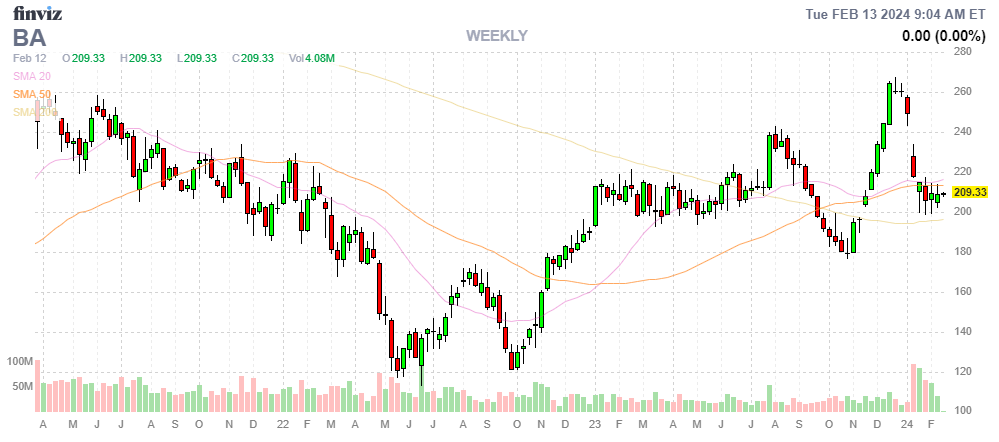
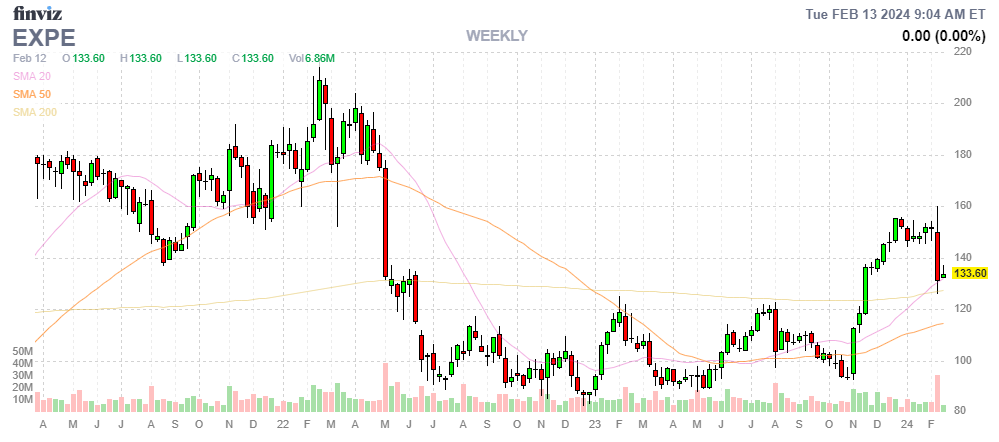
- Now, by the same logic, the SQQQ 2025 $25 put are never going to get out of the money (ultra ETFs also decay over time) so we should take advantage of the SQQQ 2026 $15 puts at $6.50 and roll to 100 short of those ($65,000) and that leaves us $27,400 in the hole but not really as we collected $51,000 initially so we still have a net $23,600 on the position but here’s a fun trick: Let’s sell 10 BA 2026 $180 puts for $18 ($18,000) and let’s sell 10 EXPE 2026 $110 puts for $14 ($14,000) and there’s another $32,000 in our pockets instead of selling more SQQQ puts.
-
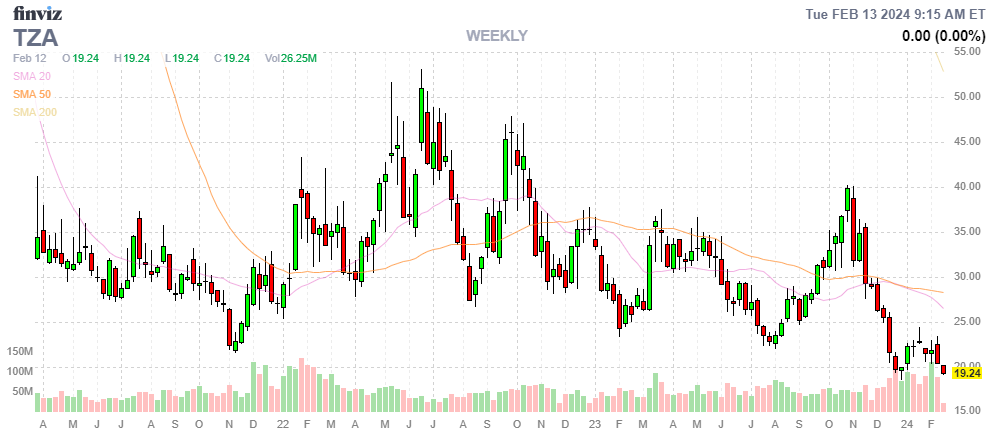
- TZA – $19.24 x 1.6 = $30.78 so let’s call that $10 in the money for $200,000 on a 20% drop in the Nasdaq. Not worried about the short 2025 $32 calls but they are already up 67.1% so we should buy them back and we’ll sell something else on a dip. Meanwhile, our 200 2026 $20s are $6.15 ($123,000) and we could roll to 500 of the 2026 $20/30 ($4.20) spreads at net $1.80 ($90,000) so we’re taking $33,000 off the table ($22,725 net of the buyback) and now we have $500,000 of protection at $30 and the spread is about net $50K so let’s call it net $450,000 worth of protection.
Butterfly Portfolio Review: $251,210 is down $5,724 from our last review and that’s to be expected as we have only covered calls and short calls and short puts in this portfolio, so it underperforms if the market is up a lot. Still up 25.6% since May 22nd is right on track for our “slow and steady” portfolio, which aims for 30-40% annual gains and gets them almost every time.
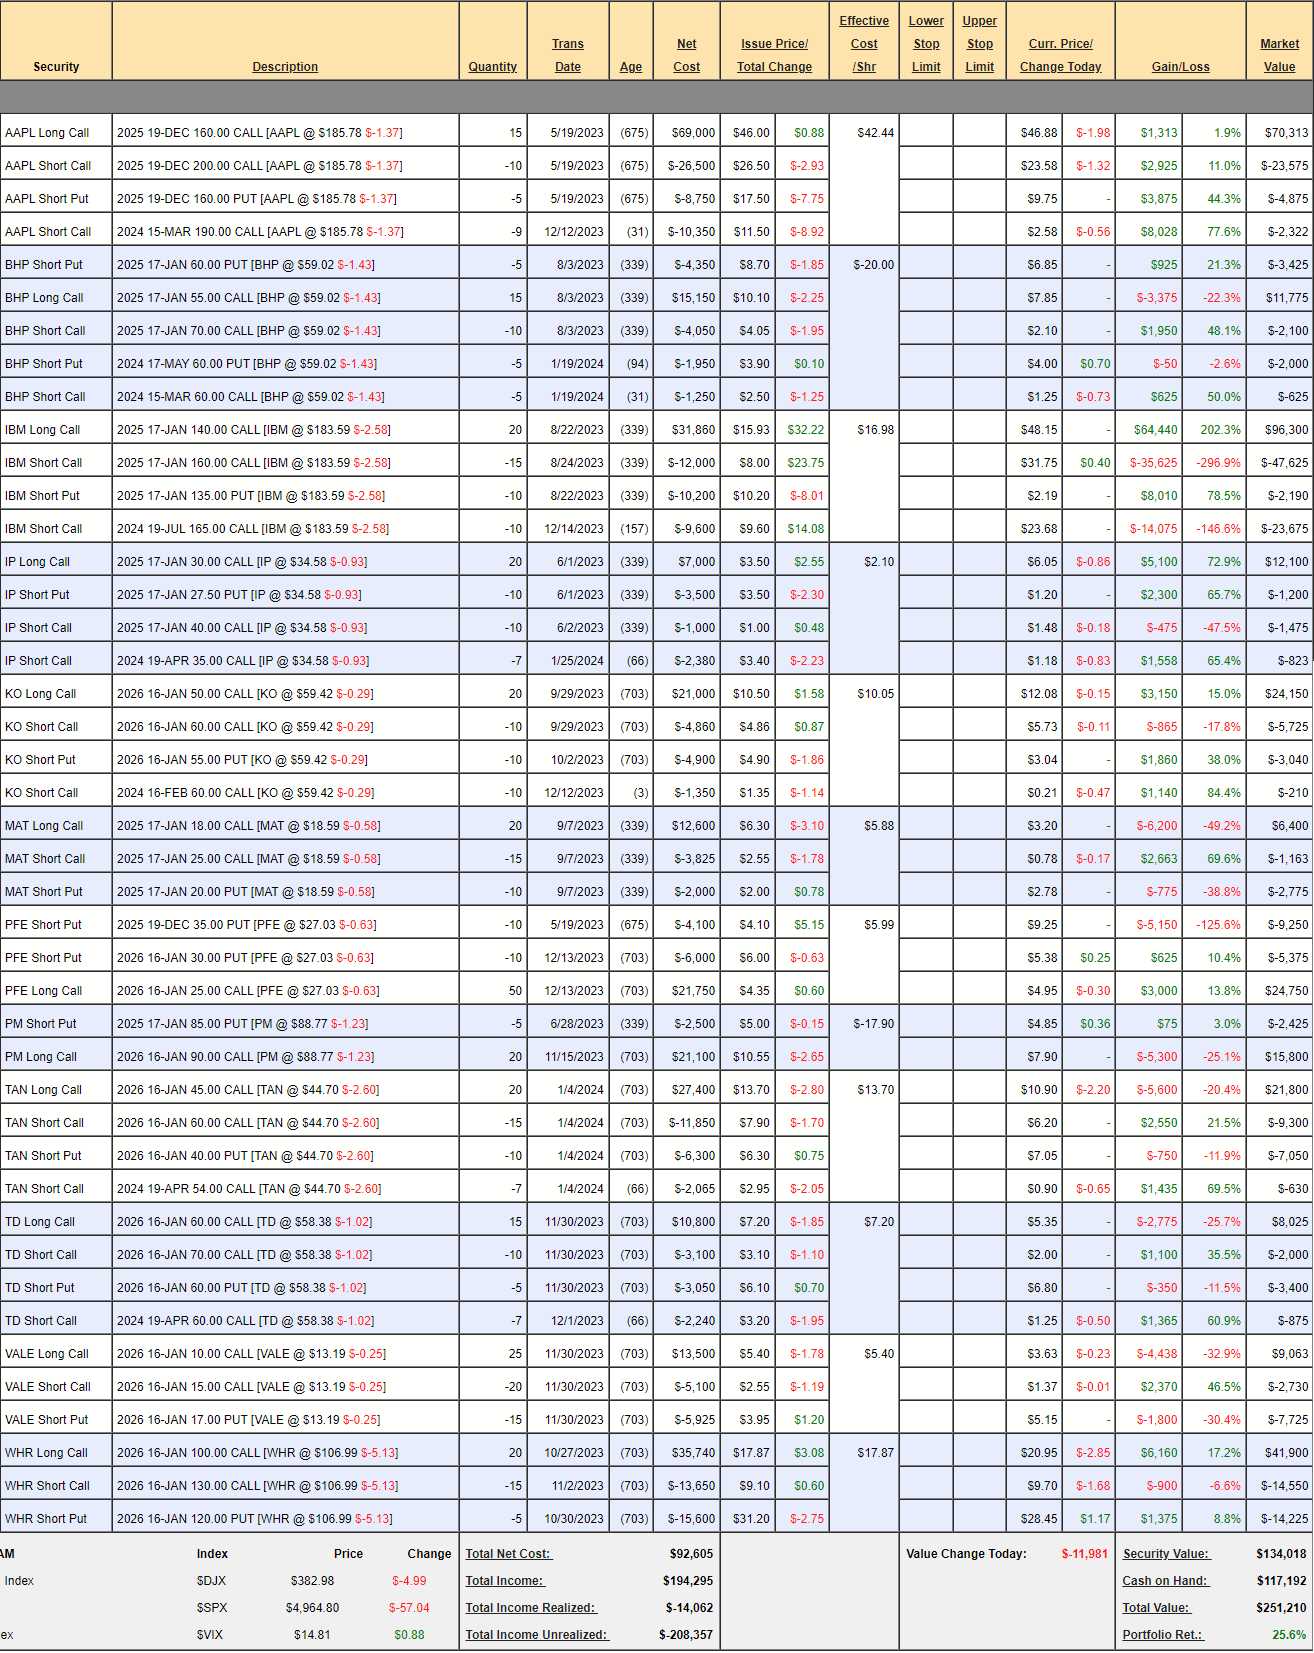
AAPL – Glad we sold the March calls but they are already up 77.6% so let’s buy those back and sell 7 May $190 calls for $6.90 ($4,830) and that’s + about $2,500 for us.
BHP – Right on target so far.
-
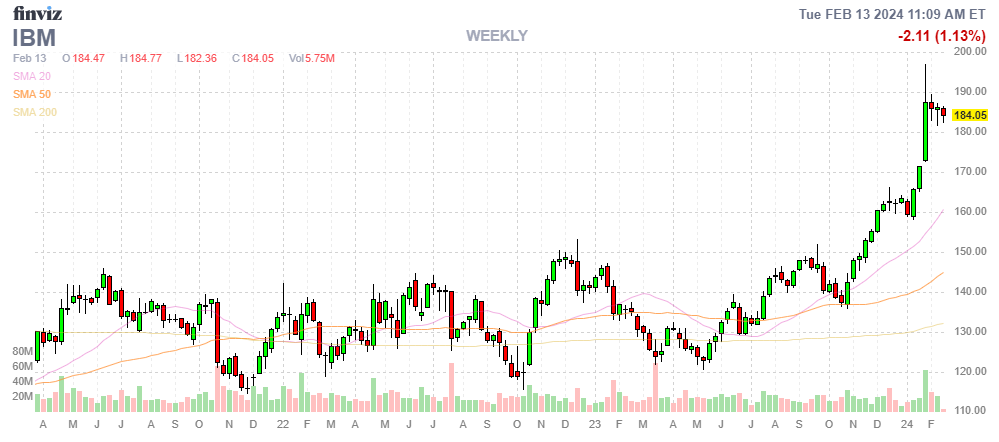
- IBM – Blasted up so we’re burned by the short $165s and our bull spread is 100% in the money. Good time to step back and realize we came in for net $90 and, despite the loss on the short July calls, we’re at net $22,810 so a very nice gain despite the glitch.
- So, how do we fix it? Well we love IBM so it’s really and excuse to buy more and our longs are 2025 $140s at $48.15 ($96,300) so how about we roll those to 50 IBM 2026 $170 calls at $30.60 ($153,000) and sell 30 IBM 2026 $200 calls for $17.20 ($51,600) and we will roll the 10 short July $165 calls ($23,675) and 5 of the short 2025 $160 calls ($18,750) to 20 short July $180 calls at $13 ($26,000) and we’ll buy back the current short $135 puts ($2,190) and sell 10 of the 2026 $160 puts for $10 ($10,000).
- All in all, we spent net $13,500 to move our $40,000 spread that was net $22,810 to a $150,000 spread that’s $70,000 in the money AND we addressed our short call problem so – all in all – a good day’s work!
-
- IP – We just sold the April calls and they are up big but also right on track.
- KO – Still right on target.
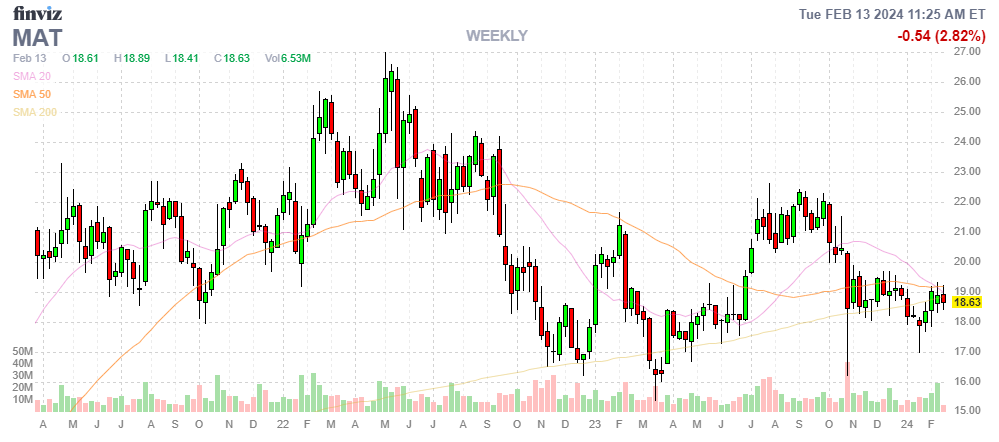
- MAT – We thought they’d have better earnings. Let’s sell 7 of the April $18 calls for $1.45 ($1,015), which is a nice 66-day return on our net (originally) $6,775 spread. After the next earnings, we’ll decide if it’s worth buying another year for our longs.
-
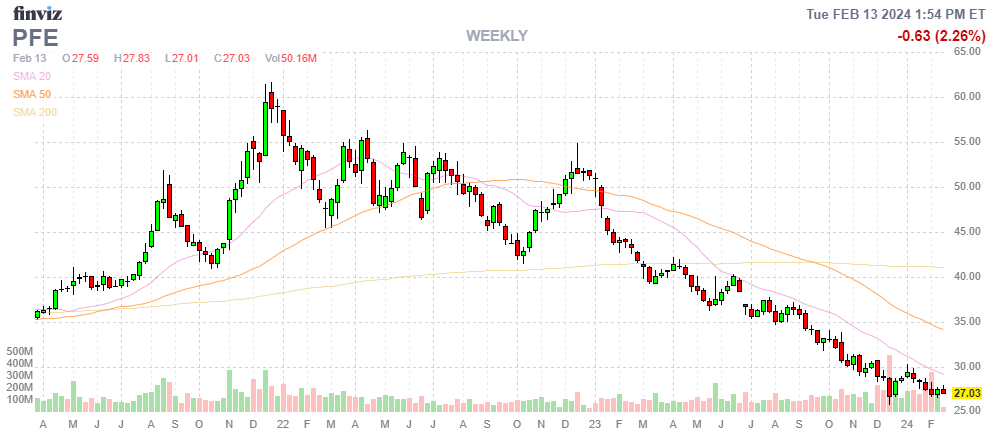
- PFE – Well earnings didn’t help but it’s not like we don’t want to own the stock forever. We’re in for net $11,650 so let’s sell 30 April $27.50 calls for $1.10 ($3,300), which is a nice 28.3% return for 66 days work and they expire before earnings so easy roll and we’re otherwise uncovered so why not take the money?
- PM – Another uncovered one which was not helped by earnings. Here we’re in for net $13,375 (we made some money on short calls but that’s in the past) and we can sell 10 June $90 calls for $3.10 ($3,100) and that’s 23.1% for 129 days so we’re better off buying more PFE, aren’t we? Let’s kill this!

-
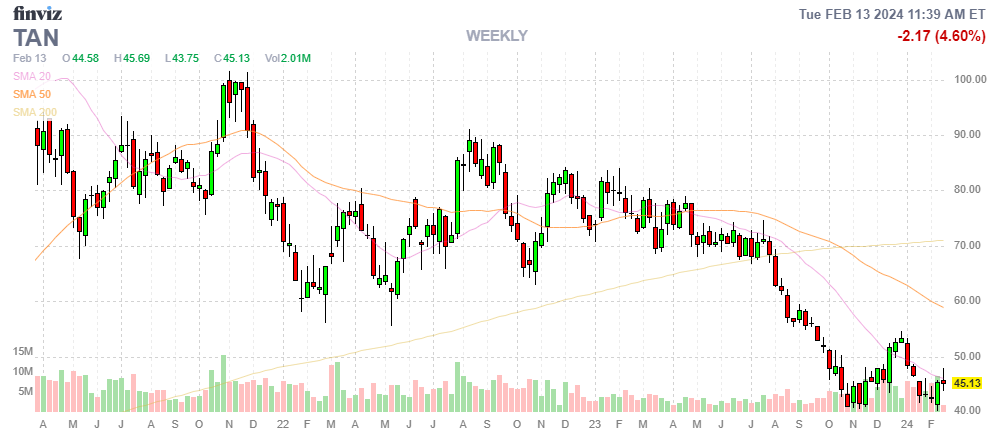
- TAN – Notice it shows a net loss so far but WE DON’T CARE. Our plan was to spend net $7,185 and that gave us 8 quarters to sell $2,000 worth of short calls ($14,000) and make 100% and anything we make on the spread (over $45) is a bonus. Well, our first quarter of short calls is up 69.5% after just over a month and we have no reason not to buy those back ($630) and sell 7 April $45 calls for $3.70 ($2,590) and now we’ve put another net $1,960 in our pockets for the same time-frame!
- The only risk we are taking is it pops up on us but we have 2 years to roll and the longs are 5 open anyway so very little risk overall and double our expected quarterly return – worth it!
-
- TD – Back on track (was over last time and we decided to wait).
- VALE – Earnings are the 22nd, so we’ll see.
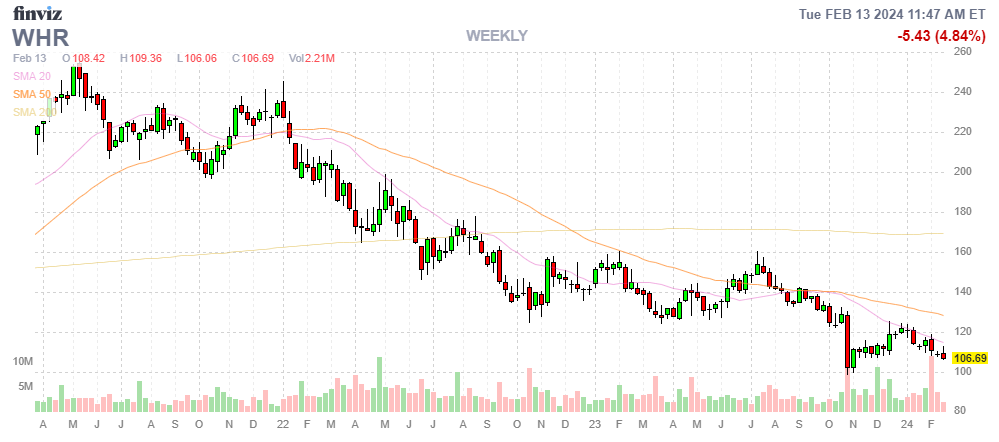
- WHR – They beat on earnings but gave conservative outlook. I think $106 (P/E 12.3) is stupidly low so I’m not inclined to cover until we see the April report.
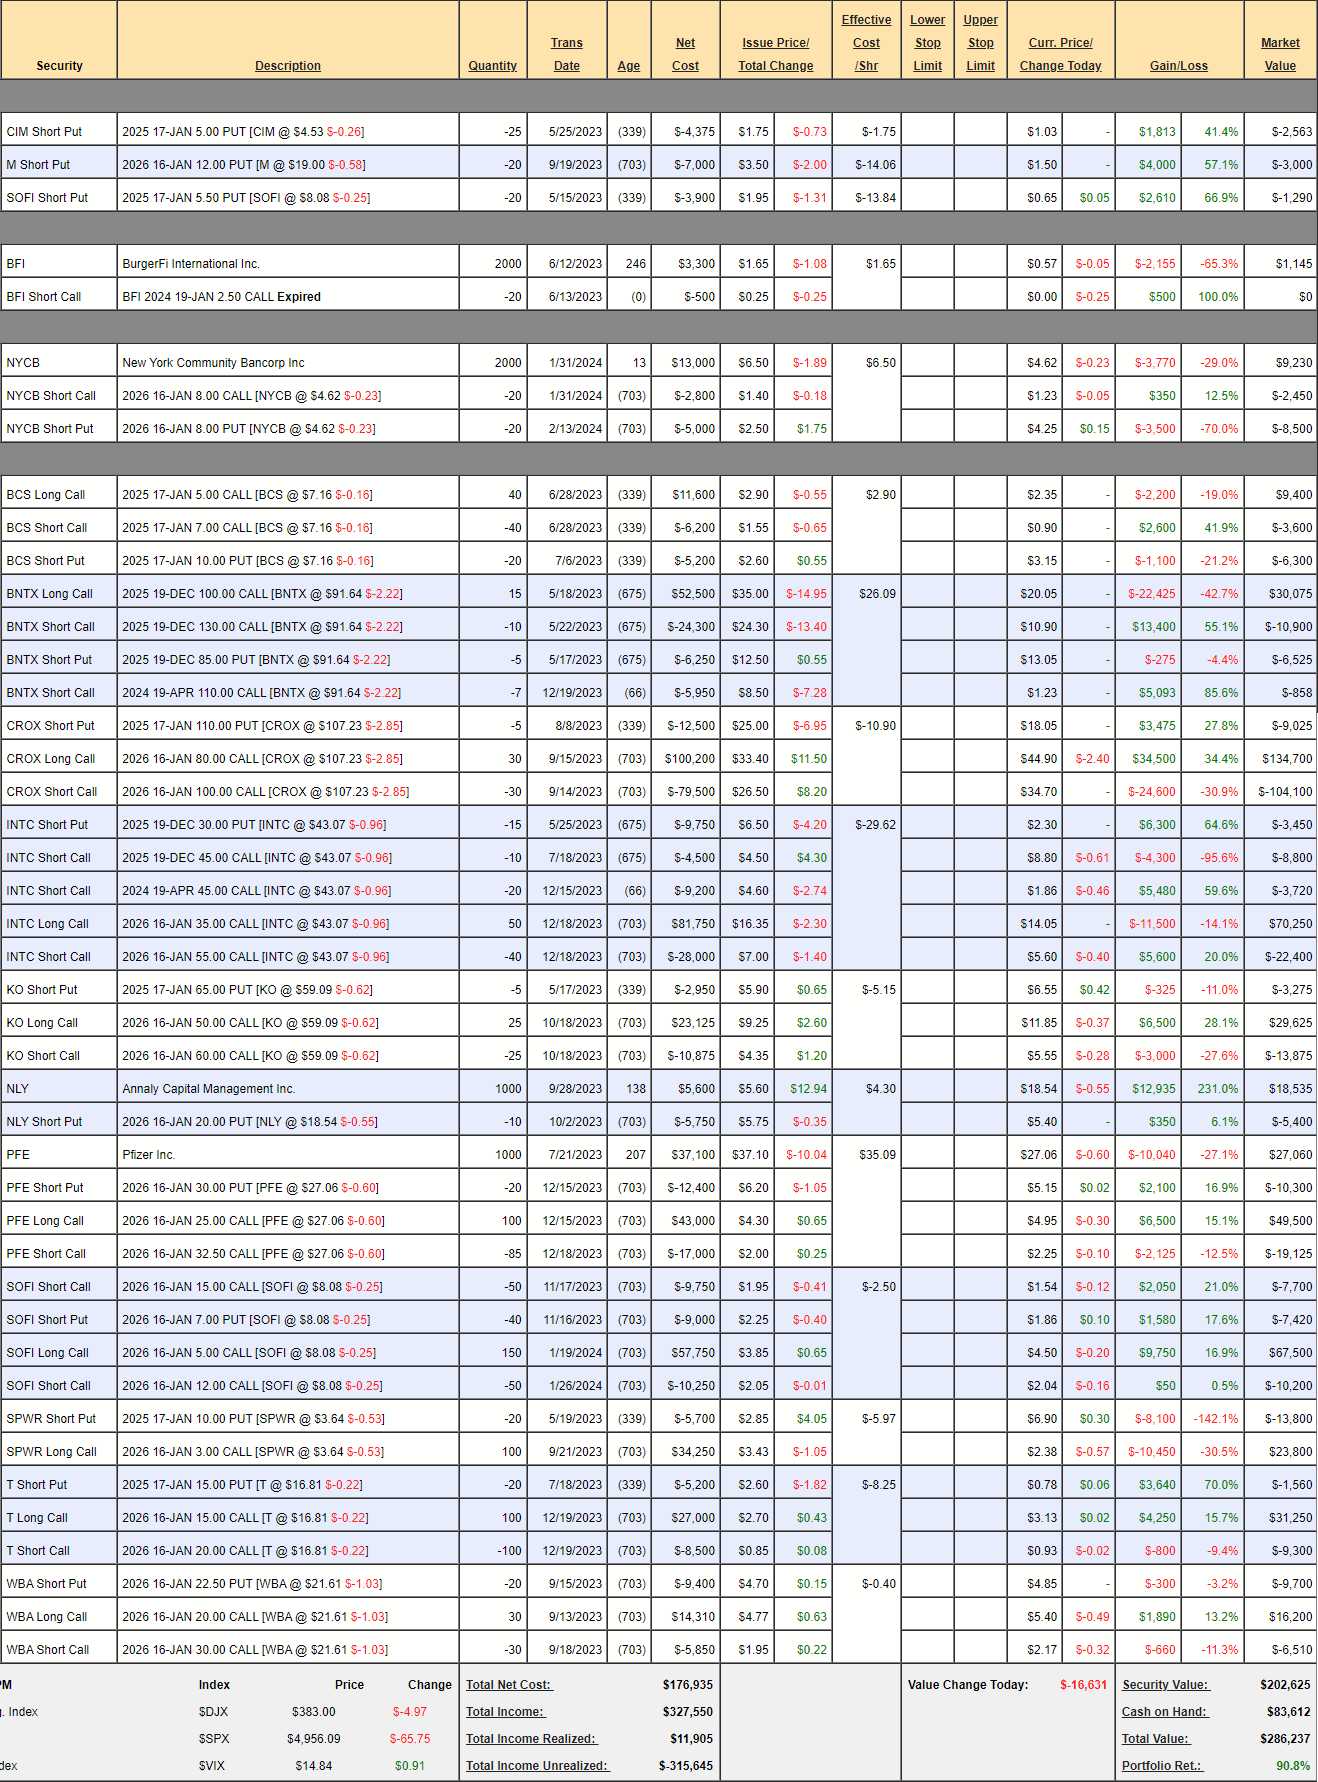
Income Portfolio Review: $286,237 is up 90.8% and up $31,991 since our Jan 18th review, where we hardly touched a thing so leaving it alone seems to have been the wise strategy last month.
The Income Portfolio is mainly opportunistic – we grab things when they are cheap but we also need to see a path towards generating an income over time – either through dividends or short-term option sales.
-
- Short puts – All in good shape.
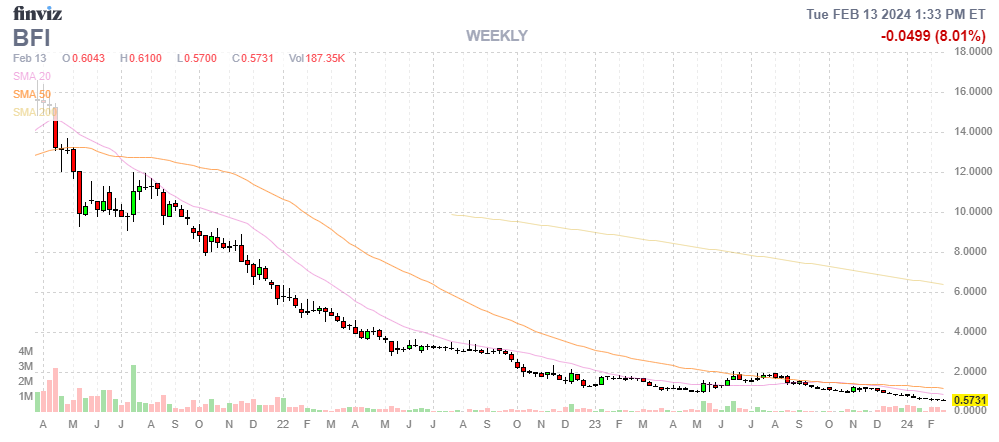
- BFI – They are engaged in a long turnaround but they are doing it but everyone is bailing. You can buy the whole company (Burger Fi and Anthony’s Coal-Fired Pizza) for $16.7M at 0.57/share and that’s for 96 BurgerFi and 60 Anthony’s stores so $107,051 per location seems cheap to me and they are opening 30 more in 2024 with $169M in revenues ($1M/store) and they used to make about $150,000 per store before they started expanding, which would be $22M with the current store count so I don’t think it’s an insane gamble to stick with them and, for $2,280 we may as well triple down to 6,000 shares.
-
- NYCB – Just added this one and it bit us already. Our net is only $2.60 so it’s not worth fixing or adding more yet.
- BCS – This does look like a wounded warriors portfolio but it’s working!
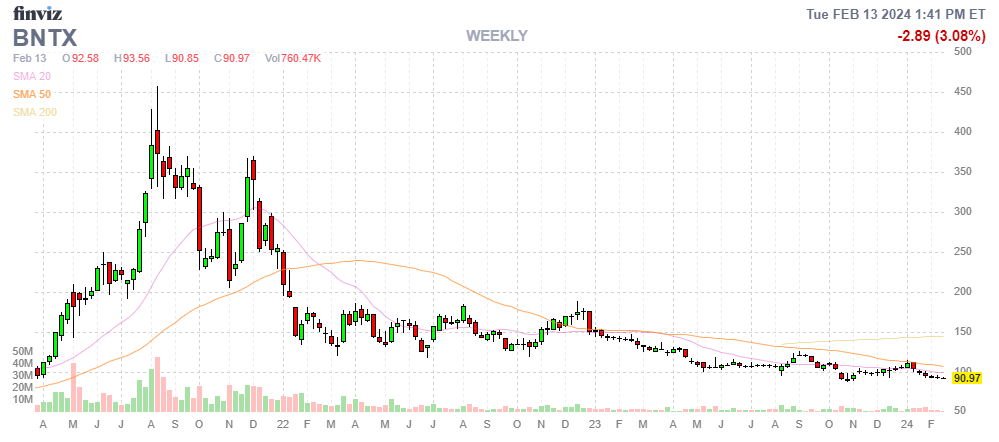
- BNTX – Still in the Bs? This is silly as $91 is $23Bn and they have $14Bn in the bank because they made $19Bn during Covid and $1Bn last year but 2024 they expect back to $322M on $3.2Bn in sales and you can’t get global pandemics every year but this is not a startup and they have proven their system works and they can scale cures when needed and now they have $14Bn to play with an no cash burn. Before Covid they only had $500M in the bank and look what they did with that!
- In fact, let’s buy back the 7 short April $110 calls for $858 as they are more likely to hurt us than help us. Earnings are March 20th.
It’s good when you have a portfolio full of stocks that make you think other investors are crazy…
-
- CROX – The madness continues. At least CROX is on track as other people finally see the value.
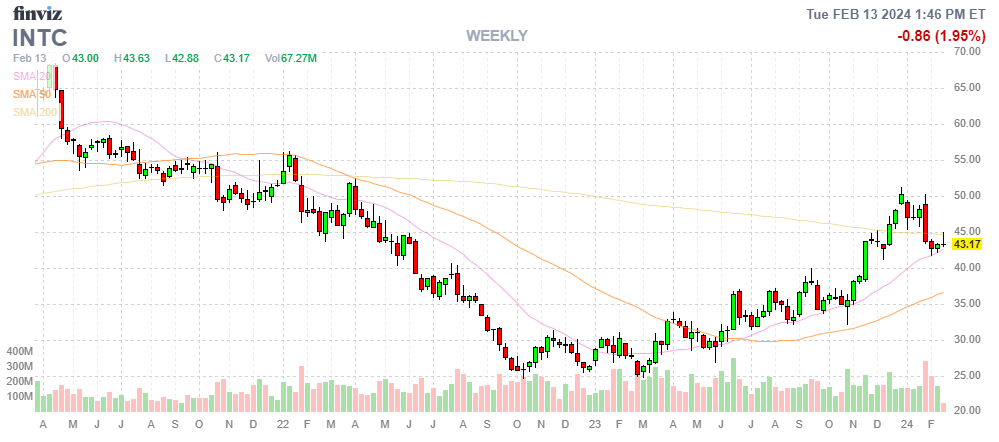
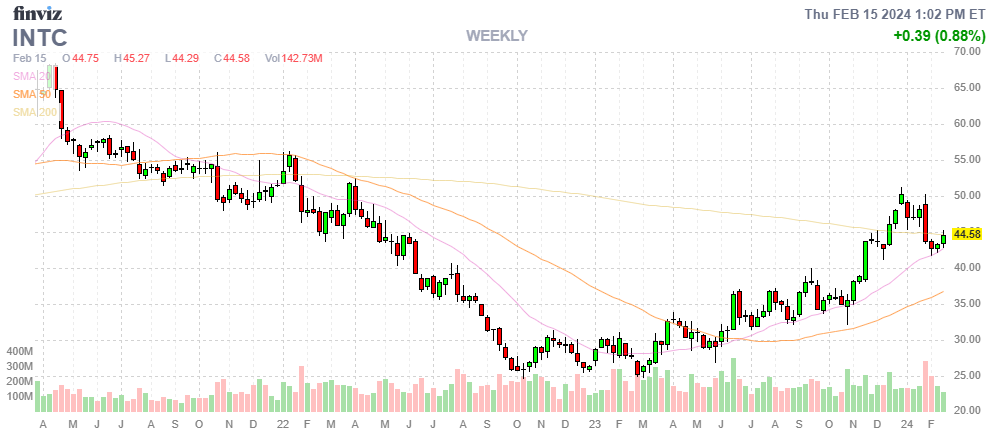
- INTC – This one I was banging the table for for 2 years and FINALLY people started buying it. Right on track now.
-
- KO – On track.
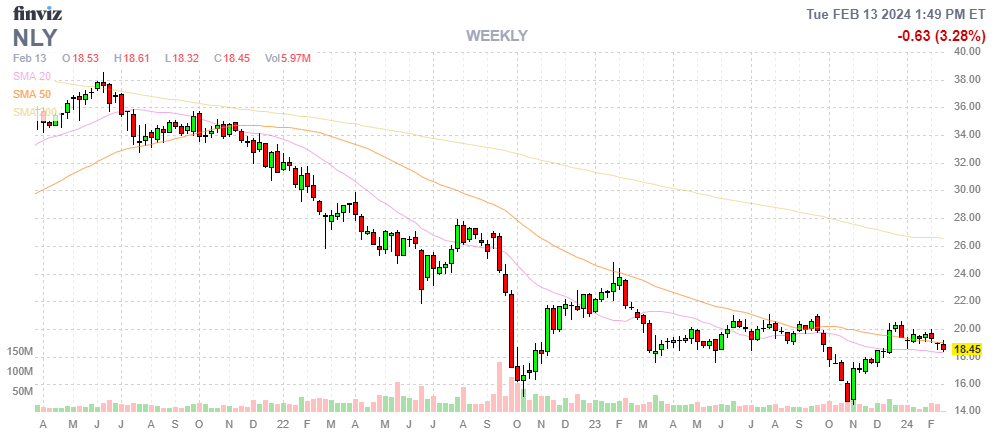
- NLY – We should have covered at $20 but can’t complain. 2026 $20s are only $1.10 and maxed out at $1.60 on the 26th. I would have taken $1.50 but I won’t take $1. They are probably consolidating for a move over $20 anyway.
-
- PFE – Waiting however long it takes for people to do the math here. $27 is $156Bn and they made $50Bn during Covid but just $12.5Bn projected this year and that’s only 12.5x earnings but, pre-covid (2020), they made $9Bn and had $52Bn in debt (now $13Bn) yet they traded at $35. $27 is just silly!
- Forgetting the 1,000 shares, the $75,000 spread is net $20,075 so it has $55,925 (278%) upside potential if PFE can hit $32.50 in two years. And your worst case is you end up owning 2,000 shares of Pfizer…
-
- SOFI – Like a bucking bronco. Now we have 150 longs and 100 short calls. Call it a $105,000 spread that’s currently net $42,180 (because it already made us $13,430 in a few months.
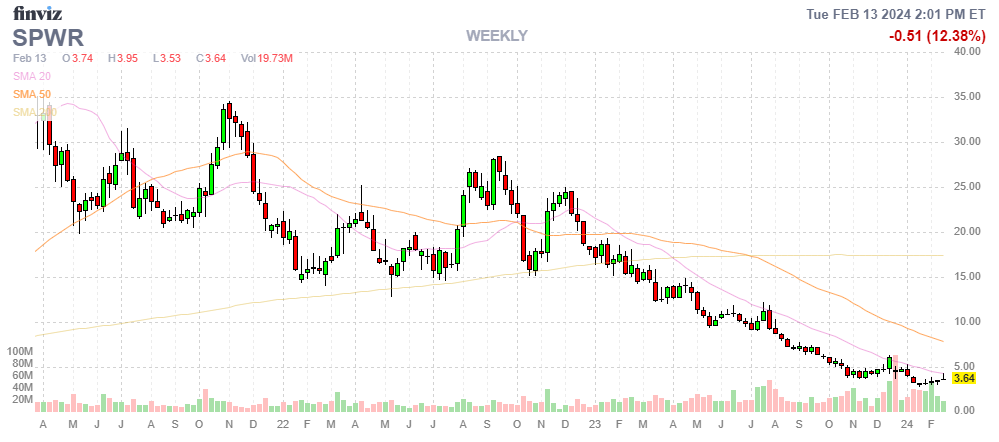
- SPWR – Oh sure, they are down a lot but look at the recent comeback (magnifying glass required). Well, it was below $3 so up 20% from that low and I’m not ready to cover yet.
-
- T – Another stock we just buy more and more of if it gets cheaper. In this case though, we’re on track.
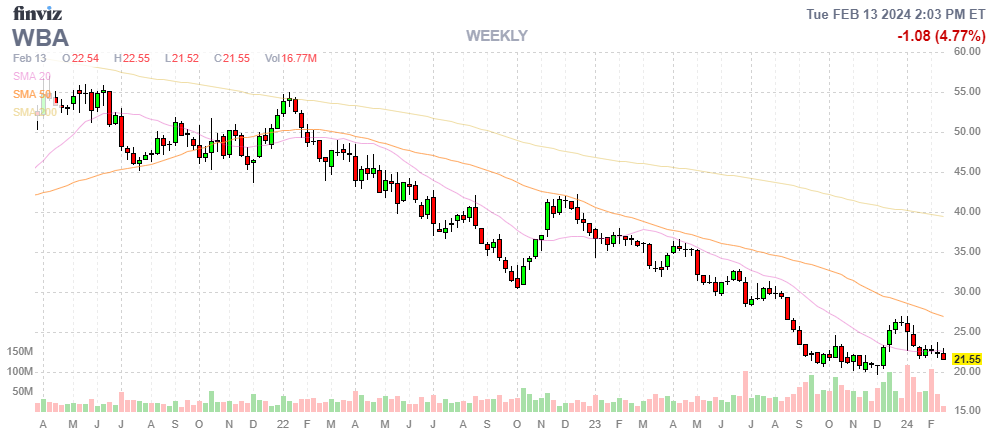
- WBA – Guidance did not impress in January but earnings were fine so let’s give them some room and some time.
Once again we have pretty much no reason to touch these positions. Nice and relaxing!
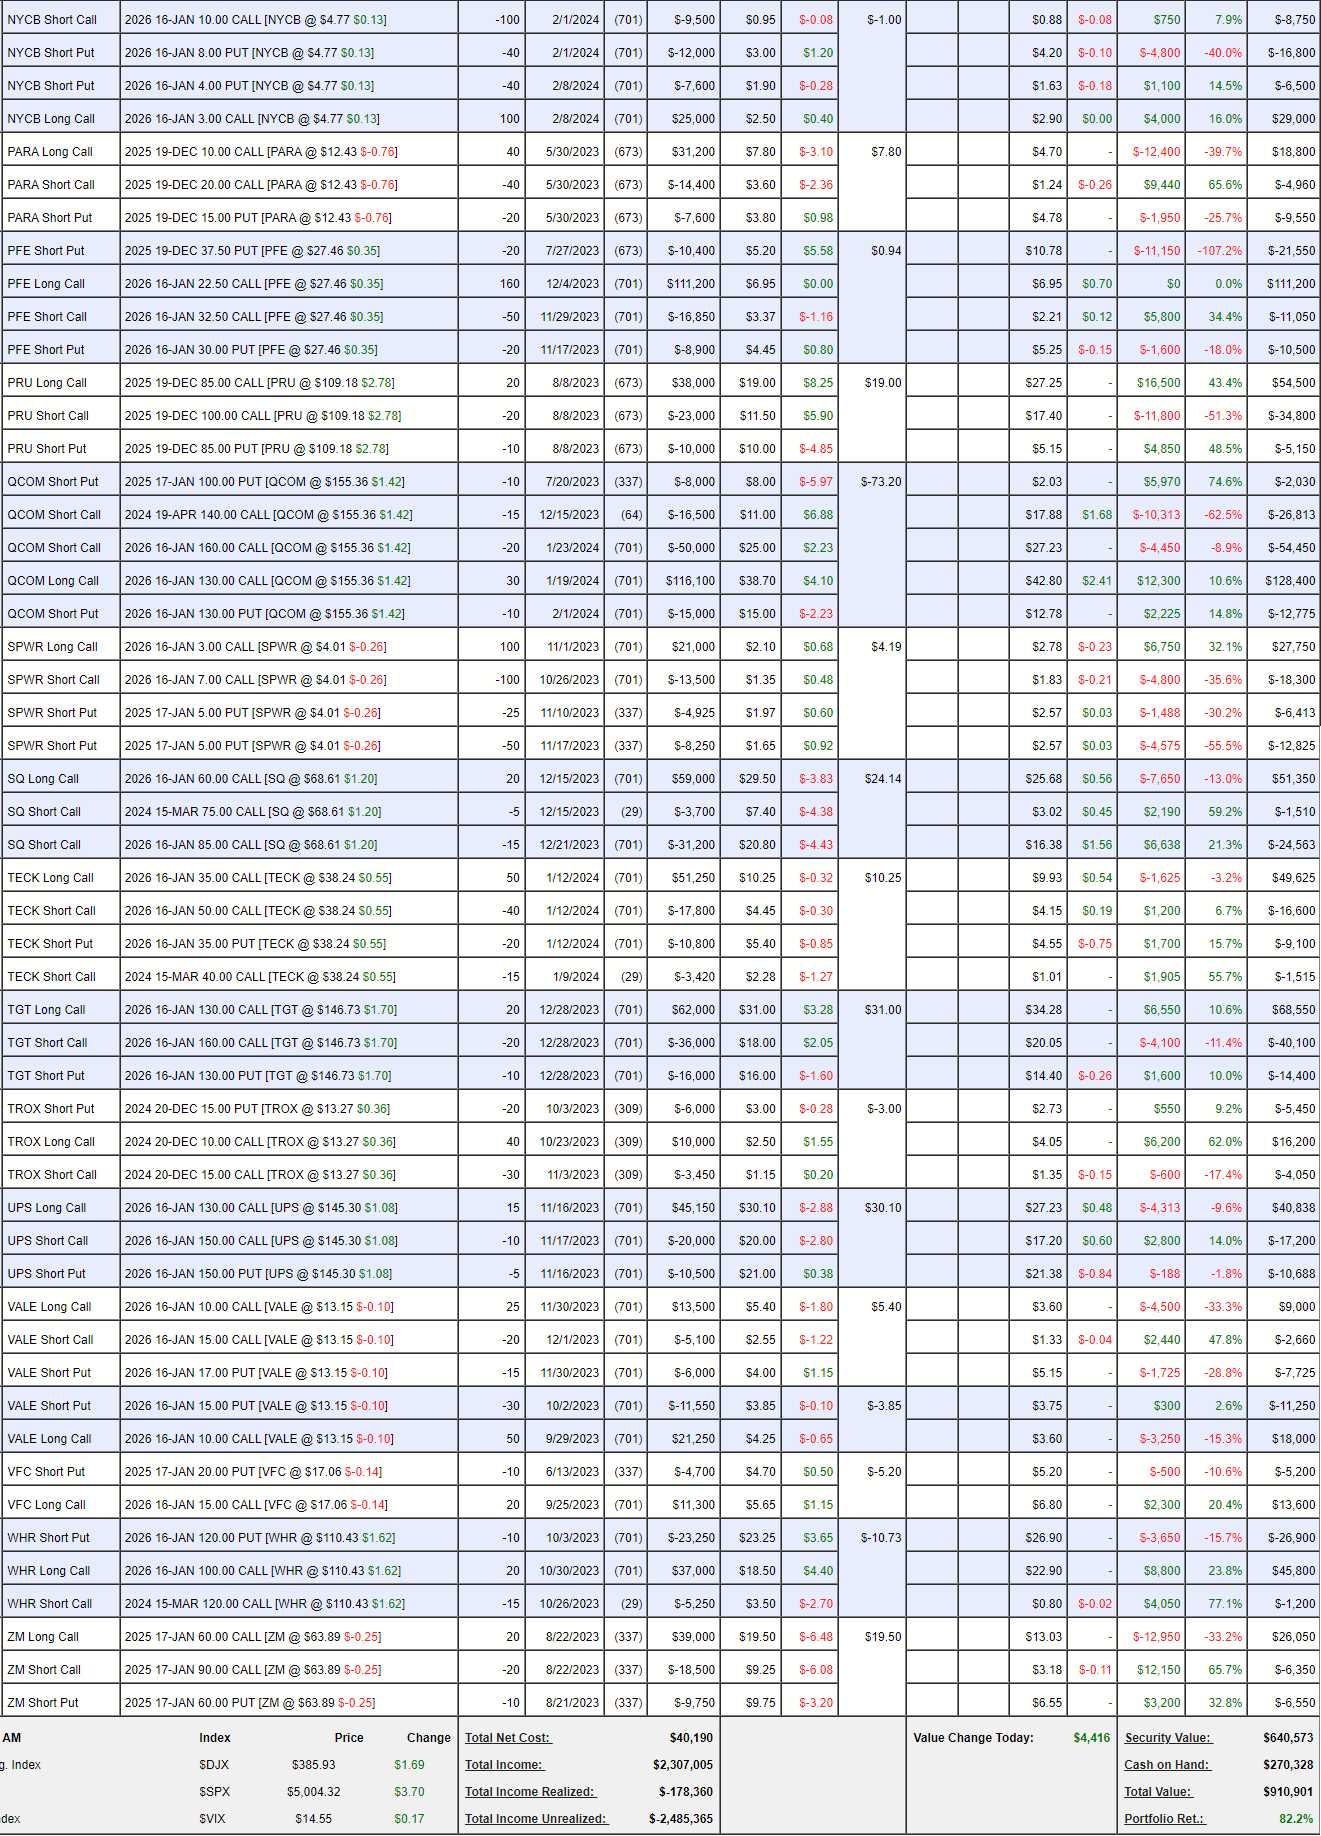
Long-Term Portfolio (LTP) Review: $910,901 is off the highs but still up $32,880 (3.74%) since our Jan 18th review and anything not down is fine by us when we’re up 82.2% since our May 16th start at $500,000. We are certainly on the way to a double in our first year!
The LTP is our most aggressive portfolio and we count on the hedges in the STP to have our back. As a rule of thumb, we channel about 1/3 of our unrealized gains into more hedges each month – to lock them in.
As we only have $270,328 (29.6%) in CASH!!!, I would love to cash some positions out but I say this a lot and then it turns out these positions are too good to cash out (which is why they are up 82.2%!). We’ll see if we can get something off the table this time:
-
- Short Puts – This is the on-deck circle for new positions. Stocks graduate from our Watch List to light commitments as short puts before we initiate full positions. None of these are in trouble and none we wouldn’t love to own at the net prices so all good here.
- JPM – We didn’t sell puts because they never went down but our net $13,00 entry is well on track for the full $30,000 potential.
- RH – We did sell puts on these (above). This spread, with the short puts at net $3,025 on the $60,000 spread could be the easiest money you ever make!

-
- AAPL – On track for $60,000 at net $38,715 – we’ll add to it if it ever goes lower.
- AKAM – That one was obvious. Right on target.
- BABA – Just added them after a year-long break from Chinese stocks. Lower so far…
- BBY – We also have them in the STP, on track in both.
-
- BYON – Used to be BBBY. Already at our 2026 target and we’ll probably have to roll the short March calls but they are acting as a hedge for now.
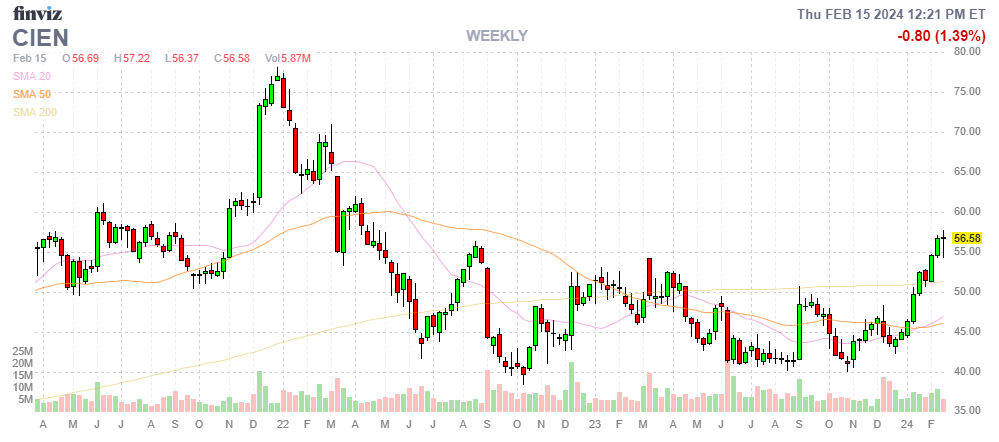
- CIEN – Way over our target at net $11,575 on the $20,000 spread so no sense in cashing them out with $8,425 (72.7%) upside in 11 months. Also no sense not to take the money they are giving away here as a new trade!
-
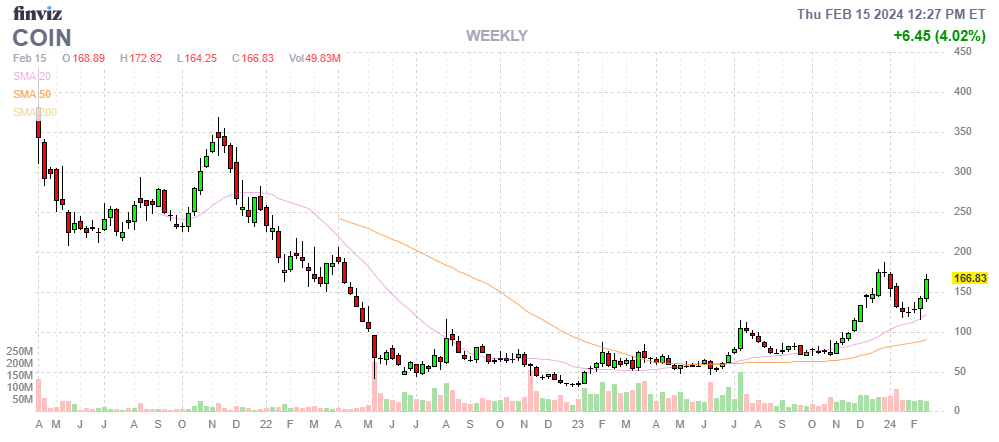
- COIN – Wow, from worried about them going lower to worrying about them running away in very short order. We discussed this the other day and I said I’d rather buy 100 more long spreads to cover than pay $175,000 to buy back the short $150 calls that are almost all premium. At the moment, consider them a hedge to protect our $382,500 spread. The current net is a $53,913 CREDIT and I wouldn’t sell those 2025 $150s now, but there are lots of great ways to make a great spread with these options!
As you can see, we don’t need many winners like this to have fantastic returns in the LTP. The base strategy is to put stocks on the Watch List and, when we’re satisfied a good bottom is in (value-wise), we take a stake and then we often increase it if the stock goes lower because our Fundamentals usually trump market panics. The STP generates more money for us in a down market and the gains we make in an up market dwarf even a total wipeout in the STP ($200,000 to start).
-
- CROX – Right on track.
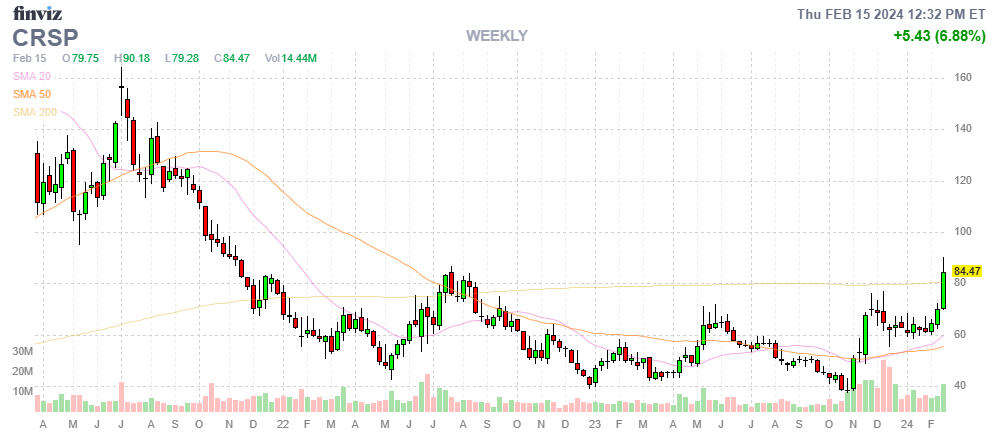
- CRSP – Running a little hot but too early to worry. Wouldn’t mind an excuse to buy more longs, actually – the potential of this company/technology is incredible.
-
- CSCO – Boy this is tough, I love all of these stocks!
- DIS – Finally out of the dog house. Net $28,600 on the $30,000 bull call spread is a good one to take off the table. No reason to buy back the short puts and we’ll just have to wait for the next opportunity.
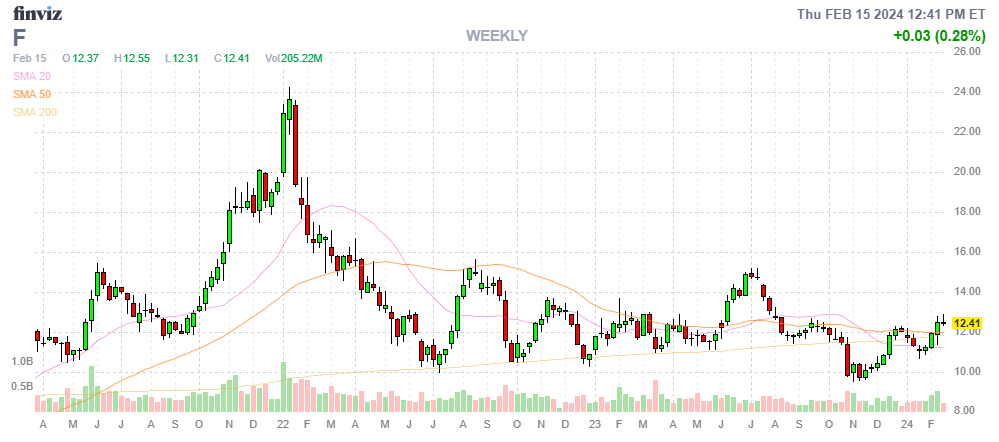
- F – Still in the dog house at $12. They paid a special dividend (0.18) today and screwed up the options so it’s showing $0 and it should be $5.12 so that’s $51,200 more that the LTP should be up, when the options are fixed!
-
- FF – I love these guys and it looks like they are finally getting a little attention.
- FL – I also love totally basic companies that make money. We started in May of last year (one of our first buys) and, when they went lower, we rolled down and added more shares (kind of like our game plan) and look at them now! Still only net $63,050 on the $150,000 spread that’s well in the money with even more earnings potential ahead from short call sales. Only good as a new trade if you love free money…

-
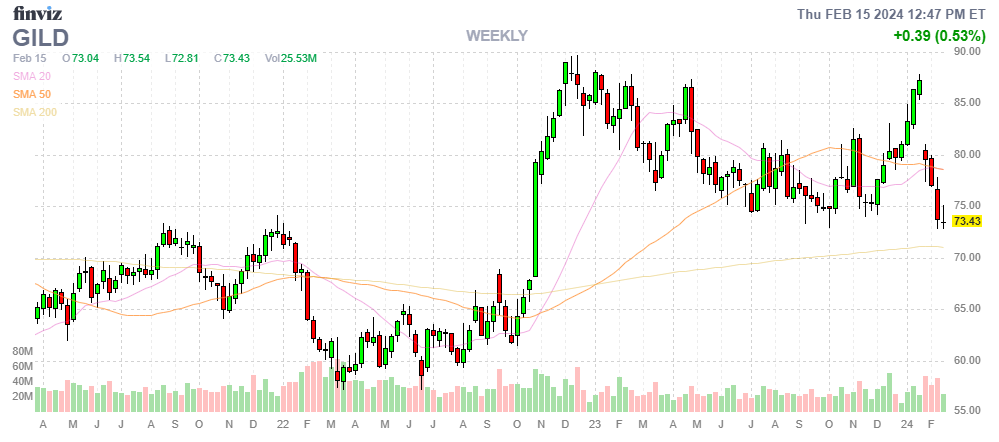
- GILD – Cheaper than where we started at a net $2,675 CREDIT on the $30,000 spread. I can only tell you how to make the money – the rest is up to you! Good thing I’m not a TA guy because that’s an ugly chart (guidance for 2024 was disappointing). We will roll out to 2026 but let’s make sure it’s a bottom first.
-
- GLW – How obvious was that with all the new phones coming out?
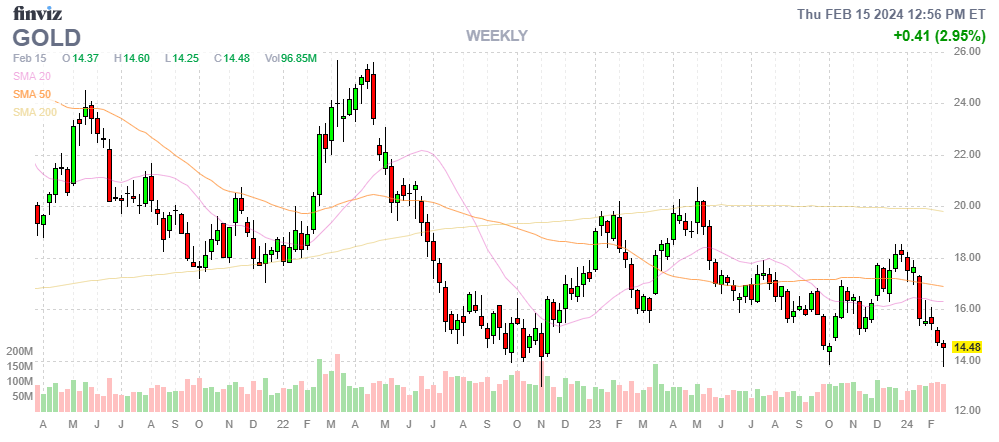
- GOLD – It really bothers me that no one else sees this. Maybe I’m crazy? We’re about even and, though they just announced in-line earnings, the outlook is not so great for 2024 but Barrick is buying back $1Bn (4%) of shares as they think $25Bn is too cheap as well. I have no problem rolling out to 2027, 2028, etc.
-
- IMAX – July will not be enough time and the Sept options are out now but I think if we wait a month or two we’ll see the Jans and then we’ll roll. Very little damage so far and blockbusters are tilted to the end of this year. Net $2,200 on the $8,000 spread!
- INTC – One of my true loves! Loving us back now after a rough couple of years. Our bull call spread is net $74,575 out of $120,000 so we can’t let that go just because we’re 98% in the money. Again, they are giving away free money at net $61,705.
-
- JD – Another Chinese stock we just added. Still good for a new trade.
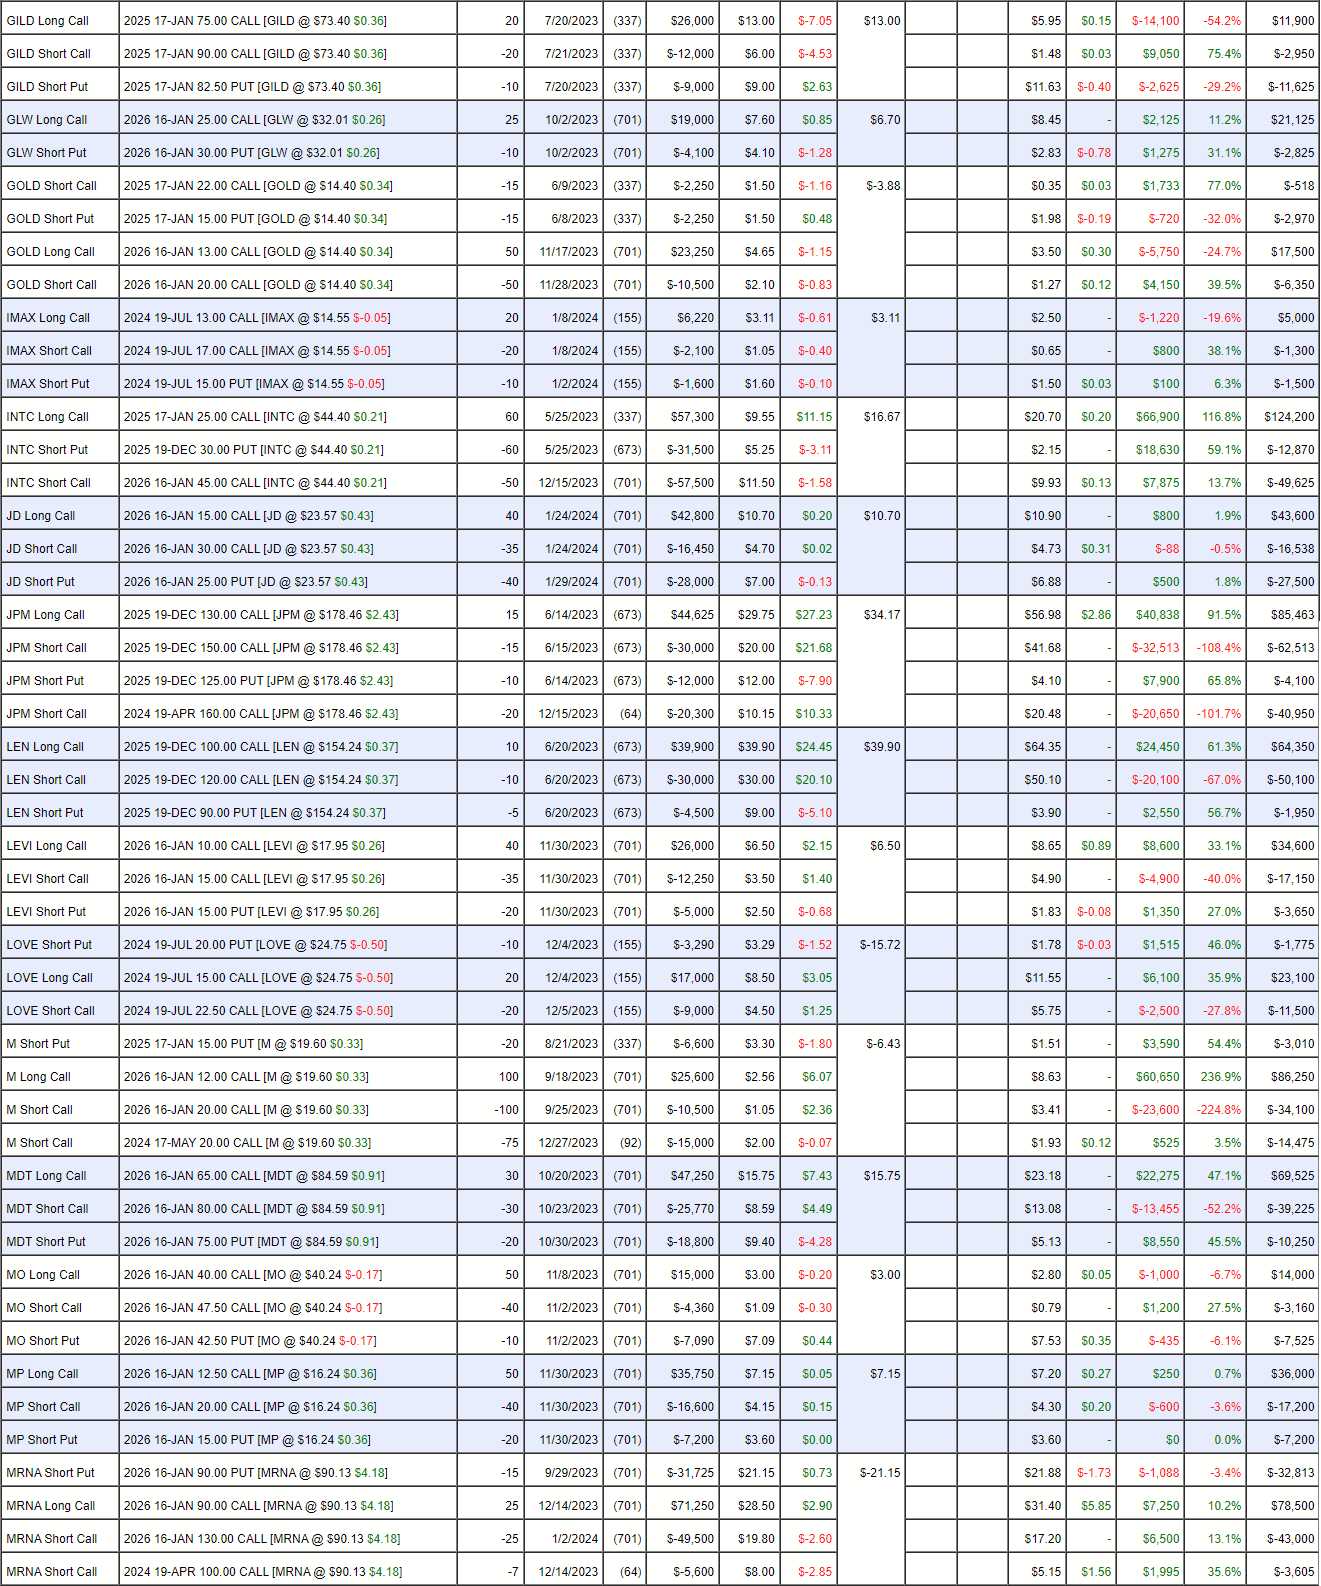
- JPM – We keep getting burned by the short calls. JPM is still cheap as this is only 11x their earnings ($517Bn market cap) so let’s cash out our 2025 $130 calls for $85,463 and buy 60 2026 $170 ($30)/200 ($15.50) bull call spreads at net $14.40 ($86,400) and we’re going to roll the 15 short Dec 2025 $150s at $41.68 ($62,513) and the 20 April $160 calls at $20.48 ($40,950) to 60 short Aug $180 calls at $11 ($66,000) and let’s sell 20 2026 $160 puts for $11.25 ($22,500) and buy back the Dec 2025 $125 puts for $4,100.
- We initially started with a net $17,675 credit and now we’re spending net $20,000 on the adjustment so we’re in the new $180,000 spread for net $2,325 – that’s not terrible, is it? To be clear, the new spread is 60 2026 $170/200 bull call spreads with 20 short 2026 $160 puts and 60 short Aug $180 calls. Nothing wrong with that!
- And that is what we call a Salvage Play!

-
- LEN – Another one that seemed very obvious at the time (there’s a housing shortage, LEN builds houses). We were too conservative and our $20,000 bull call spread is now $14,250 but it’s so far in the money it’s not worth selling – so we’ll wait.
- LEVI – Another boring way to make money. Net $13,800 on the $20,000+ spread isn’t worth closing but soooooooooooooo boring to make just $6,200 (44.9%) over two years, isn’t it?
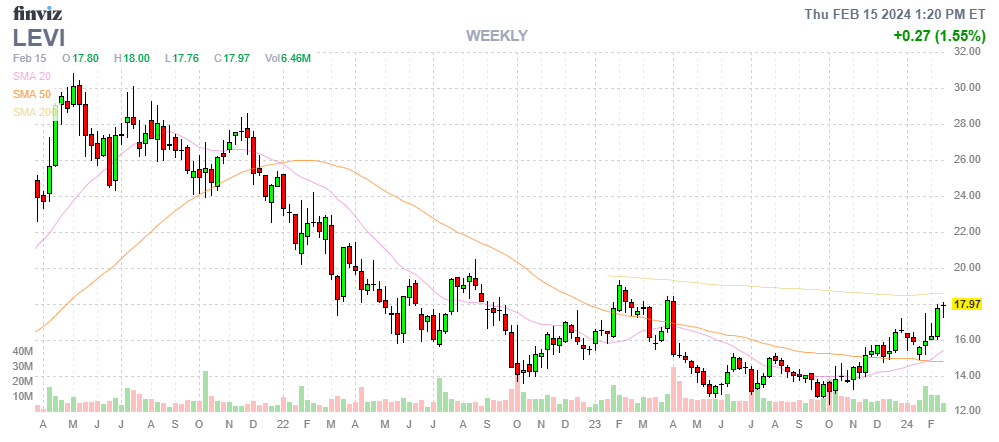
The good thing about trades like LEN and LEVI are that we don’t count them against our allocation blocks anymore (because they are very safely in the money) so we are free to pursue other trades in the portfolio but, when we run low on cash – then we have to consider that the money could be put to better use.
-
- LOVE – Another one I love and also well in the money (kind of a pattern?).
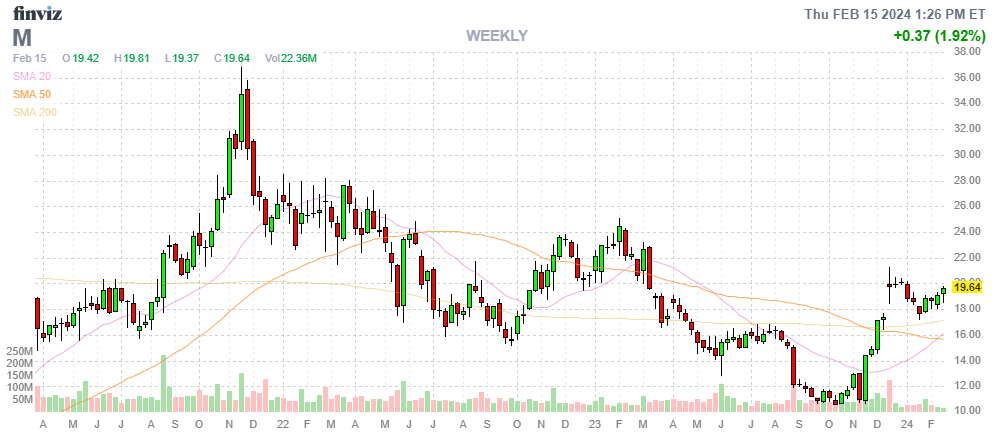
- M – Yep, all my favorite stocks that were dogs are now Gods… M is still an unworshipped God at net $34,665 on the $80,000 spread that is also producing fabulous income ($14,475 in the news 75 days). Free money is just being thrown around!
-
- MDT – Over our goal already and why shouldn’t they be. This was a no-brainer.
- MP – Still a sale on the only us producer of rare earth materials. Net $11,600 on the $37,500 spread that’s half in the money already.
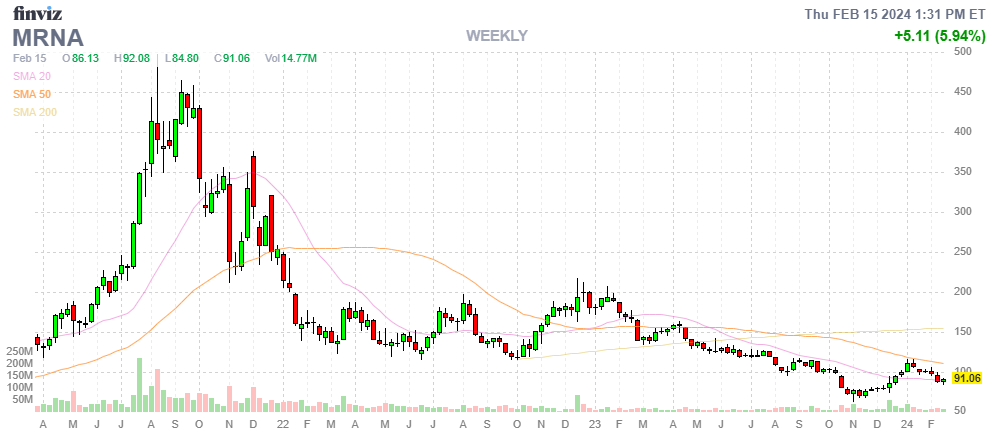
- MRNA – So unloved. A net $918 credit on the $100,000 spread with income potential as well. If they just hold $90, we win something and the upside is tremendous.
-
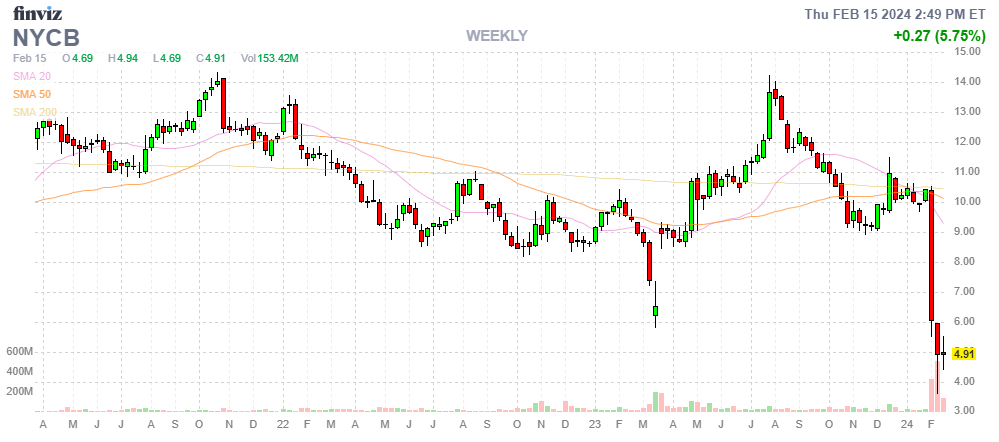
- NYCB – My new table-banger! It’s about break-even for us at the moment as it went lower after we bought it and we quickly doubled down. We’re aggressive on the short puts but it’s a net $3,050 CREDIT on the $70,000 spread that’s $18,900 in the money and, at $5, we’d have to give back $12,000 to the short $8 puts so this is about our break-even ($4.89) with $73,050 (2,395%) upside potential at $10. Don’t say I didn’t tell you about NYCB!
-
- PARA – Wow, there are so many great trades in this portfolio! Now it’s completely idiotic as they’ve had multiple offers to be bought for $20+ yet people STILL don’t believe the value. It’s a $40,000 spread at net $4,290 and $12.43 is $9,720 in the money and, if they do get bought, we make our full $35,710 (832%) faster than expected.
- PFE – Another giveaway! Here’s my investing premise: It’s Pfizer! They are already at $27.50 so our 160 calls are $5 ($80,000) in the money and we’re only partly covered at $32.50, which is another $80,000 higher than we are now and currently, this $160,000+ spread is at net $68,100 and, once again, it’s $80,000 in the money and we could take another $8,500 off the table by selling 50 June $27.50 calls for $1.70 and we still wouldn’t be fully covered bit PFE is so STUPIDLY low right now that I can’t bring myself to sell any more calls against them.

-
- PRU – Boring, too obvious – over our target. Still only net $14,550 on the $30,000 spread that’s 109% in the money already. We started at net $5,000 so already almost a triple with a double to go.
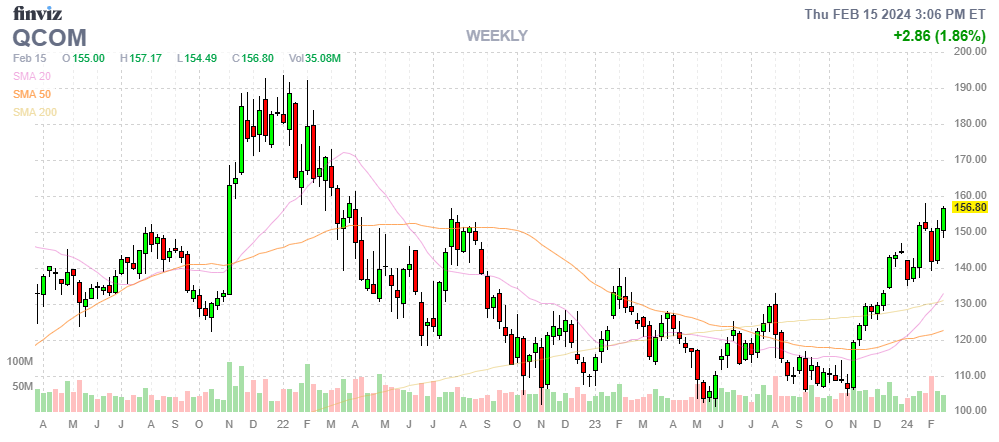
- QCOM – Last fall nobody wanted any of these stocks (we did). The short April calls are burning us at $17.88 but we sold them for $11 and our $90,000 spread is deep in the money so not going to worry about the 5 uncovered short calls simply because the short 2026 $160s are $27.23 and $27.23 is munch more than $17.88 so this will easily be resolved by rolling things along and we’ll get our full $90,000 and maybe more off the current net $32,332. Another triple and all you have to do is swing!
-
- SPWR – Just got a credit line but back to $4.26 (flat) for the day after testing $6 on the news. I think the news buyers were right but this one needs patience.
- SQ – Another “duh” stock that’s on track.
- TECK – Very nice for a recent addition.
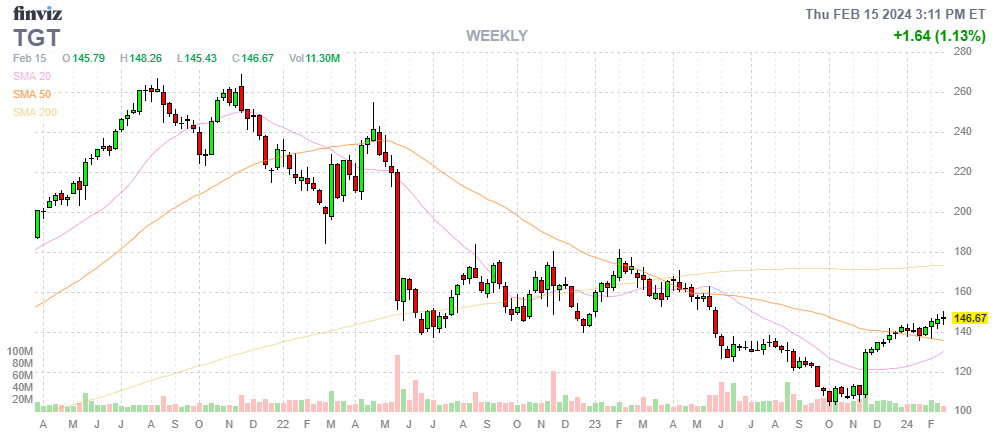
- TGT – $60,000 spread at net $14,050 so this one is a quad that’s on track. Too easy…
-
- TROX – A trade of the year runner up and you can see why (from November). Was $550, now $6,700 is up 1,000% but it’s a $20,000 spread so 200% more to go. It’s just raining money, isn’t it?
- UPS – I’ve heard of them! Cheaper than where we got in at net $12,950 on the $30,000 spread. Certainly not worried about this one and we do have room to sell short calls for income.
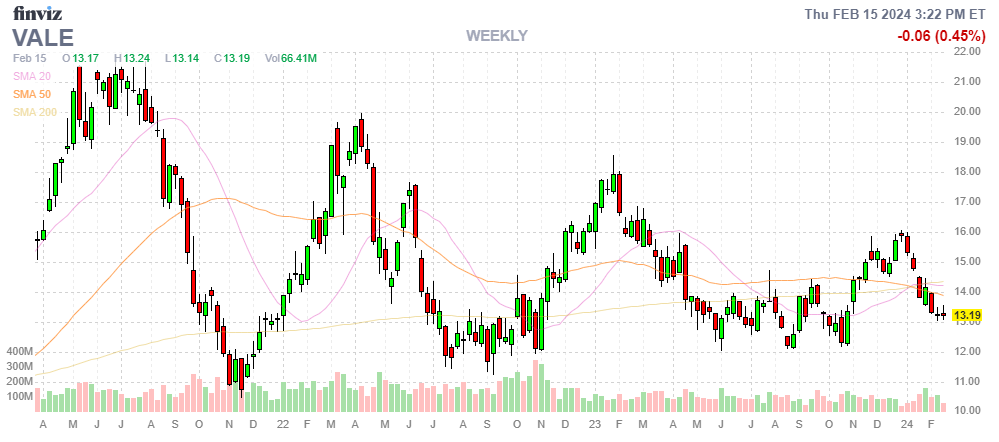
- VALE – Another trade of the year runner up and not doing well because they are 60% China and China does not look good. Still, it’s net $5,365 on the $37,500 spread that’s $23,625 in the money and I don’t mind owning 1,500 shares of VALE at $17 ($25,500) so there’s really no downside here and very nice upside potential.
-
- VFC – North face and other brands retailer we’re waiting for a pop to sell more short calls (we bought the original batch back already). The company is doing an internal overhaul but I’m trusting management to get it right.
- WHR – Who doesn’t love a nice washing machine? 50% in the money at net $17,700 on the $20,000 spread but we could sell 7 June $120 calls for $4.20 and that’s $2,940 (16.6%) for 127 days and we’re not even fully covered at $120 so let’s say it’s a potentially $25,000 spread with $20,000 income potential and that’s why I don’t feel like cashing it out.
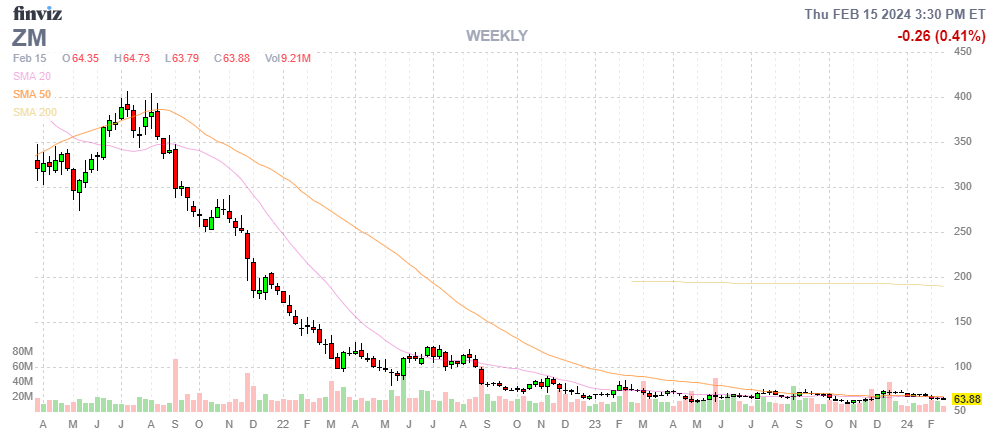
- ZM – They did not ease investors’ concerns on earnings (26th) but it’s only net $13,150 on the $30,000 spread so I’m willing to give them another quarter.
So there you go – too good to sell for the most part. Too good to cover even and we just bumped up the hedges in the STP so I’ll sleep well over the long weekend and all the way into next month with this group!


 of the S&P 500 Worth $21.5Tn Are Reporting!")