
V for victory!
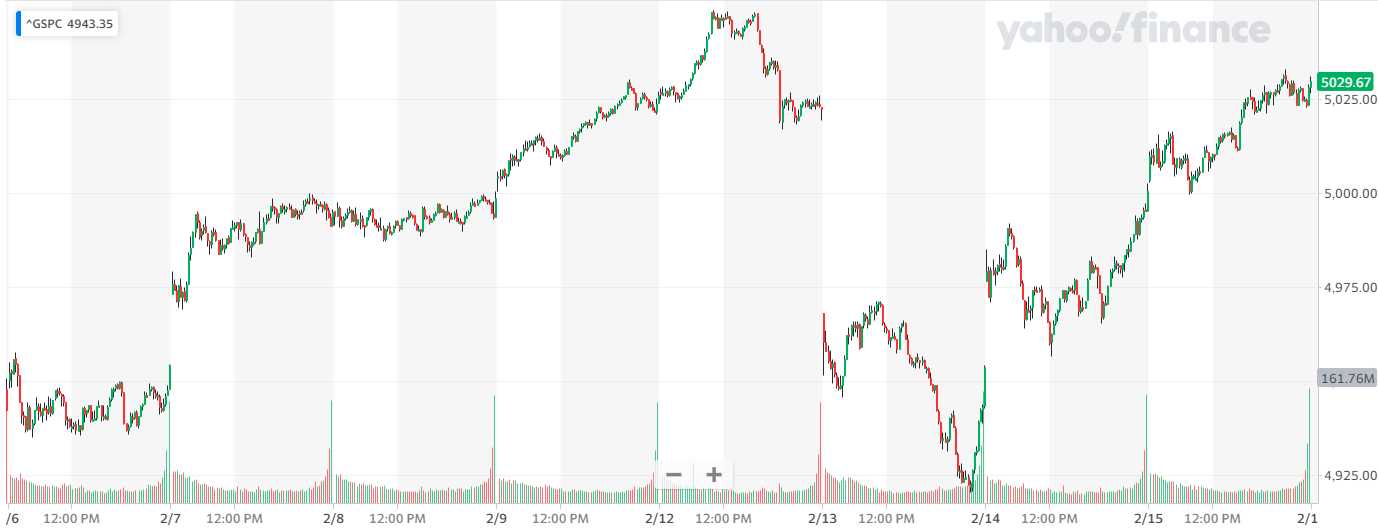
It took two days but we got the V-shaped recovery I predicted in Wednesday’s “V-Shaped Valentine’s Day Recovery” and I don’t know if you appreciate how brave it is for a person who makes their living predicting the markets to actually put very clear predictions like that in black and white. Go ahead, check everyone else’s work and see how many analysts are willing to make definitive statements…
The key to being right most of the time is not making predictions unless you are sure (this is the premise to our Top Trade Alerts, which have an 80% success rate). Being sure means you have to try to pull apart your own premise and fail to be able to do so – if you can’t think of anything that can go wrong – that’s how you get past 66% success.
 Take our Wednesday morning Oil trade for our Members at 9:59, when I said:
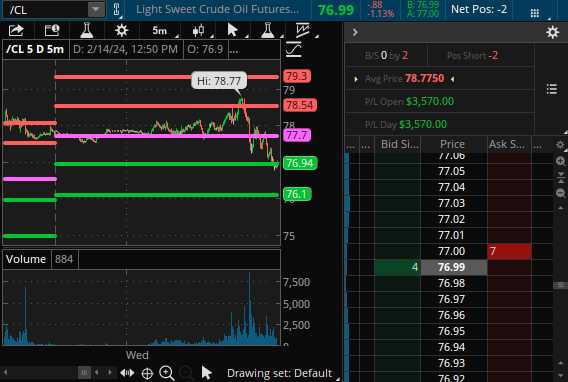
Today we just have Mortgage Applications (down 2.3%) and oil inventories, of course. API was a net draw and that has pushed /CL up to $78.77 where I’m going to call it a short with tight stops over $79 but I think it will be hard for EIA to be as kind. API was:
-
- Crude +8.52 million (exp. +2.6 million)
- Gasoline -7.23 million
- Distillates -4.016 million
And just like that we made $1,780 per contract in a few hours. We rarely trade Oil these days because we’re usually not sure (we used to trade it all the time but conditions are too wild at the moment) but Wednesday we were sure. We were also sure the week before and took a $100 loss but that’s also the key to good trading – limit your losses and let your winners run!
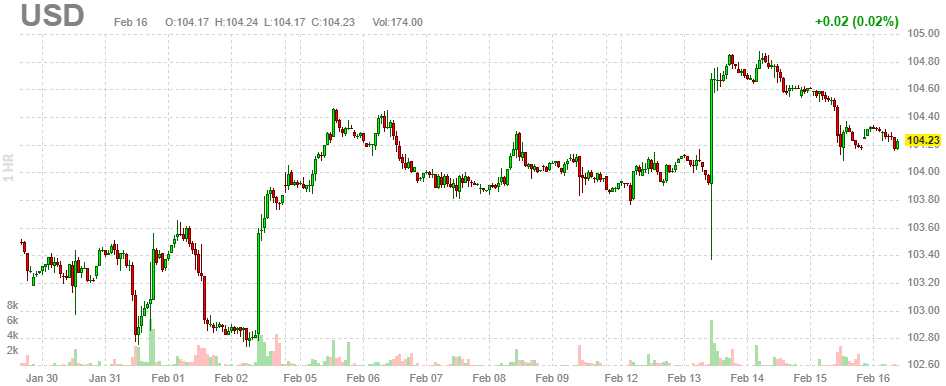 So, getting back to Wednesday morning, we could see that the primary reason for the drop was NOT so much the inflation news or confirmation that the Fed would take even longer before lowering rates – that ship sailed in January – it was the Dollar blasting up that caused the market to drop (confirmed by lack of strong S&P volume on Tuesday’s drop), by simply causing an equity re-price and, now that the Dollar has calmed down – the market has recovered.
Seeing the S&P drop like that with no real signs of panic is a very bullish signal. As I said to our Members, I think AI productivity increases are putting us only at the beginning of a multi-year run in the markets but it will be messy and disruptive as millions will lose jobs with all this “efficiency” going around. As Warren noted on Wednesday morning – we’re already seeing a lot of positive signs in the economy, with positive economic surprises soaring since December as leading Economorons are firmly behind the curve.
It’s 8am now and we get the Producer Price Index at 8:30 which is forecast to be up 0.1% and we’ll see if that is also way higher than expected – as CPI was on Tuesday. We also have Consumer Sentiment at 10 – that’s important too!
The PPI is different from the CPI, which measures the changes in the price of goods and services paid by consumers. The PPI measures inflation from the perspective of the product manufacturer or service supplier, while the CPI measures inflation from the perspective of the consumer.
The PPI is calculated by the U.S. Bureau of Labor Statistics (BLS) based on approximately 100,000 monthly price quotes reported voluntarily online by more than 25,000 systematically sampled producer establishments. The PPI covers the entirety of the U.S. output of goods and about 69% by value of services and its component product and services indexes are weighted based on the value of the category’s output to calculate the overall change in producer prices.
So this brings us to the other reason I expected a V-shaped recovery for the week and I will go out on a limb again and say the PPI Report, unlike the CPI Report should not be hotter than expected BECAUSE CPI was boosted by Food and Rent – which are NOT components of PPI and Energy Costs, which make up 5% of the PPI were fairly flat in January with Natural Gas substantially cheaper.
And then we get back to the Dollar, which finished January strong and that drove down the input costs of goods and materials from overseas, benefitting manufacturers in a way it did not help the Consumers.
8:30 Update: Wow was I wrong! PPI is up 0.3% for January and Core PPI is up an astounding 0.5% from down 0.1% in December – this is so bad the Fed should be RAISING rates at the next meeting. Capital Equipment was up 0.6% and Service Costs are up 0.5% but it was food that killed us – Processed Foods and Feeds, which I did not think of, are up 1.6% and that was the killer. Final Demand Trade Services were also up 1.1% – the largest increase since April of 2020 and a lot of that category is online shopping and delivery services.
Pharmaceutical Preparations rose 1.4% – the most since July of 2019 and Final Demand Goods Less Foods and Energy was up 0.7% – the most since October or 2018. Inflation isn’t dead, it’s thriving!
Hopefully the market won’t be as shocked as it was on Tuesday but this is a serious set of numbers and we should be cautious into the weekend. Fortunately, we are nicely hedged (see the Portfolio Reviews) and we just passed Tuesday’s test with flying colors but, over the weekend, we’re going to hear talks of more Fed hikes – and that can really freak the traders out!
Have a great weekend (Monday is a holiday!),
-
- Phil


