

By Julia Wendling, Graphics & Design by Athul Alexander, Visual Capitalist
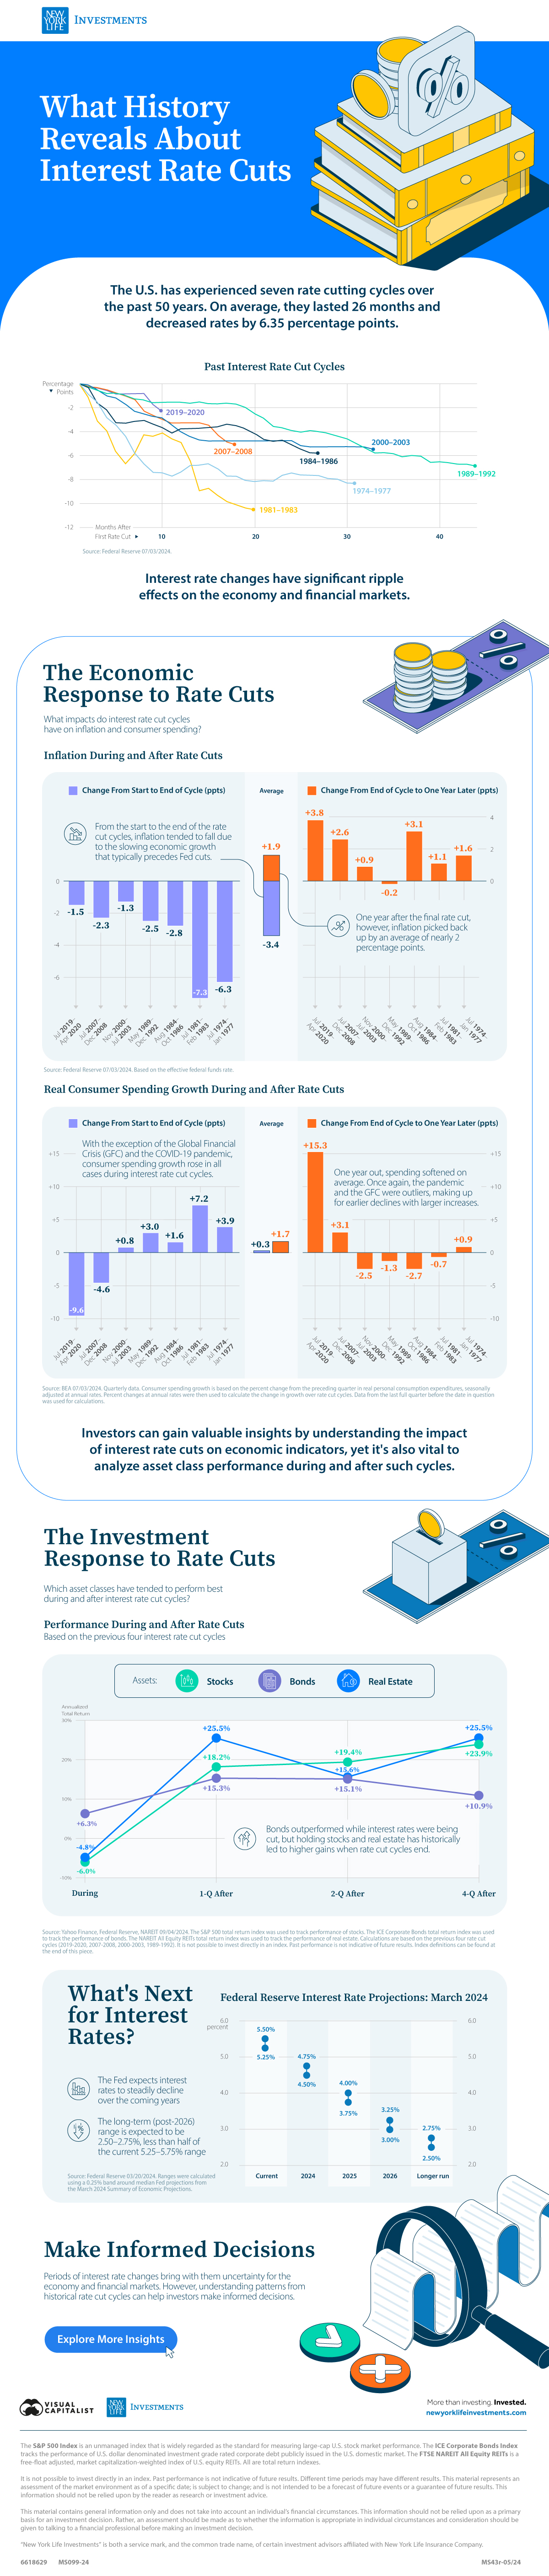
What History Reveals About Interest Rate Cuts
The Federal Reserve has overseen seven cycles of interest rate cuts, averaging 26 months and 6.35 percentage points (ppts) each.
We’ve partnered with New York Life Investments to examine the impact of interest rate cut cycles on the economy and on the performance of financial assets in the U.S. to help keep investors informed.
A Brief History of Interest Rate Cuts
Interest rates are a powerful tool that the central bank can use to spur economic activity.
Typically, when the economy experiences a slowdown or a recession, the Federal Reserve will respond by cutting interest rates. As a result, each of the previous seven rate cut cycles—shown in the table below—occurred during or around U.S. recessions, according to data from the Federal Reserve.

Understanding past economic and financial impacts of interest rate cuts can help investors prepare for future monetary policy changes.
The Economic Response: Inflation
During past cycles, data from the Federal Reserve, shows that, on average, the inflation rate continued to decline throughout (-3.4 percentage points), largely due to the lagged effects of a slower economy that normally precedes interest rate declines.