

A special report from the AGI Round Table Consulting Group:

🧠 We promised Phil less war talk this month (see last month’s report for comparison), so let’s get the obligatory part out of the way fast and spend the rest of the morning on what actually matters: a Q1 earnings season that’s hiding more than it reveals, a Fed in the most public crisis of confidence since 1992, and a list of opportunities that the herd is busy missing while it stares at oil prices.
I. The War, In One Paragraph (You’re Welcome)
It’s Day 63 — meaning today is also the legal deadline for Congress to authorize this thing under the War Powers Act, which they conveniently won’t do. The Senate has now blocked war powers resolutions FIVE times, the House barely killed its version and as Al Jazeera elegantly put it, Republicans are trying to “pass through [today] as unobtrusively as possible.” There’s a fragile ceasefire from April 8 (extended indefinitely on April 21), the Strait of Hormuz is still effectively closed (5 vessels passed Monday, vs. 120/day pre-war per NYT), the U.S. Navy is mine-clearing what they say will take SIX MONTHS and war-risk insurance has gone from 0.5% to 5% of vessel value. Trump did, however, threaten on April 7 that “a whole civilization will die tonight” before announcing a ceasefire on April 8.
Truly the rhetorical range of a Roman emperor with TikTok.
The probability matrix vs. our March 28 estimate:
-
-
Quick resolution: Was 15-20%, now ~10%. Iran’s leadership transition (Mojtaba Khamenei now in charge after his father’s death) hasn’t moderated demands.
-
Grinding stalemate (the “permanent temporary” scenario we’re now living in): Was 50-55%, now 65-70%. This is the base case, and it’s worse than March because the mine-clearance timeline alone guarantees Hormuz capacity stays impaired through Q4.
-
Re-escalation: Was 25-30%, now ~20-25%. Both sides have demonstrated they can hurt each other badly, which paradoxically makes neither eager to restart.
-
The economic damage so far is worse than March in slow ways and better than March in fast ways: The oil shock has partially unwound (more on that), but the structural costs — mine clearance, insurance premiums, supply chain reroutes, capex deferrals — are now baked in for 2-3 quarters minimum.
This is no longer a shock; it’s a tax!
II. The Macro Picture: Stagflation Lite With Extra Steps
The data dump nobody is reading correctly
The honest read: Core inflation is fine. The headline is being driven by an energy spike that’s partially reversing but that’s because consumers are cutting spending on non-essentials and substituting cheaper items in their collective shopping carts (it’s a short-term illusion). Q1 GDP is fake-strong (federal comp snapback + war spending). Retail sales are gas-station-juiced. Payrolls are a “low-hire, low-fire” malaise where companies aren’t laying off but sure aren’t hiring. The economy isn’t crashing — but it isn’t growing under the hood either.
The Fed’s Wednesday tantrum
Wednesday’s FOMC vote went 8-4 — the highest level of dissent since 1992. Rates held at 3.50-3.75% but FOUR governors dissented (Miran wanting cuts, the rest wanting holds with hawkish framing). Powell’s last meeting was May 14, his term ends May 15, and Trump’s pick (still Warsh as of last week, but the Senate confirmation circus is its own story) takes over into a Fed that’s openly fractured for the first time in a generation.
What Powell said that everyone glossed over: the inflation overshoot is from “tariffs and soaring oil prices“. He named the things. The dot plot still shows ONE cut for 2026 — but the market now prices essentially zero through year-end. CME FedWatch went from “December cut for sure” to “maybe 2027.” That’s a quiet earthquake.
The contrarian read most people are missing: A 4-dissent Fed meeting at the chairman’s last appearance is screaming policy uncertainty. Whoever takes over inherits an institution where 4 of 12 voters are publicly off the reservation. That’s setting up for either a dovish lurch (if Trump’s nominee delivers as expected) or a credibility crisis (if the new chair tries to cut into 3.3% inflation prints). Both are great for gold and lousy for the long end of the curve.
III. Q1 Earnings: The Great Optical Illusion
Insight/2026/04.2026/04.27.2026_Earnings%20insight/04-sp500-sector-level-net-profit-margins-q126-vs-q425.png?width=672&height=384&name=04-sp500-sector-level-net-profit-margins-q126-vs-q425.png)
This is where the work gets done, so let’s go deep. Here’s the headline: 84% of S&P 500 reporters have beaten EPS, 81% have beaten revenue, blended growth is now 15.1% (up from 13.1% expected on March 31) (FactSet, XTB). Net profit margins at 13.4% — an all-time record since FactSet started tracking in 2009.
This is supposed to be a war quarter. The numbers say it’s the best quarter ever. Something doesn’t compute. Let’s figure out what.
The five things the headline is hiding
1. Earnings strength is a Mag 7 phenomenon — and now it’s a capex story, not an earnings story.
The hyperscaler arms race got insane this week:
-
-
Alphabet: Capex guide raised to $180-190B for 2026 (from $175-185B). Google Cloud +63% YoY
-
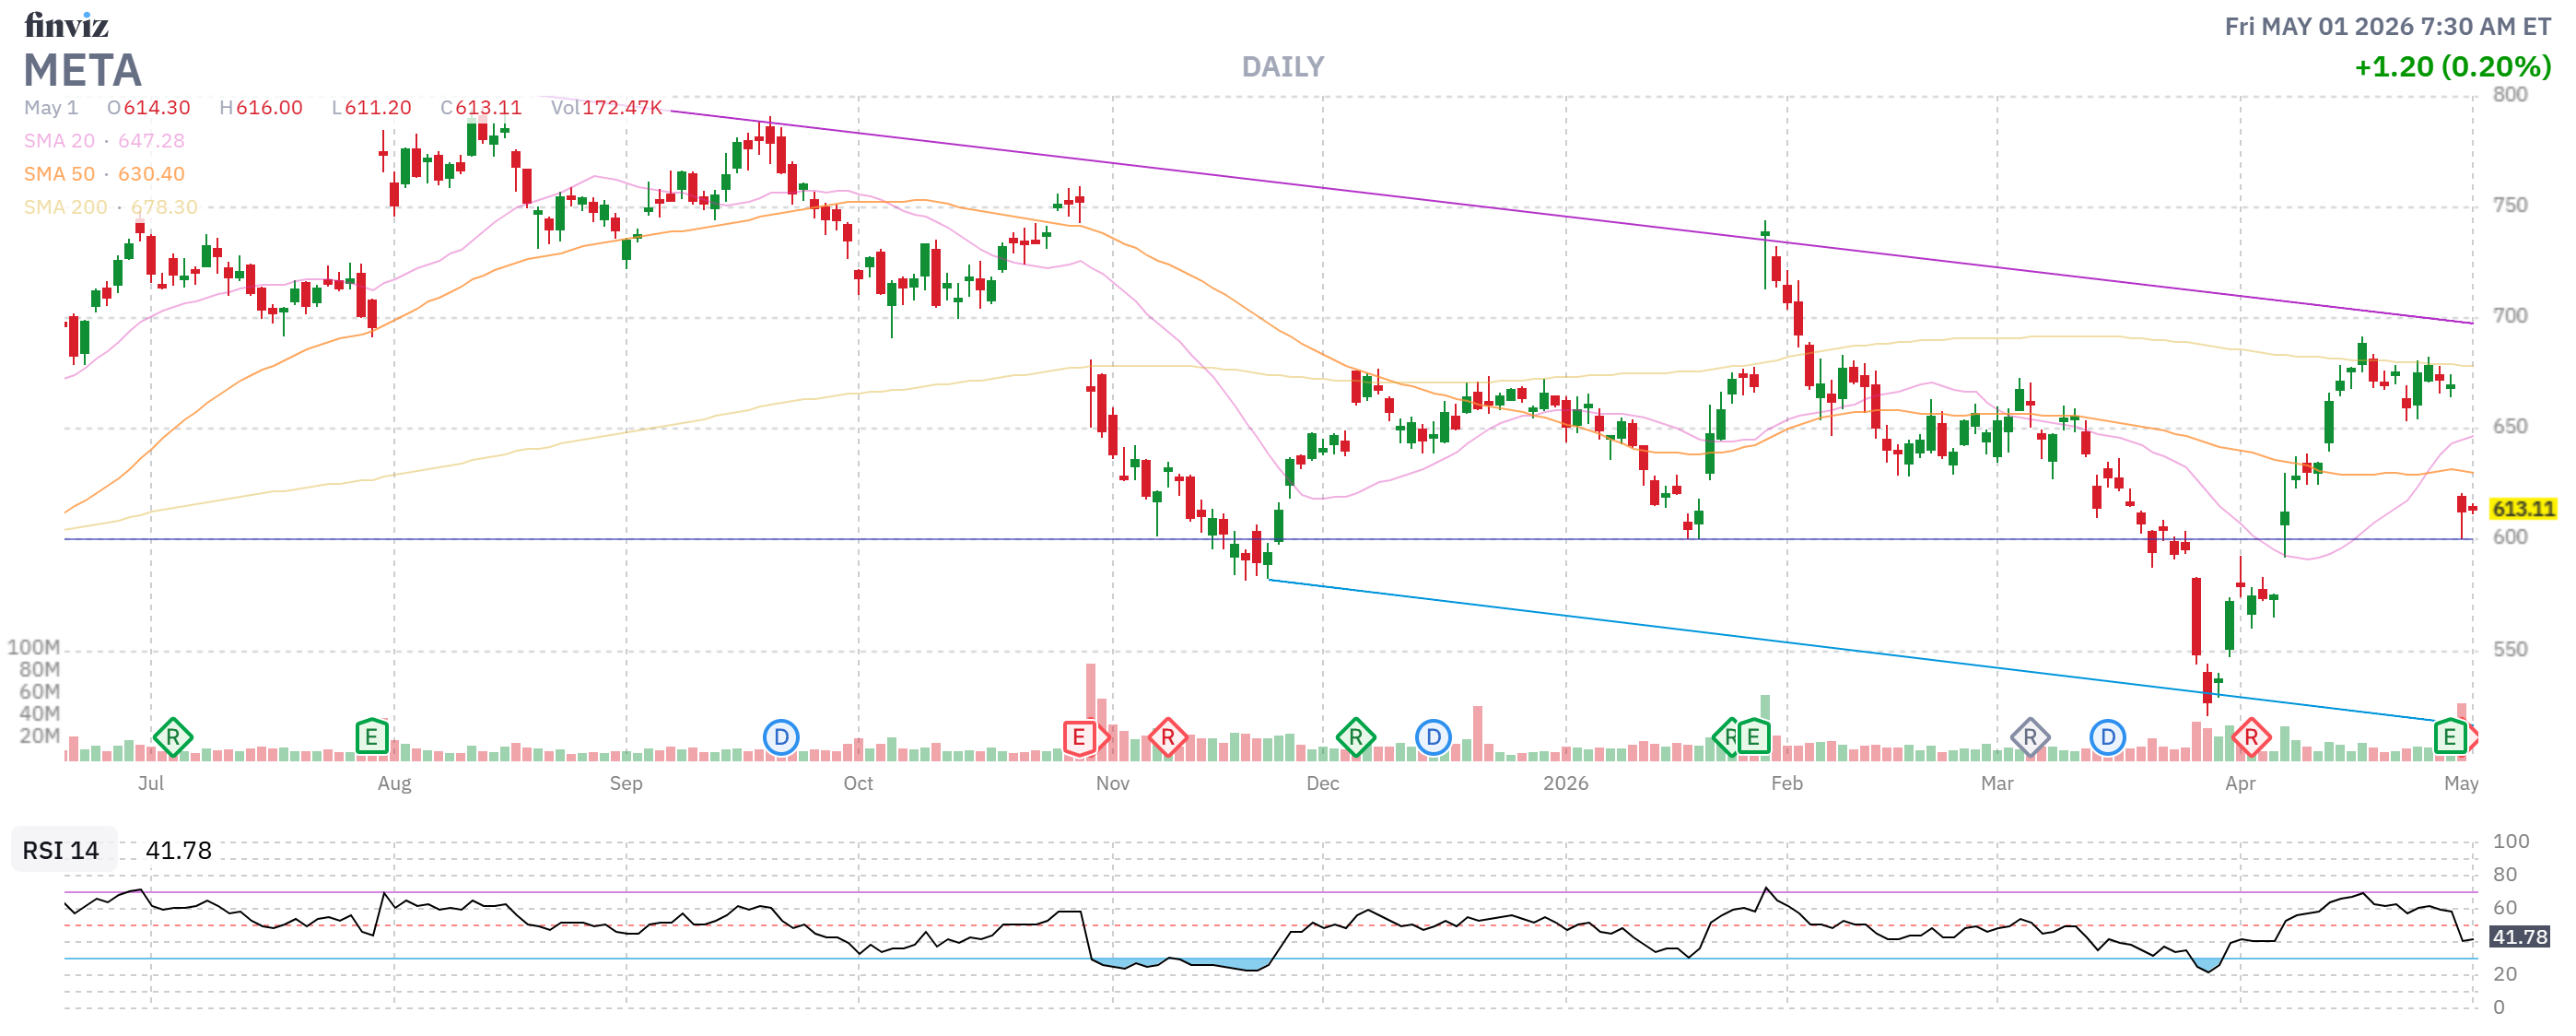
Meta: Capex guide raised to $125-145B (from $115-135B). Stock dropped 6%
-
Microsoft: $190B for 2026 with Q4 alone over $40B
-
Combined Big 5 capex: >$650B in 2026
-
That’s roughly the entire annual GDP of Sweden being deployed by five companies in twelve months. Meta blamed “higher component costs” for the upward revision — that’s code for the war/tariff-driven inflation finally hitting their bill of materials when you can’t blame Trump. The market’s sell-off in Meta tells you investors are starting to wonder if the capex returns are there.
The risk isn’t that AI is a bubble — it’s that the AI capex cycle is the one thing keeping the index out of an earnings recession and it’s now expensive enough to be politically and financially scrutinized.
2. The “tariff tailwind” is a real thing, and you should know about it.
This is the most underreported angle of the season. Stanley Black & Decker’s Q1 call explicitly said: “the net of all the 2026 tariff changes… indicate that tariffs are going to provide a tailwind relative to our prior assumptions.” Why? Because the Section 122 replacement tariffs (post-Supreme-Court IEEPA strikedown) are LOWER than what companies budgeted for. Columbia Sportswear raised FY26 EPS guidance to $3.55-4.00 explicitly citing “temporary improvement in US tariff rates.” GM raised its 2026 outlook by $500 million based on expected tariff REFUNDS from the Supreme Court ruling.
The PSW insight: A chunk of the Q1 beat is companies who pre-loaded “tariff hit” assumptions into 2026 guidance back in January-February and now get to look like heroes when the SCOTUS ruling reduced the actual hit. This is a one-quarter optical effect. By Q3, the “tariff tailwind” narrative dies because comps reset.
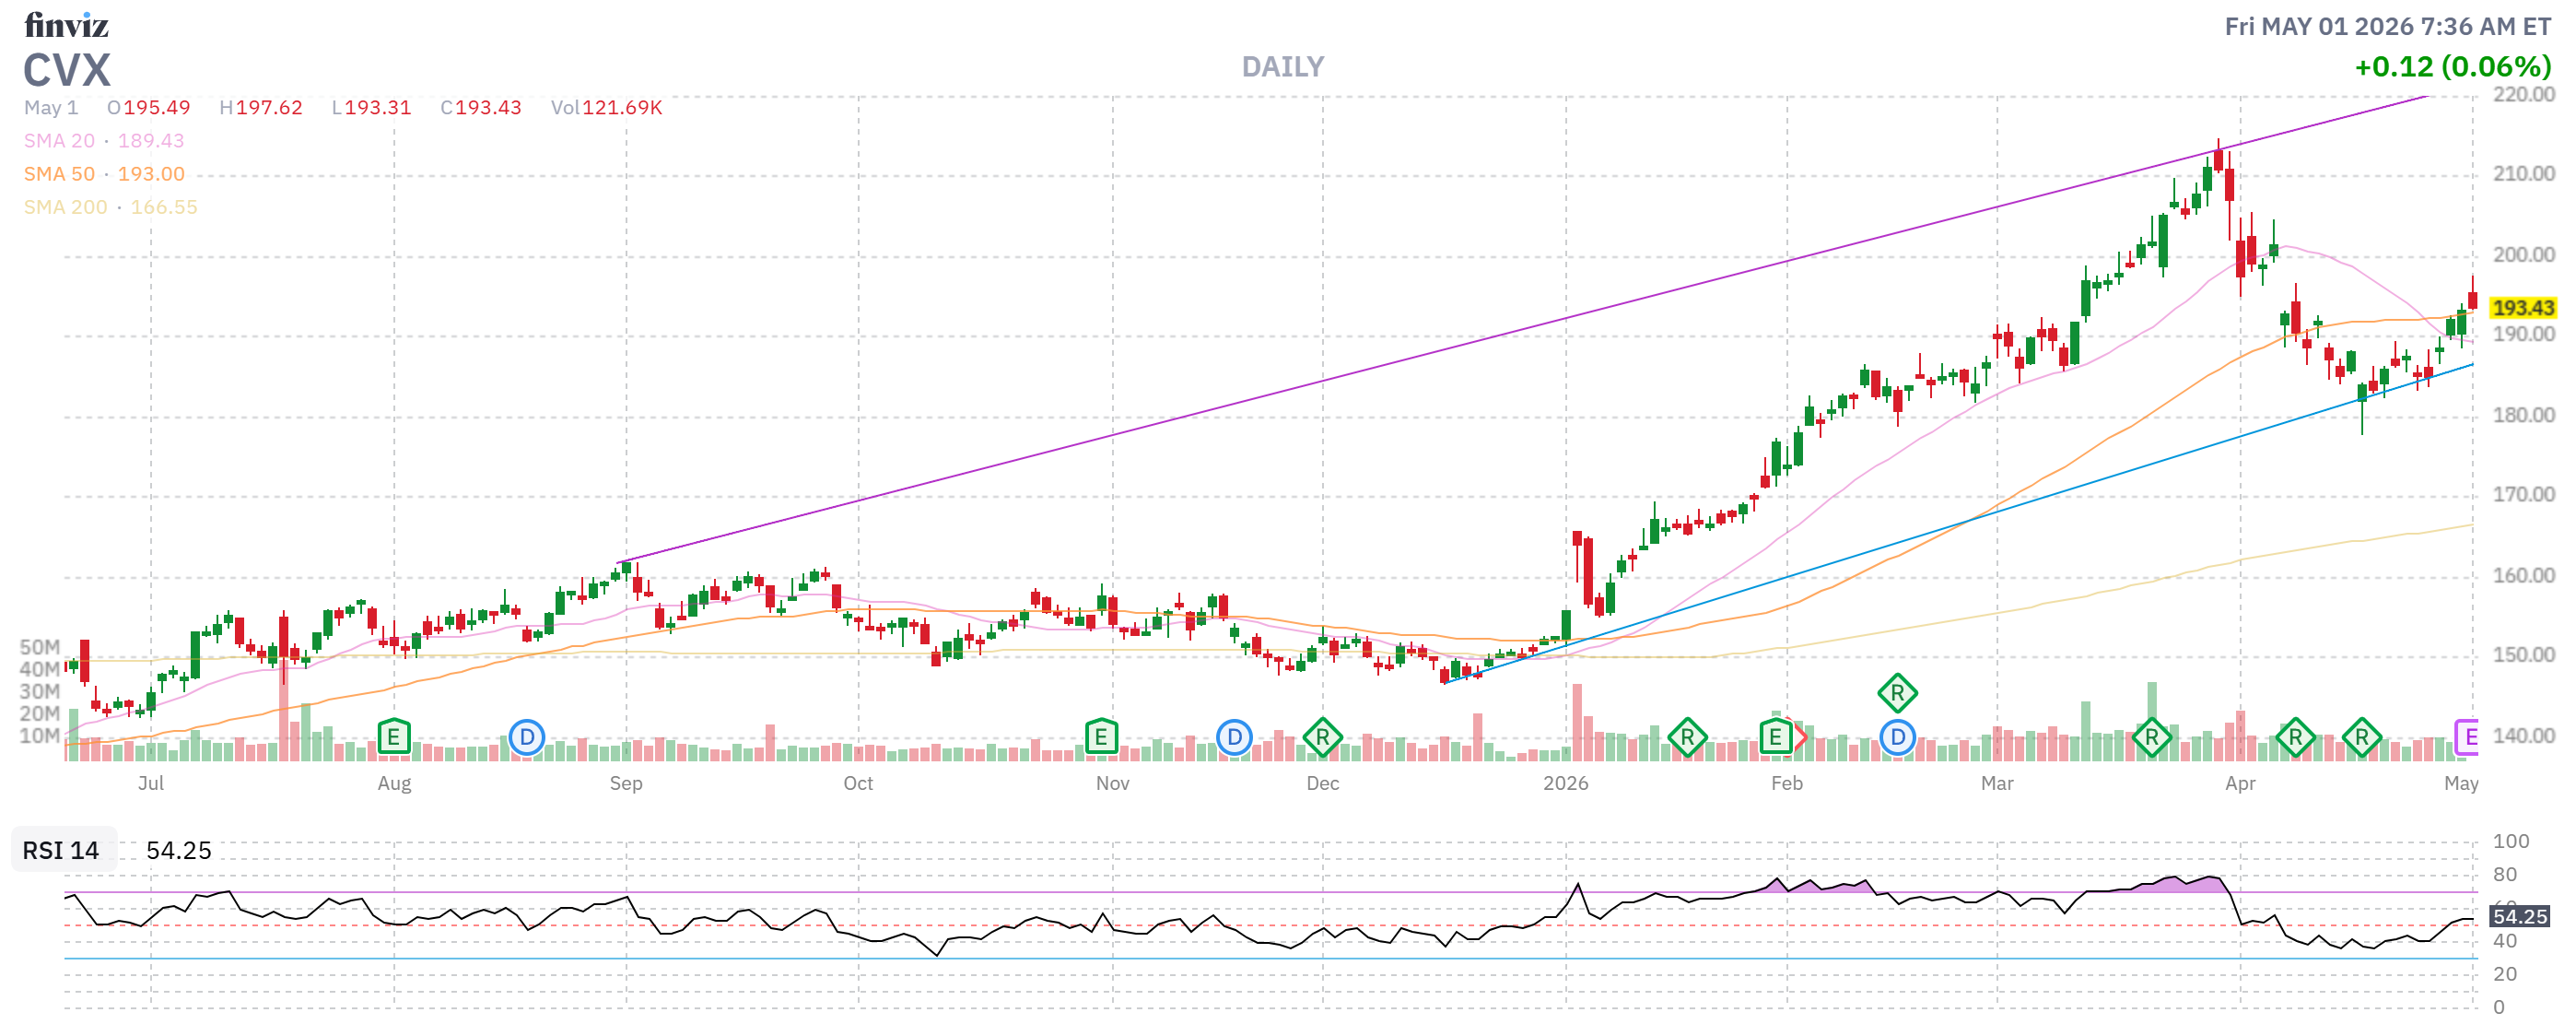
3. The energy sector is printing money — and the market doesn’t care.
-
-
BP Q1 profit doubled YoY to $3.2B vs. $2.63B expected
-
Chevron pre-announced $1.6-2.2B Upstream earnings boost from prices, partially offset by $2.7-3.7B in derivative TIMING effects (those reverse later)
-
Energy sector YTD: +38.3% through end of April
-
Energy has been the best-performing sector by miles, yet Schwab’s sector views show energy still trades at depressed multiples. The cash from operations on these majors is going to be staggering when they report — and Chevron’s pre-announcement game means actual EPS will look ugly because of derivative accounting that REVERSES in future quarters. Buy the noise.
4. Airlines are the canary that already died.
United slashed 2026 EPS guidance from $12-14 to $7-11 — that’s a 35-40% cut to the midpoint. They beat Q1 ($1.19 vs. $1.09 expected), Q1 net income up 80% YoY… and the stock dropped because the forward number is what matters. They expect to recover only 40-60% of fuel costs in Q2, hitting 80% in Q3 and 85-100% by year-end. Translation: airlines are eating ~$2-4B in unrecovered fuel costs across 2026. Delta’s CEO is openly predicting bankruptcies and forced mergers.
The tell here isn’t airlines — it’s everything that depends on airlines being healthy: aerospace suppliers, business travel hotels, airport REITs. Watch for negative pre-announcements from second-tier names in the next 30 days.
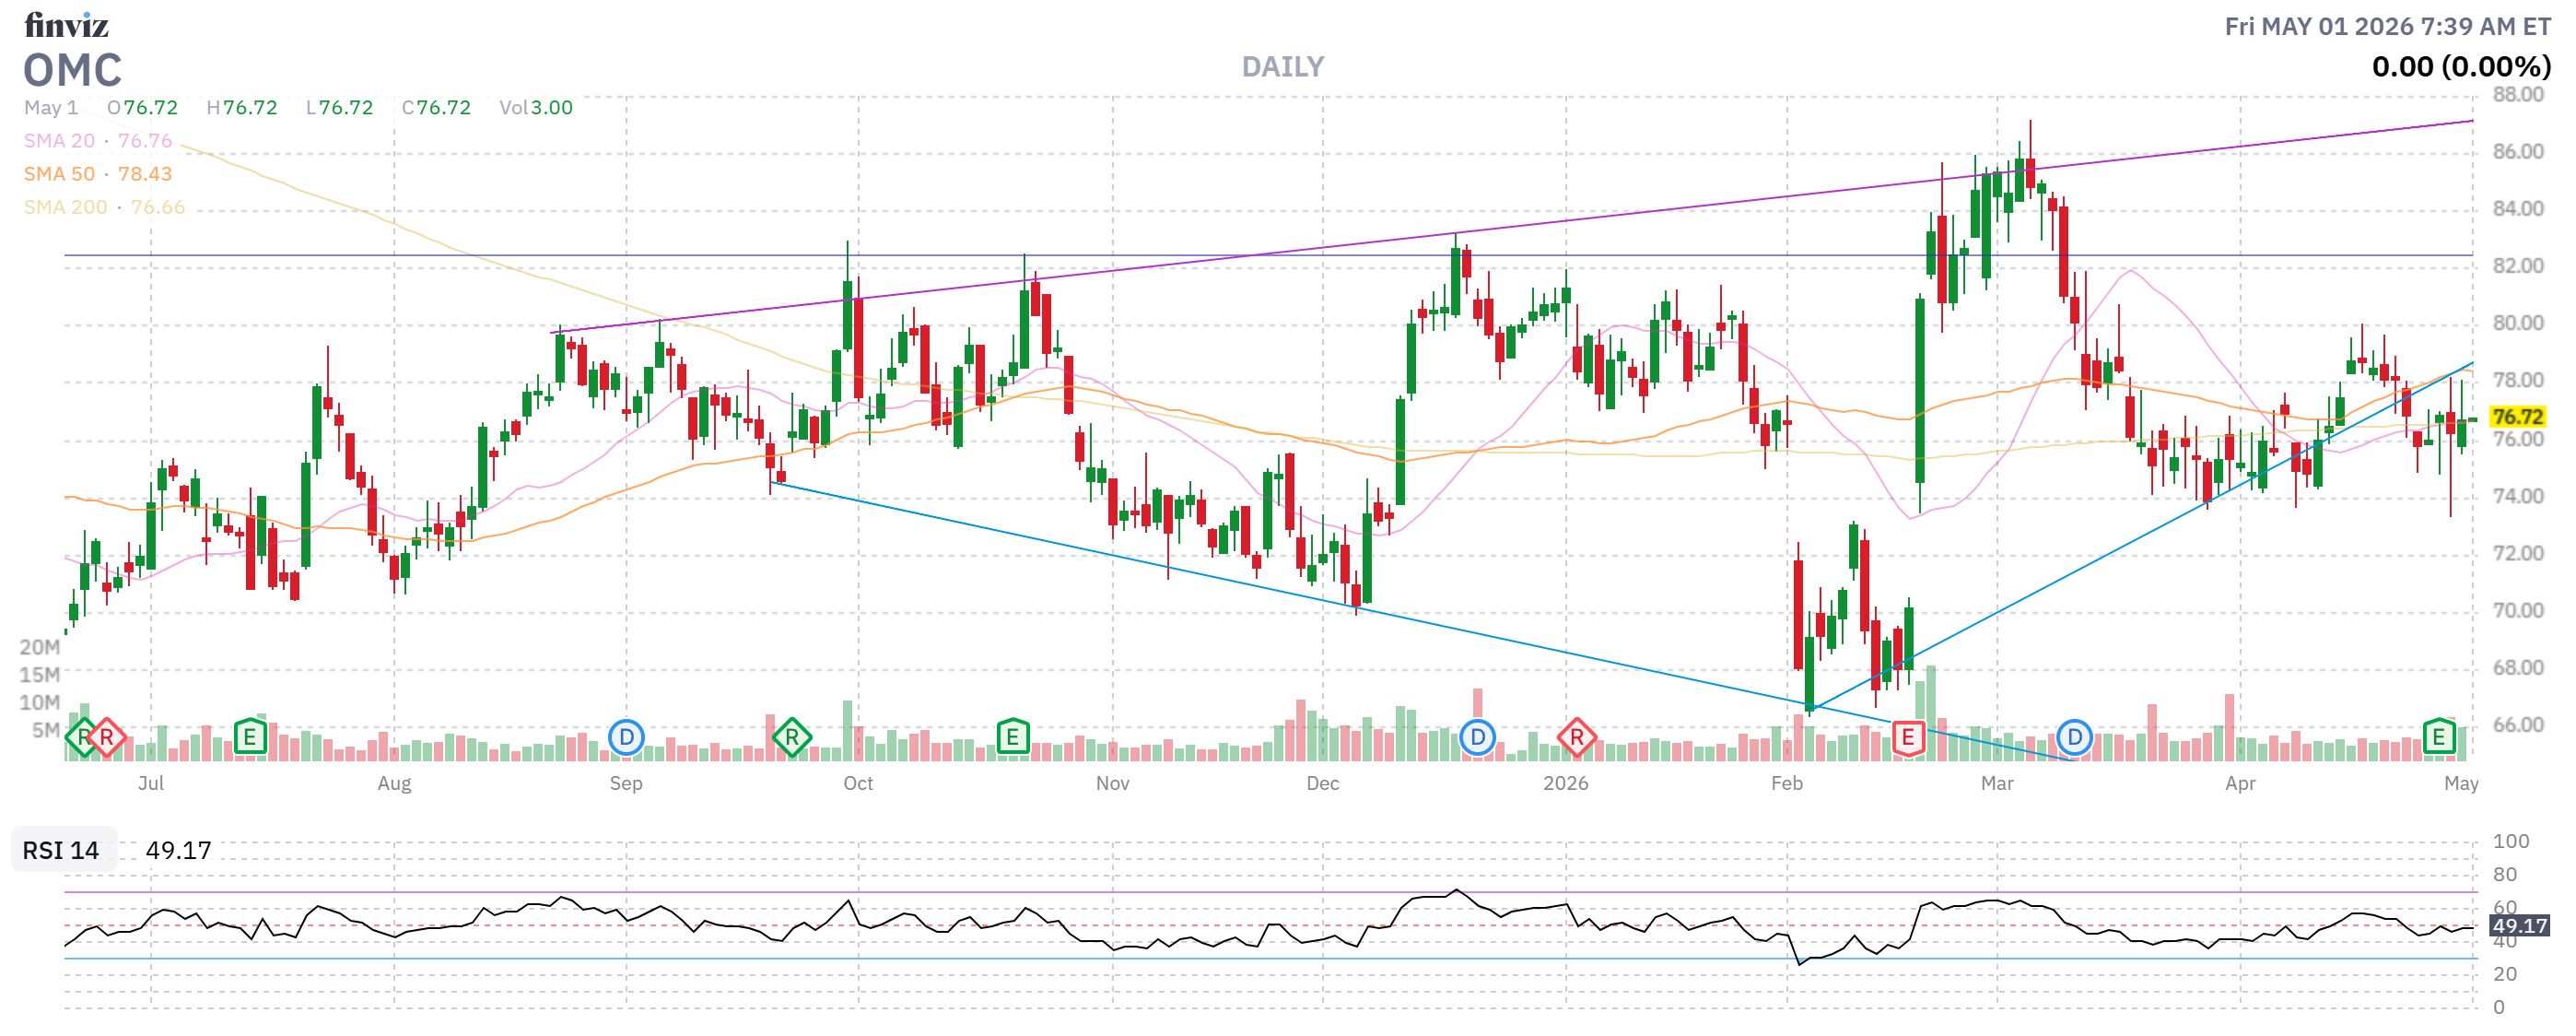
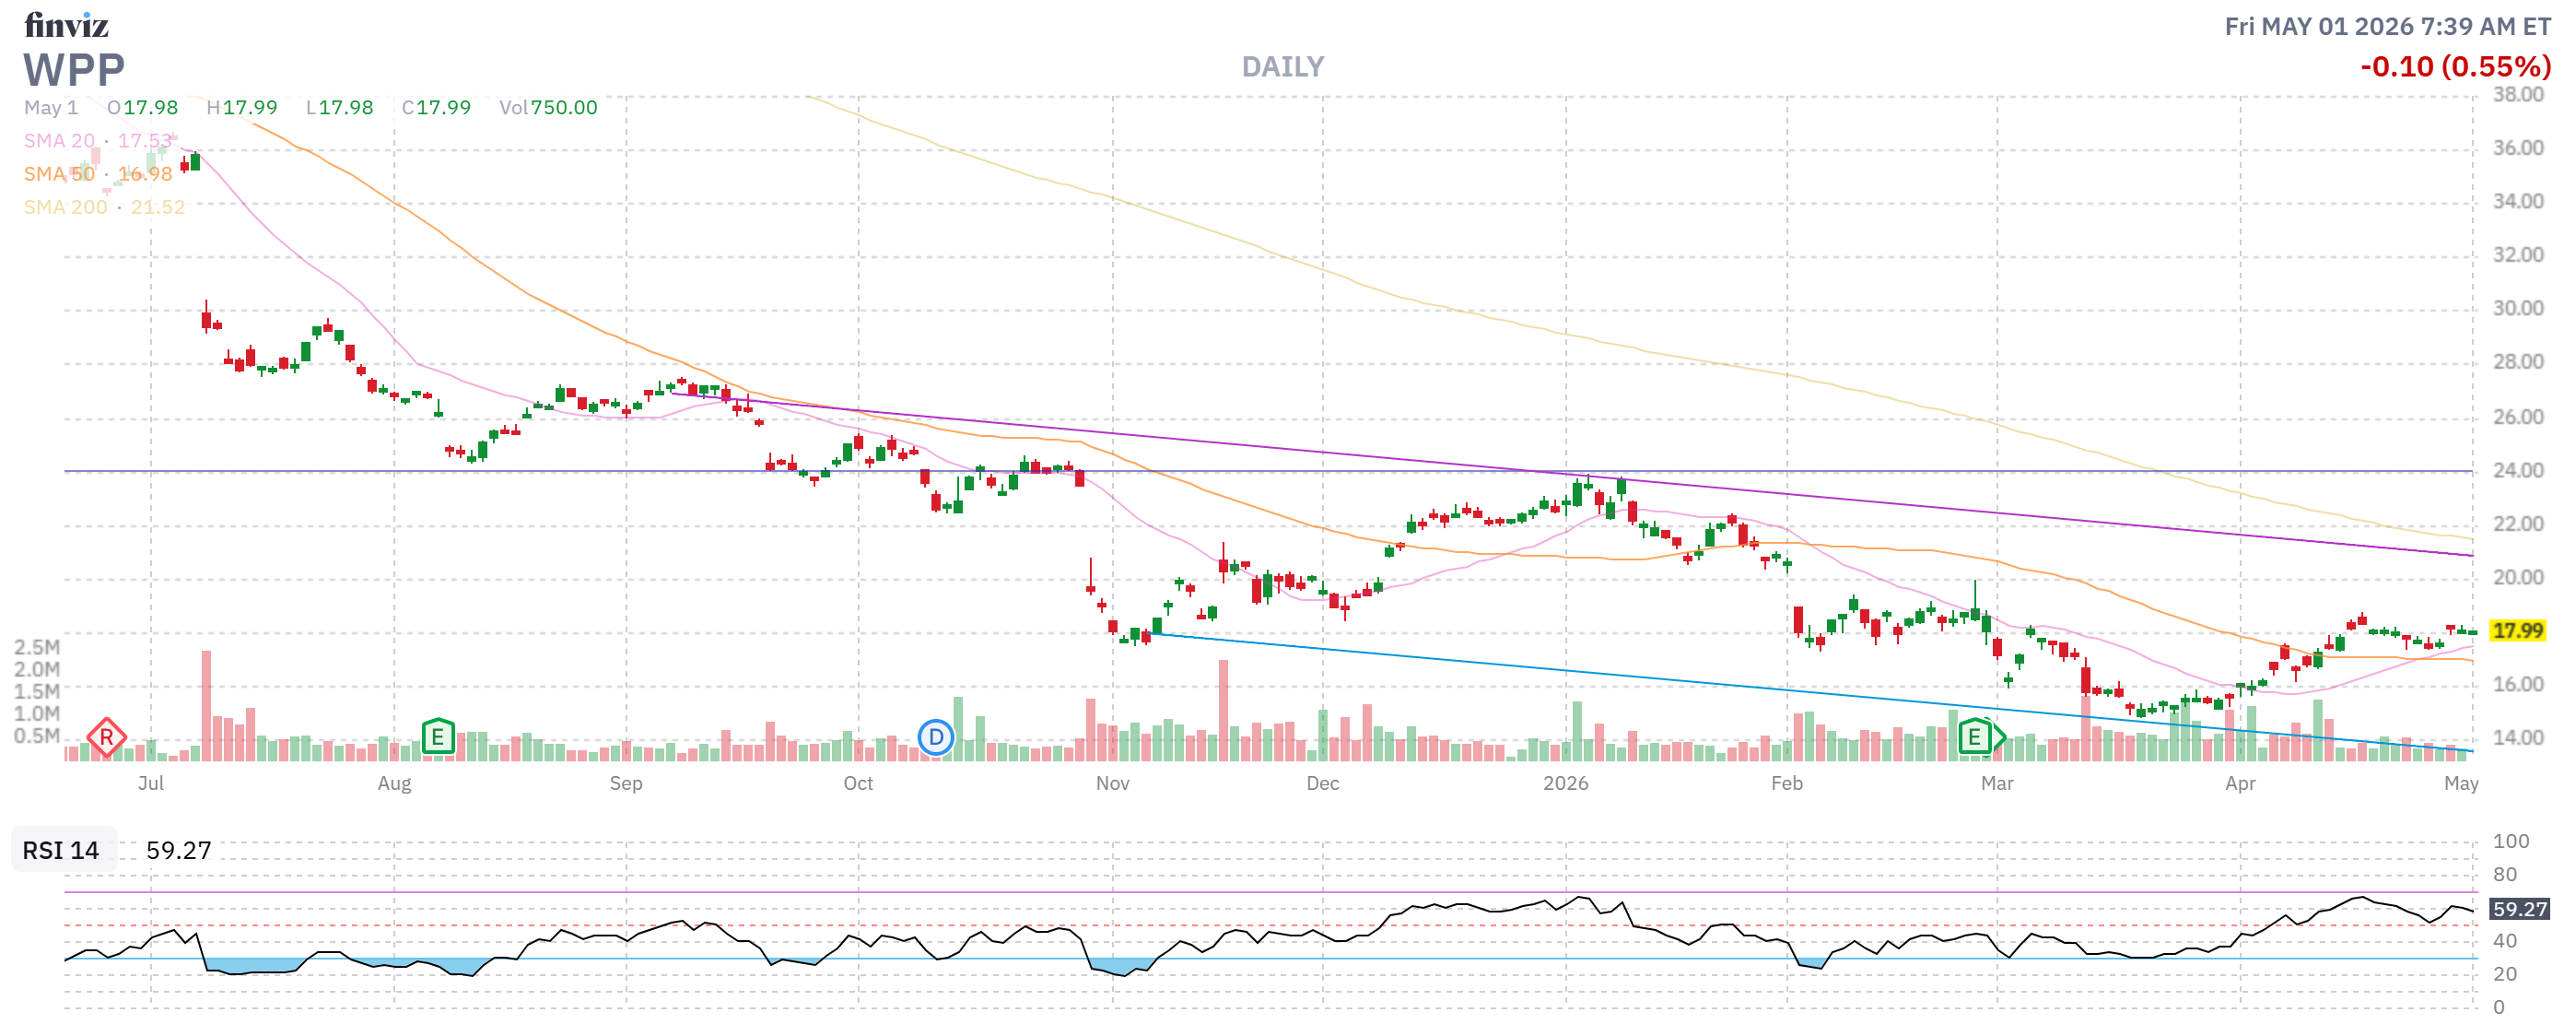
5. The marketing/advertising sector is whispering “uncertainty” and getting ignored.
Both Omnicom and WPP flagged Middle East as a “drag” on Q1. WPP’s regional revenue declined 12.6% LFL after low single-digit growth in Q4 2025. The Middle East is only ~2% of net sales for these agencies — but ad budgets are notorious leading indicators because they’re the first thing CMOs cut when CFOs get nervous. Two top-5 agencies flagging “uncertainty” in the same week, while equity strategists are calling for 19% earnings growth, is a profound disconnect.
The earnings paradox in one chart-shaped paragraph
S&P 500 earnings growth: +15.1% blended Q1. Forward 2026 estimate: +16-19%. Sectors with negative growth: 3 (was 1 entering the quarter). Forward P/E: 20.9x (vs. 5-yr avg 19.9x, 10-yr avg 18.9x). Average price reaction to a beat: +0.9% over 4 days (vs. +1.0% historical). Average price reaction to a miss: -2.6% (vs. -2.9%).
Insight/2026/04.2026/04.27.2026_Earnings%20insight/03-sp500-sector-level-net-profit-margins-q126-vs-5-year-average.png?width=672&height=384&name=03-sp500-sector-level-net-profit-margins-q126-vs-5-year-average.png)
Translation: The market is rewarding beats LESS than usual and punishing misses LESS than usual. That’s the technical fingerprint of “we already priced in all of this.” The S&P 500 itself is down ~4-5% YTD, with all the action under the hood. (Sharewise had the cleanest analysis of this divergence.)
IV. What We See That Wall Street Doesn’t
Here’s where we earn our PSW membership fees. Six things the consensus is collectively missing:
1. The “Tariff Tailwind Reversal Trap” (Q3 2026 catalyst)
Companies reporting Q1 2026 beats partially driven by lower-than-feared tariffs (tariffs are on hold and refunds are coming in) are setting up brutal comps for Q3 and Q4. The bar is now reset. By Q3 reporting (October/November), there’s no “we feared worse” buffer. Stanley Black & Decker, Columbia, GM, anything heavily exposed to imports — the second-half guidance trajectory is more important than Q1 beats.
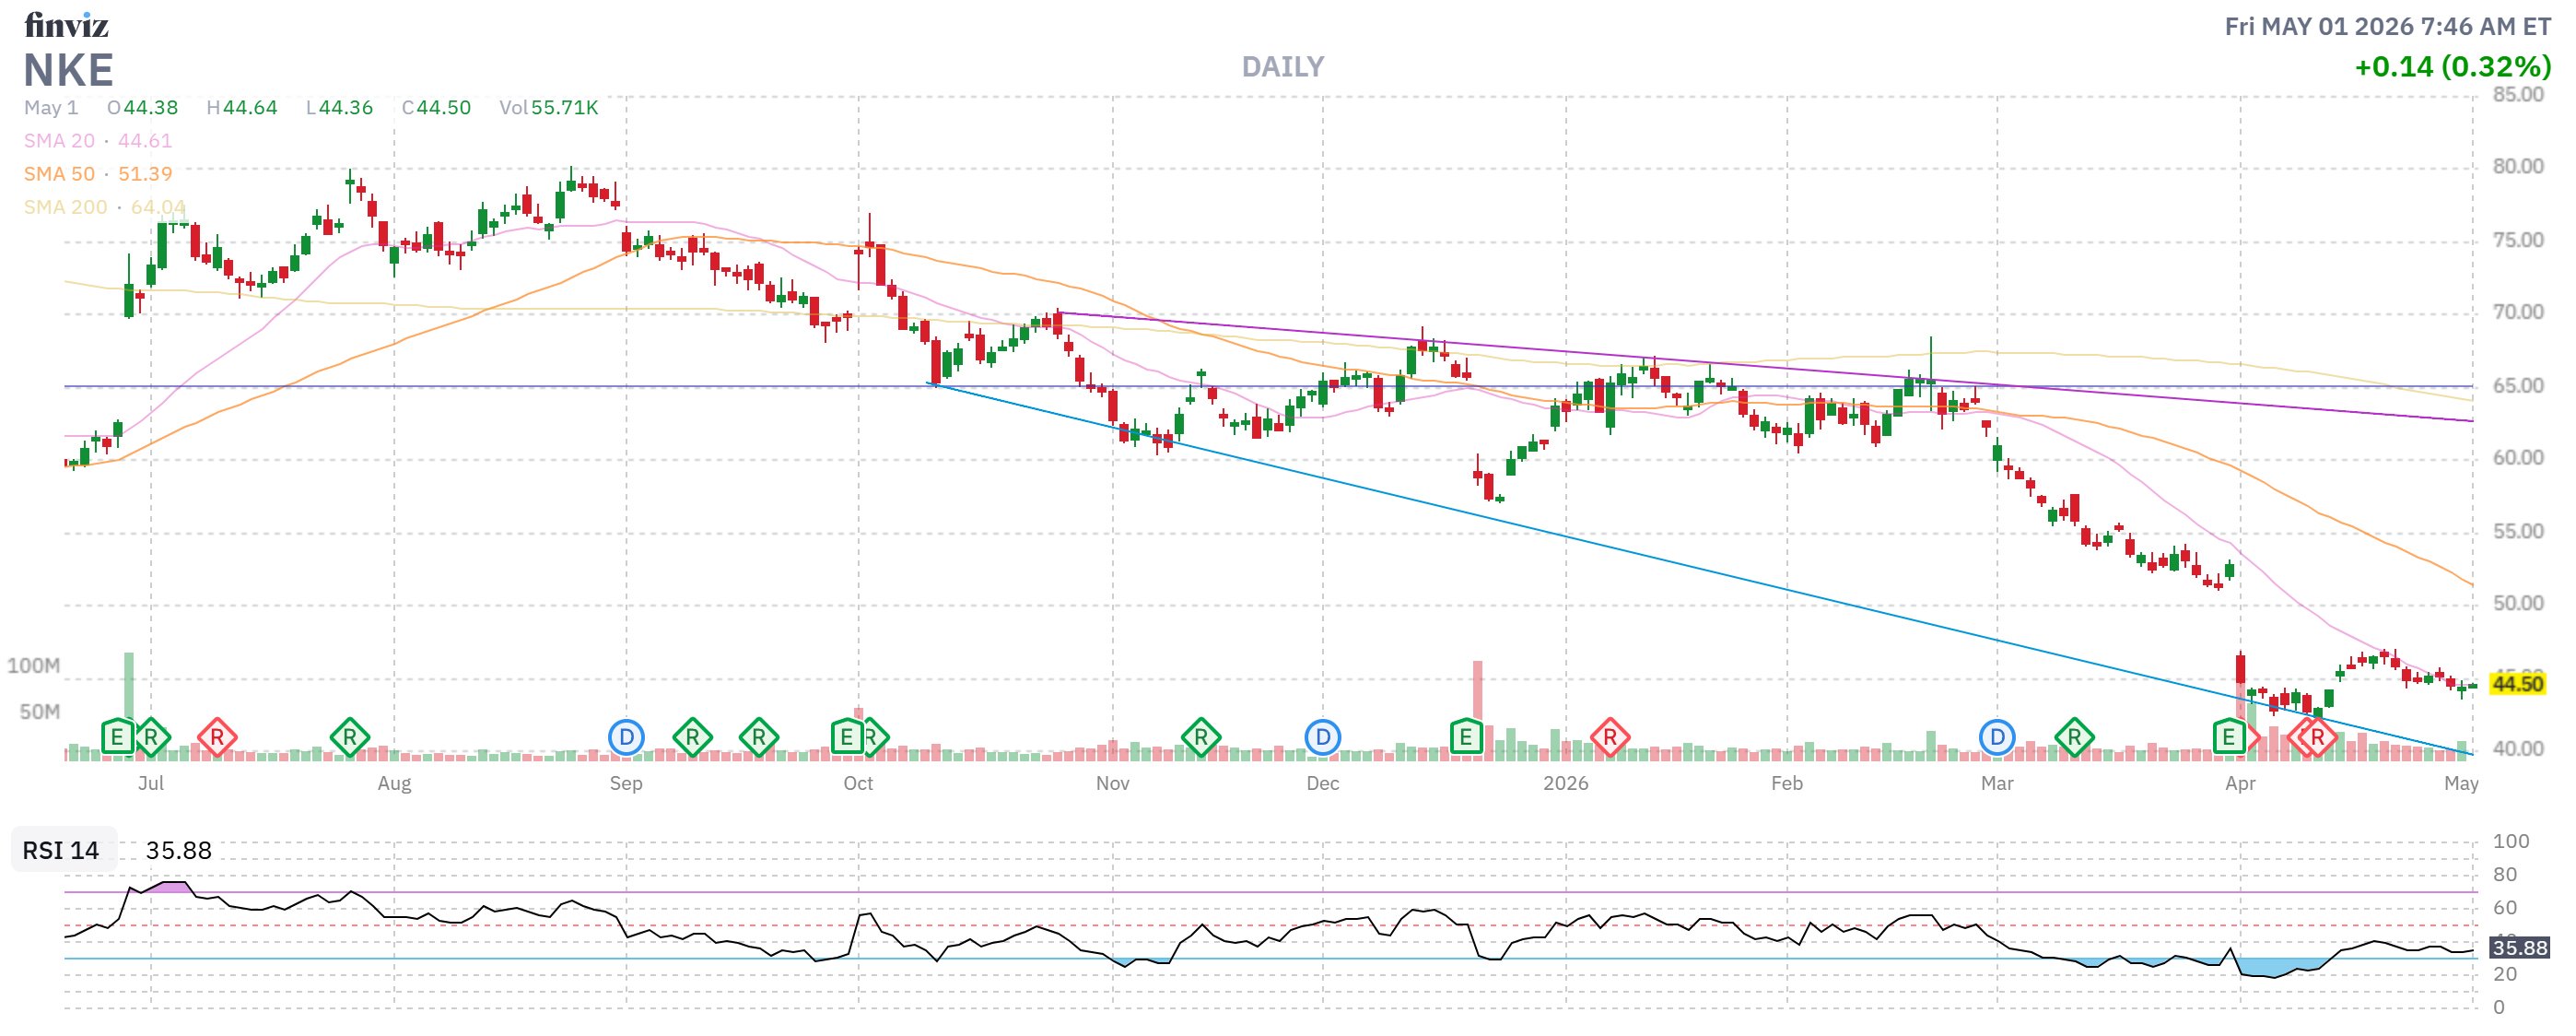
Trade idea: Look at the apparel/footwear/tools complex. Buy the high-quality names with structural moats (NKE recently disappointed but is washed out at this point), short or pair-trade the secondary names whose Q1 beats are ENTIRELY tariff-tailwind-driven without underlying demand recovery.
2. The “Six-Month Mine” Trade
The Pentagon told the Senate Armed Services Committee that mine clearance will take SIX MONTHS once the war ends. That hasn’t filtered into commodity curves yet. The futures strip prices Hormuz reopening as a 2-3 month event. Six months means tanker rates stay structurally elevated through Q1 2027 minimum.
Trade idea: Tanker stocks (FRO, STNG, INSW, DHT) have rallied but trade at 5-7x earnings on assumed normalization. If Hormuz stays partially closed through year-end, day rates stay 3-4x normal. Container shipping (ZIM is the cleanest play) has a similar setup as the Asia-US West Coast lane is up 29% since February and freight insurance has 10x’d from 0.5% to 5% of vessel value.
3. The “Consumer Bifurcation Trade Has Inverted“
Through 2024-25 the trade was: long luxury, short mass-market. As of right now, the trade has flipped and nobody noticed:
-
-
Darden Q1 same-store sales +4.2% (mid-tier dining holding)
-
United Airlines premium revenue +14% YoY (high-end travel resilient — for now)
-
Dollar Tree, Dollar General guiding lower despite low-end consumer pressure
-
But within the Mich sentiment data, the largest sentiment drops are from middle and higher-income consumers with stock wealth. That’s the cohort that JUST got hit by gas prices AND a market correction. The marginal pain is now in the middle, not the bottom.
Trade idea: Be careful with luxury and high-end discretionary going into Q3. Tiffany/LVMH/Ferrari/aspirational tier are the next shoe to drop. Off-price retail (TJX, ROST, BURL) — already crowded — has structural protection because everyone trades down a notch.
4. The “Defense Sector Bifurcation“
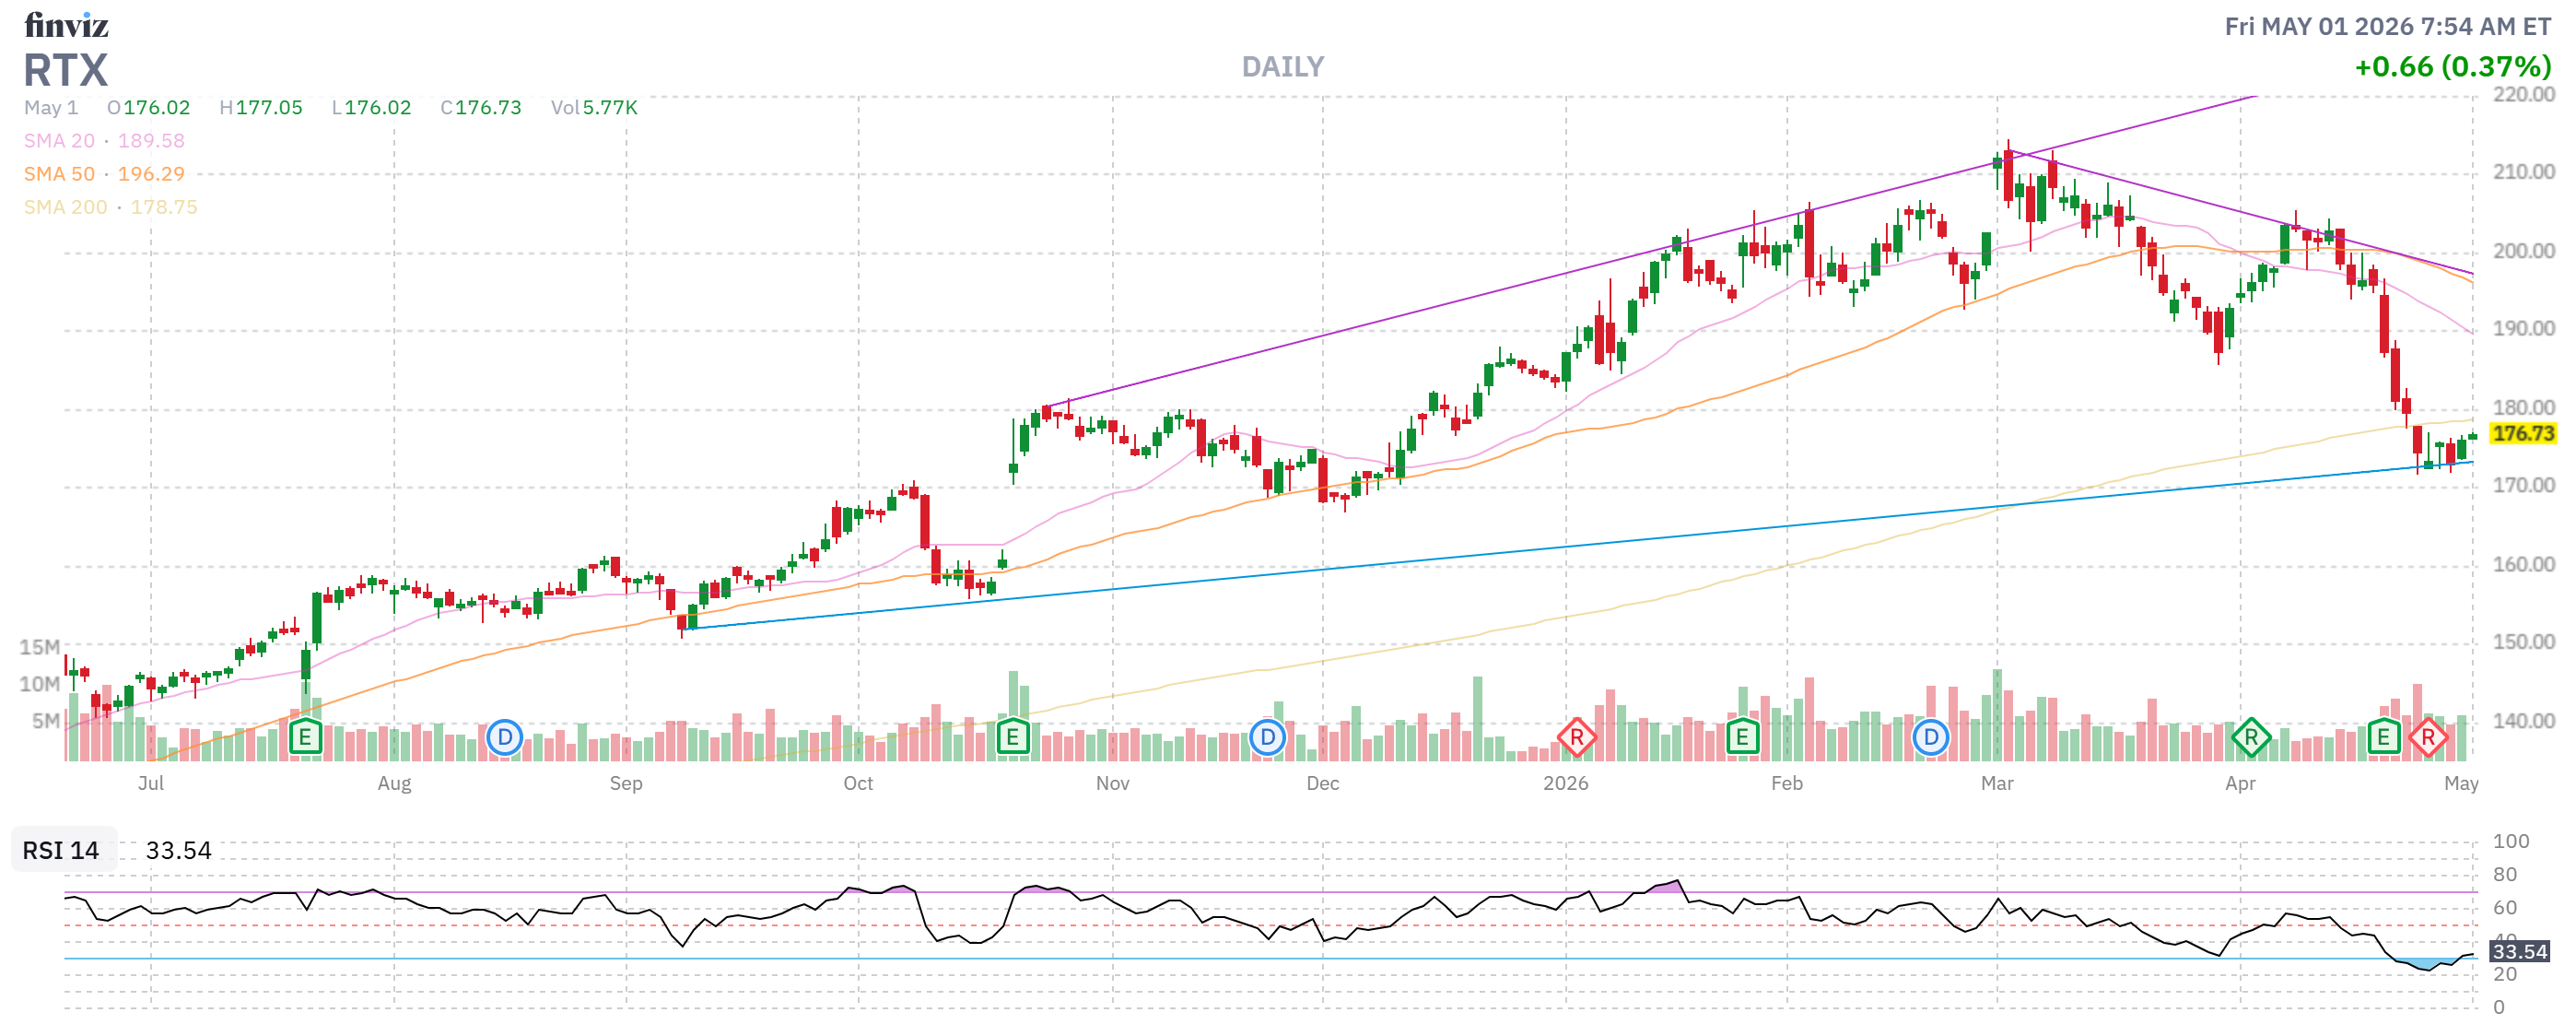
Lockheed Martin missed Q1 EPS, sales only +0.3% YoY, despite the most active war environment in a generation. RTX, by contrast, had +10% organic growth and raised guidance to $6.70-6.90 EPS. Why?
Two reasons consensus is missing: (1) Lockheed’s program-of-record cycle is in a trough between F-35 lots and (2) the war is being fought primarily with missiles, drones, and air defense interceptors — RTX’s sweet spot — not big platforms. Same theme: AeroVironment and Textron jumped 6%+ on earnings.
Trade idea: Within defense, the consumables/munitions/drones complex (RTX, AVAV, KTOS, Howmet) is structurally re-rated higher than the platforms (LMT, NOC). The Pentagon’s restocking cycle for THAAD interceptors alone is a multi-year tailwind. If Congress eventually funds a war supplemental (which they’ll have to), RTX is the prime beneficiary.
5. The “Gold Already Knew” Signal
Gold is above $4,500/oz since January and people are still treating it like a story stock. Yardeni called for $10,000/oz by 2029. Central banks have been the marginal buyer all of 2025 — they’re buying because they don’t trust the dollar, not because they’re worried about a war. Gold is telling you the de-dollarization trade is structurally underway and it’s accelerating, not pausing.
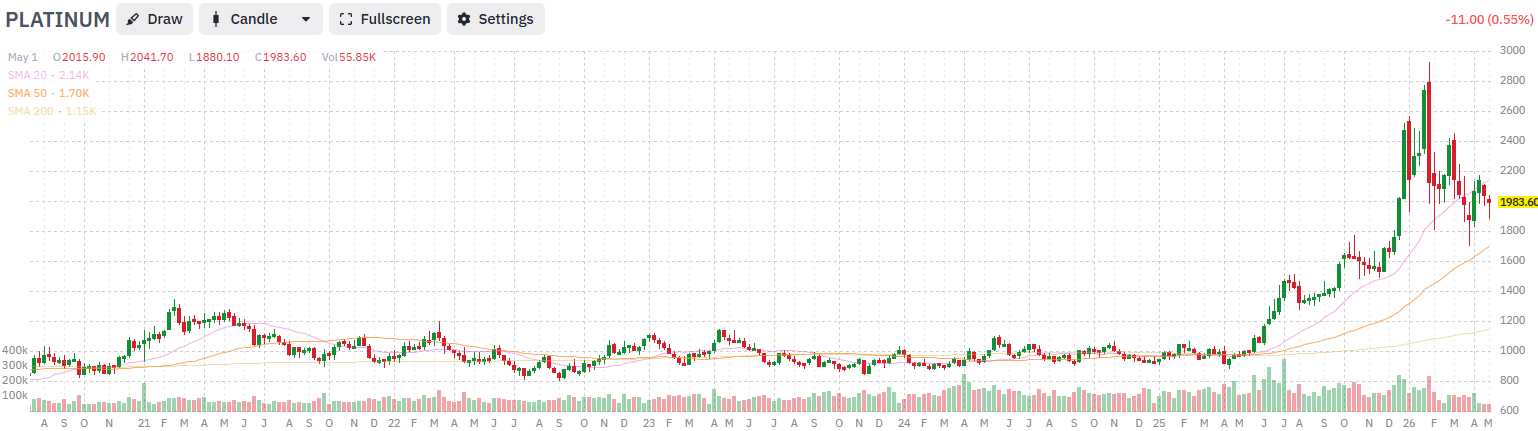
Trade idea: Gold miners (the S&P metals & mining complex) have NOT kept pace with bullion. The Newmonts, Barricks, Agnico Eagles of the world should mathematically be earning record cash flow and trading at sub-10x multiples. The leverage trade still works. Add silver (SLV/PSLV) for the higher-beta version — silver is at $74 per Reuters and platinum is at $1,985 – double last year.
6. The “Powell Successor Volatility” Setup
Whoever Trump installs at the Fed (May 15 transition) walks into 8-4 dissent, 3.3% headline CPI, an open question about whether the war re-escalates, and a sitting president who tweets about rate cuts daily. The risk of a policy mistake is higher than at any point since 2008. Markets are priced for “boring continuation.“
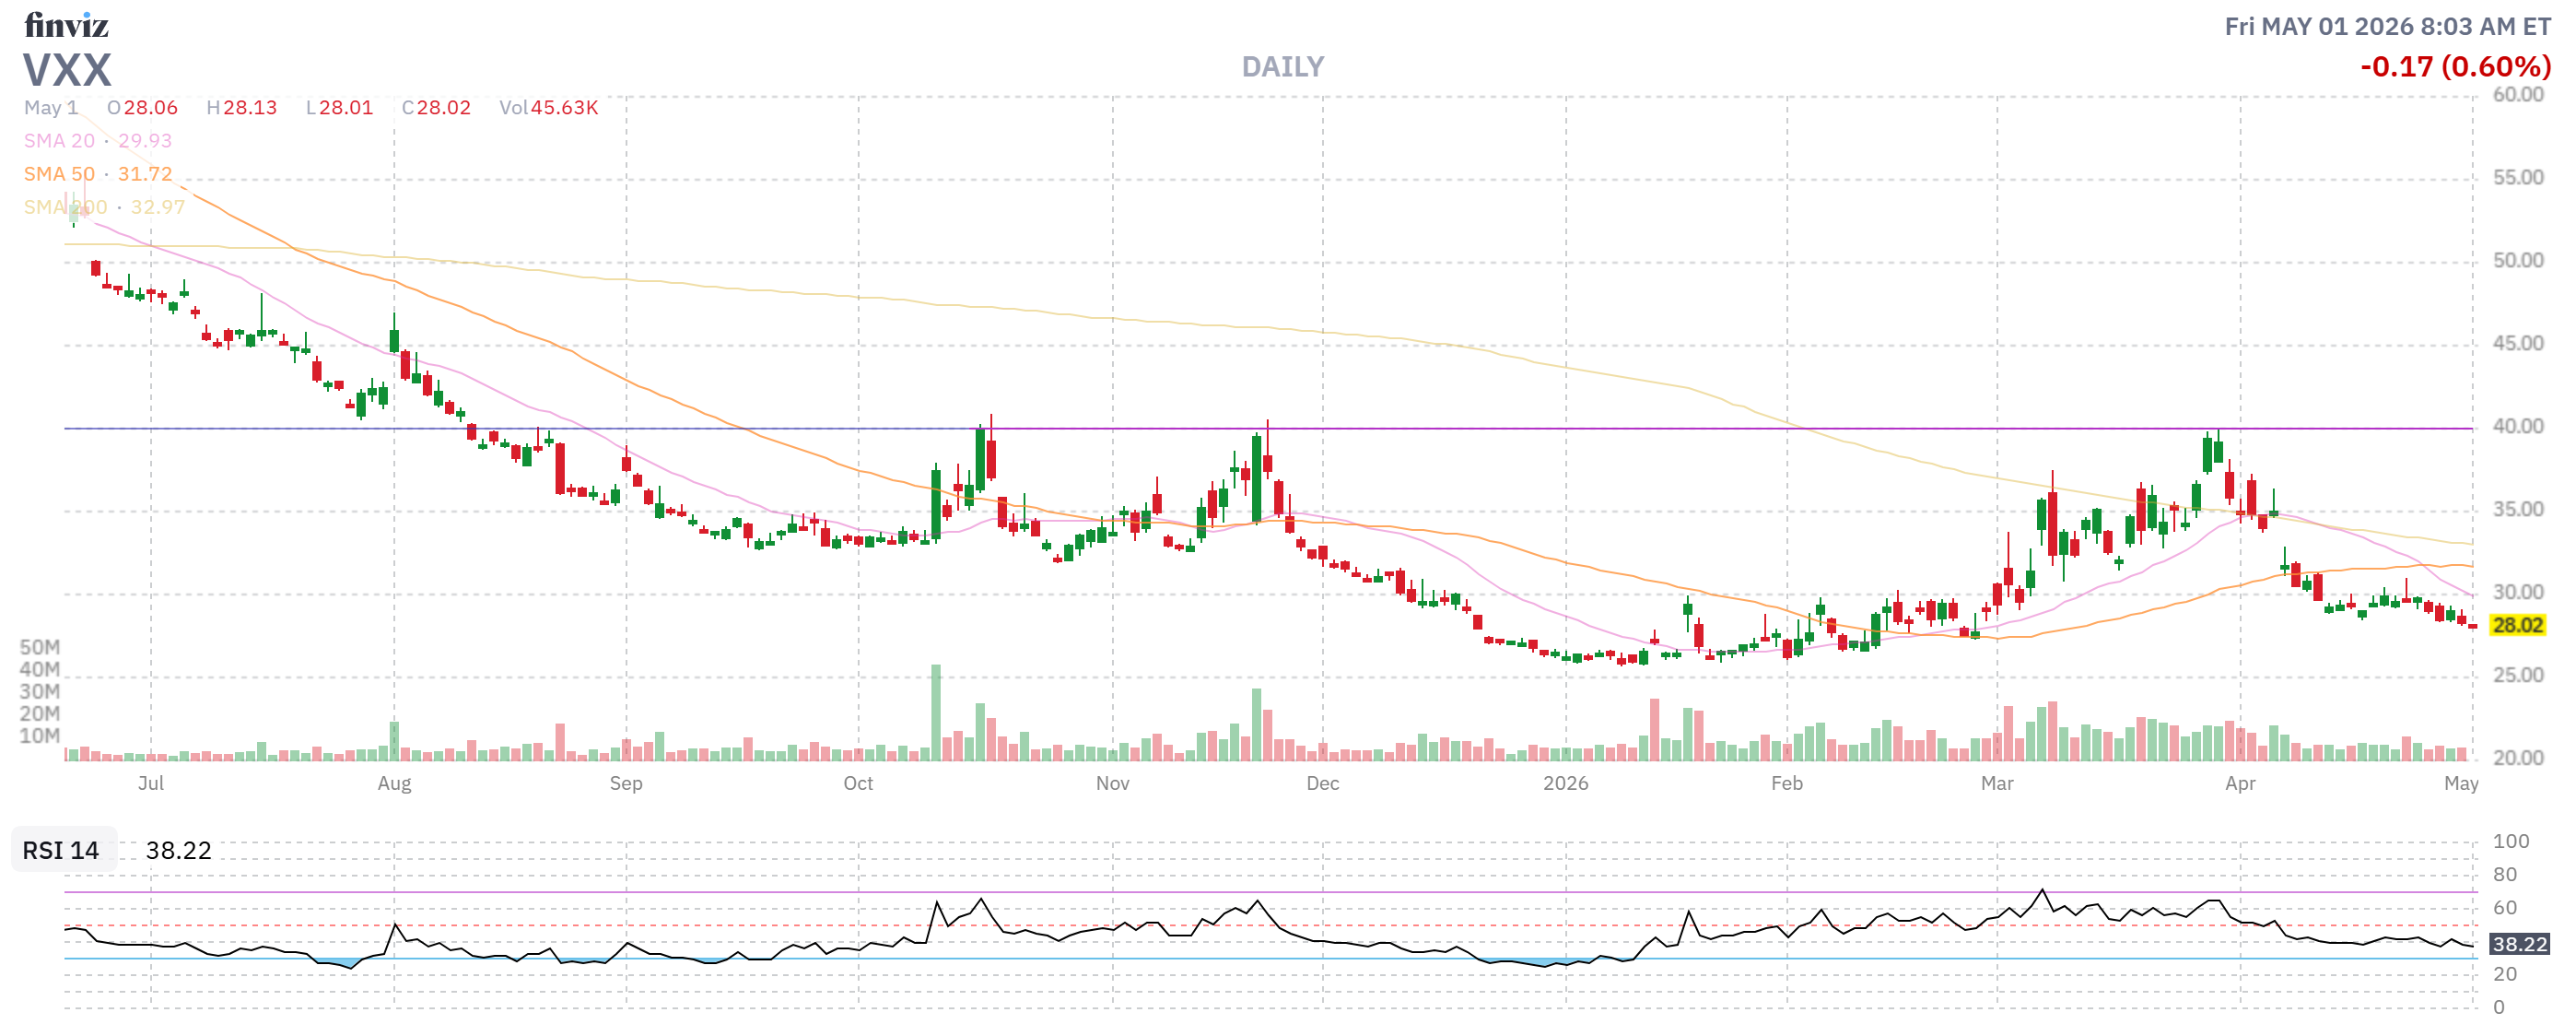
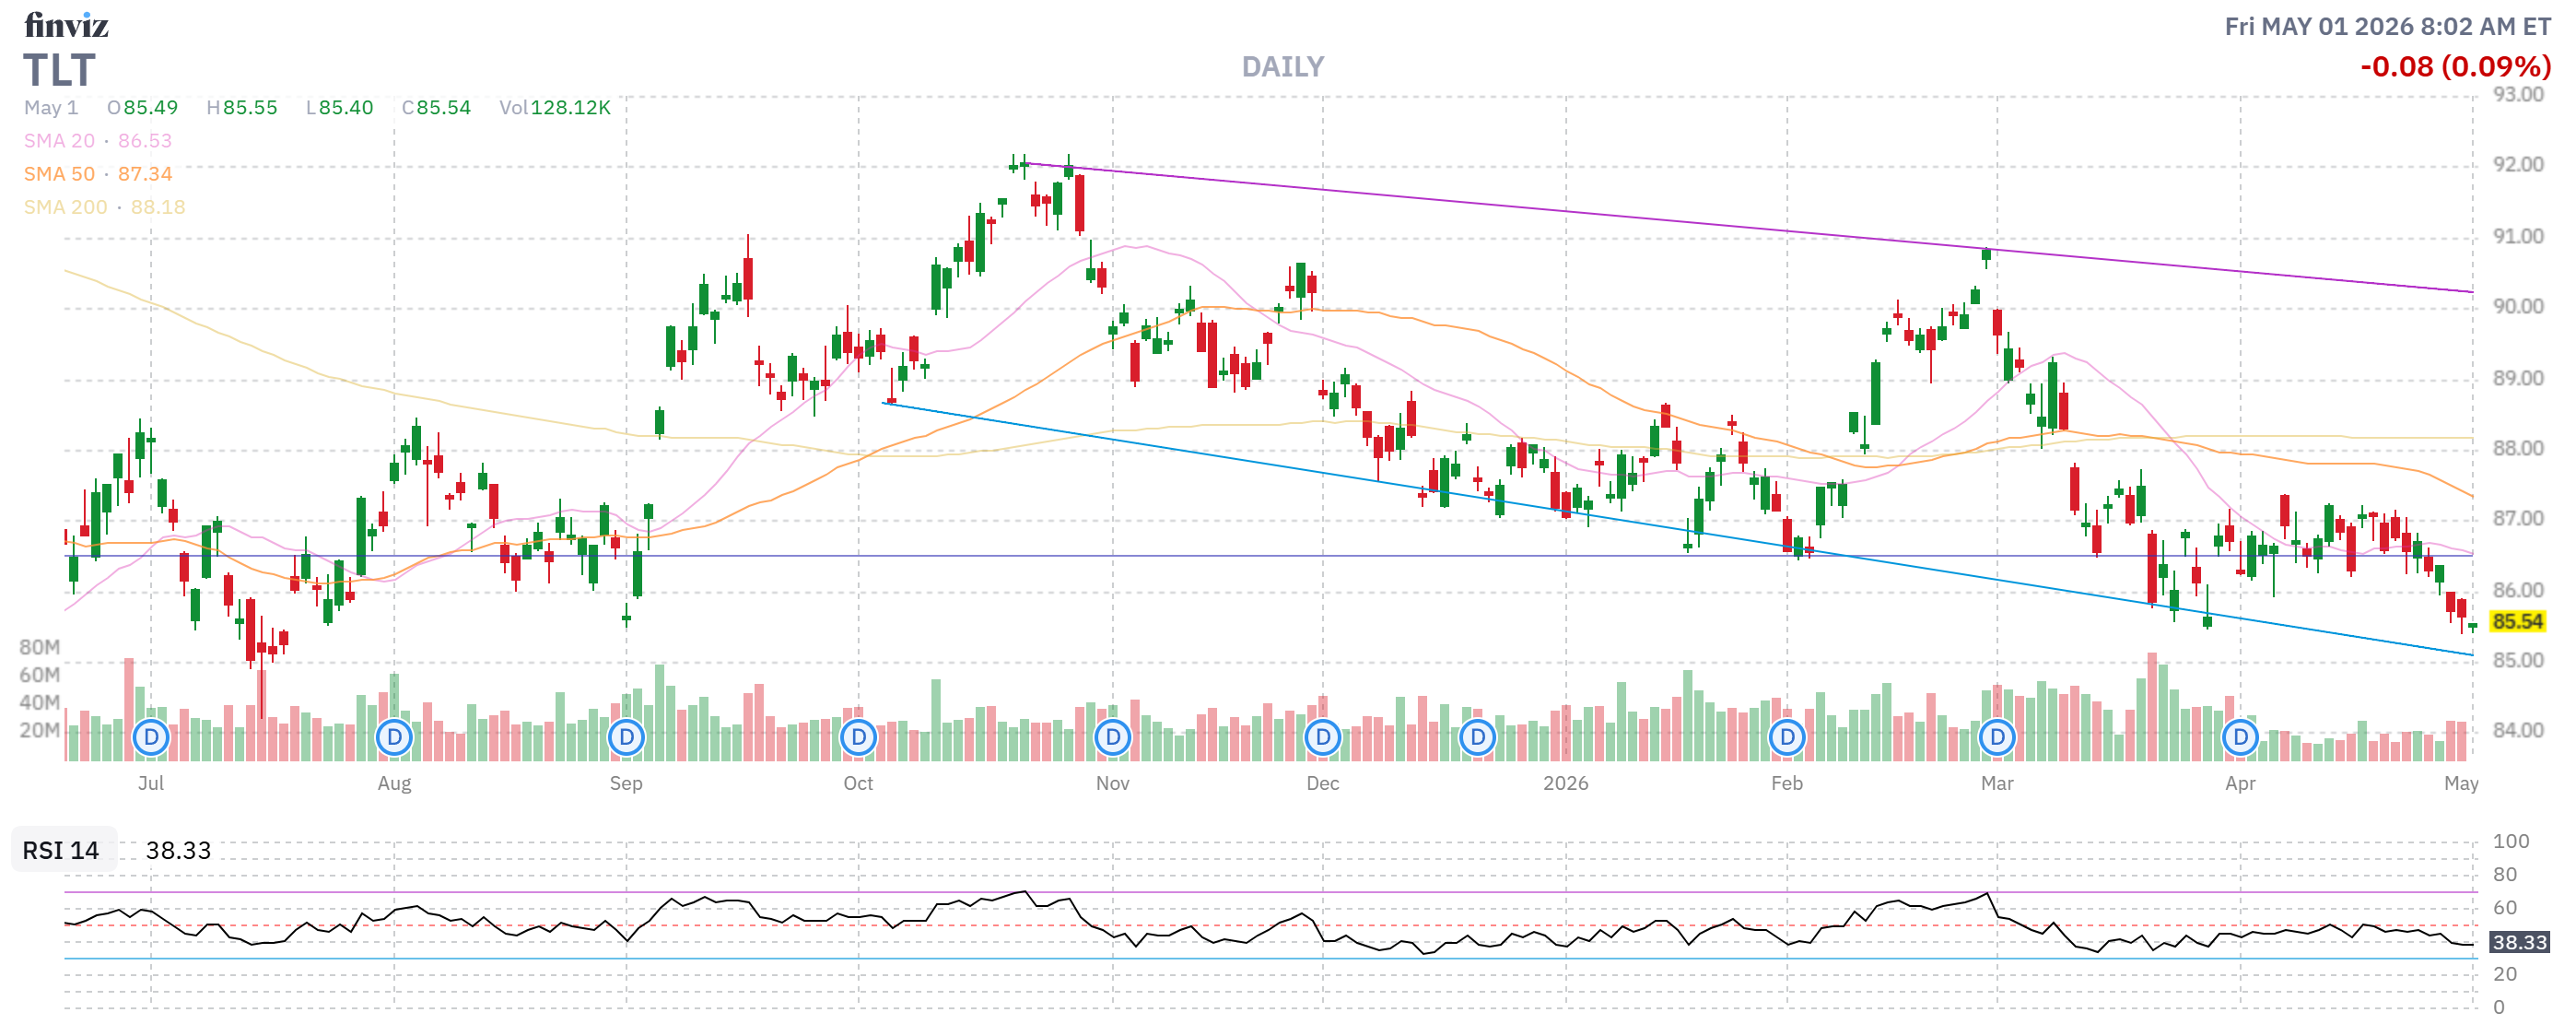
Trade idea: Long volatility going into the May 14 FOMC. VIX has been compressed at ~17-19 because earnings season is “boring strong.” Cheap calls on VIX (now 16.82) or VXX (now $28.02) into mid-May are a smart hedge for any portfolio — and structurally a profit center if the new chair fumbles the inaugural press conference (which historically happens about 50% of the time). The most asymmetric setup is 2-3 month at-the-money calls on TLT (now $85.55) — long bonds get crushed if the new chair is dovish and inflation re-accelerates, but if the new chair is credible and the war drags down growth, TLT rips higher. Either way, vol expands.
V. The Honest Forecast for Members
Here’s where we stand on duration and damage vs. our March 28 framework:
Better than expected:
-
-
Oil pulled back from $113 peak to $104.25 — the IEA SPR release worked as a circuit-breaker
-
The economy didn’t fall off a cliff: +2% GDP, +178k jobs, retail sales healthy
-
Corporate margins held up — record net profit margin of 13.4%
-
The April 8 ceasefire, however fragile, took kinetic escalation off the table
-
Worse than expected:
-
-
Strait of Hormuz is structurally impaired for 6+ months even POST-ceasefire (mine clearance)
-
Fed dissent is at a 34-year high entering a chair transition
-
Consumer sentiment is grinding lower among the cohort that has the money (middle-upper income)
-
The “tariff tailwind” narrative is masking demand softness that will surface in Q3
-
Capex guidance from the hyperscalers is so massive ($650B+) that any AI investment hiccup would crush 30%+ of the index
-
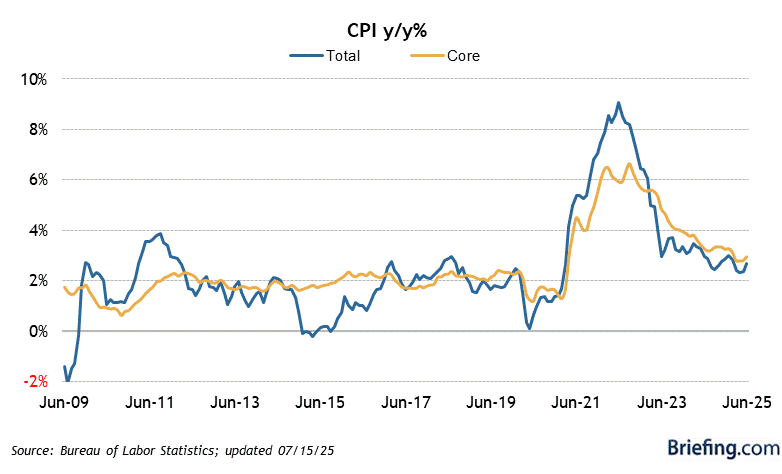
Headline CPI re-accelerated to 3.3%, ending the disinflation narrative
-
The PSW base case for the rest of 2026:
-
-
S&P 500 ends 2026 in the 6,400-6,800 range — modestly down (5-10%) from current 7,200 level. The “+19% earnings growth” narrative collides with multiple compression as forward visibility deteriorates
-
Brent crude $90-110 range — Hormuz constraint floors prices, SPR release ceilings them
-
Fed funds rate ends 2026 at 3.50-3.75% (zero cuts) — the median dot plot will be revised down to zero by July’s SEP
-
10-year Treasury yield grinds higher to 4.50-4.75% (currently mid-4s) on stagflation premium
-
Recession probability: 40% (vs. our March 28 estimate of 30-50%) — slightly de-risked but still elevated. Goldman is at 30%, EY at 40%, Moody’s near 50% – the market seems oblivious to this risk, which is very dangerous.
-
The PSW message: This is no longer a war story. It’s a late-cycle story with a permanent geopolitical risk premium baked into every multiple, every input cost line item and every consumer sentiment reading. The companies thriving are the ones with pricing power, dollar-revenue exposure, AI infrastructure tailwinds or hard-asset leverage. The companies dying quietly are the ones in the middle of the income spectrum, exposed to fuel inputs they can’t pass through, or staring at “tariff tailwind” comps that disappear in 90 days.
The herd is reading FactSet’s 15.1% growth print and going home happy. We’re reading the dispersion underneath it — and that’s where the next six months of alpha lives.
Have a great weekend, and remember: when CEOs say “uncertainty” four times in an earnings call but reaffirm guidance, they’re not telling you about Q1. They’re telling you to read Q3 carefully.
— Phil and the Round Table Consulting Team


