PhilStockWorld August Portfolio Review (Members Only)

0
2

It’s been an interesting month:  

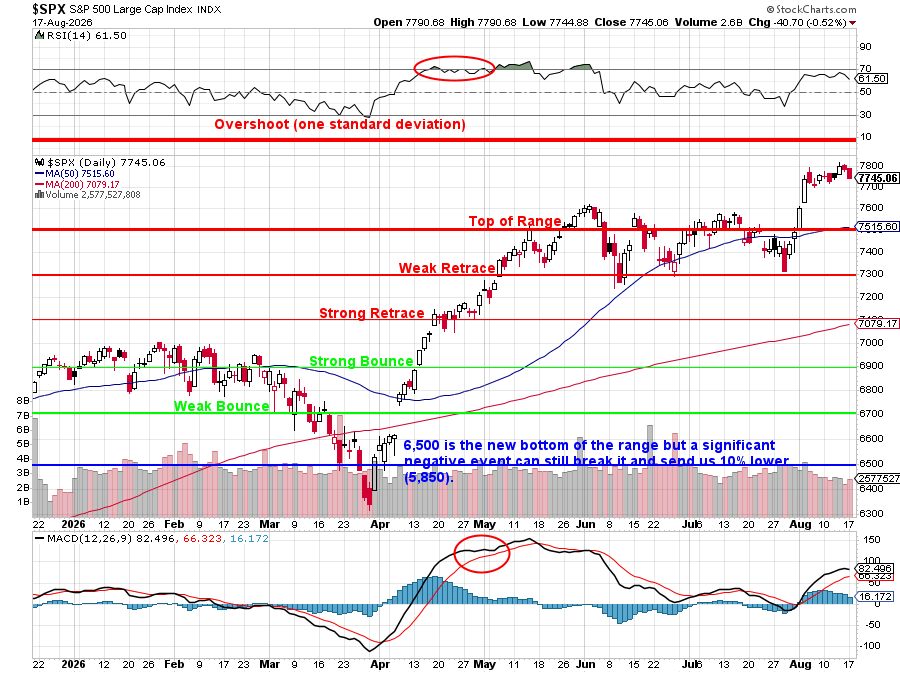
Our last Portfolio Review was on July 15th with the S&P at 7,543 and now 7,745 is up 2.666% and maybe that’s a good sign 👹, but maybe not… We got a MILD pullback in between and now we’re over the top of our range but still within our prediction so we’re mostly waiting and seeing as earnings season winds down. 
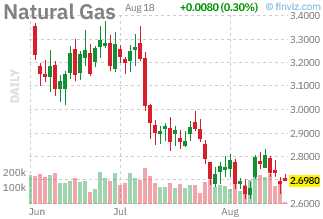
Yesterday, we did a major strategic review to take us into the end of the year and we’ll spend the next few months transitioning into a profile that matches that outlook. The war is still on (the cease-fire officially ended yesterday) – oil was $79.79/85.33 last month and this morning it’s $84.07/90.90 and we just took a long on /NG at $2.65 in our Live Member Chat Room yesterday. 

As I said in the last review:

The S&P is essentially right where we left it last month but the Nasdaq is down about 500 points (1.6%) – no big deal and earnings are coming, which are expected to be SPECTACULAR! If IBM can drop 25% and the indexes finish the day green – then you can’t bet against this market going higher and higher and higher (until it pops).

Earnings have indeed been SPECTACULAR but they have also been concentrated in the HYPErscalers and, EVEN WORSE, half of those earnings were the result of them buying each other’s stocks and making massive paper gains that have not done the Economy a lick of good (GDP up just 1.5%).

Bank of America bull bear indicatorI KNOW it sounds like sour grapes or whatever but these are SERIOUS, GENUINE concerns that we have and they force us to be much more cautious than the general trading population – which is all in on this rally, with Bank of America’s Bull/Bear Indicator at 9.6 – with 10 being the maximum – the highest since 2021 (and a 25% correction). 

So, with all that in mind, we will review our current positions and come up with an investing plan for the next 30 days but, whatever the market does – we maintain the house advantage using our award-winning hedging strategies – no matter what lies ahead:  

Money Talk Portfolio Review: I was last on the show June 10th and we did the last full review on the 9th we only adjust the portfolio on show (taping) days on Bloomberg so we can’t change anything – this is just an FYI.  We had DROPPED from $644,581 to $627,265 last month – with nothing being touched and these are NORMAL fluctuations when you have an options portfolio (they are volatile) and, of course, we left them alone and now we are back to $672,325, which is up a whopping $45,060 (7.2%) for the month. 

It’s also up 572.3% since starting with $100,000 on Aug 21st, 2024 – so Happy Anniversary (2nd) to the Money Talk Portfolio! Not bad for a portfolio we are only allowed to touch once per quarter! I’ll be on the show again next month, when we will make adjustments: 

Last month I said: We CAN’T make any changes again until September so there’s not much to say here.  These gains can evaporate as fast as they came if the VIX re-escalates – but that’s what the hedges are for. Notice we are about 60% in CASH!!! after cashing out AMAT – that makes me rest easier as well….” – Nothing has changed…  

$700/Month Portfolio Review: We did this review 2 weeks ago and the only change since was adding the UNG spread yesterday. The goal of this portfolio was to contribute $700 each month and trade our way to $1M and the goal was to do that in 30 years (averaging 10% per year) but we’ve been averaging 91.45% for 4 years (this is our anniversary!) and we’re on pace, at $153,234, to hit our $1M goal in less than 3 years.

I know that still sounds very ambitious and yes, it’s very unlikely the market keeps up this trajectory but we will get there, eventually – because we are applying our “Be the House – NOT the Gambler” strategy CONSISTENTLY, month after month – and we are avoiding the meme stocks and the trend stocks and picking VALUE and THAT is how you average 90% per year – Ty Cobb, NOT Dave Kingman!  

    • ET – At our goal at net $2,954 on the $3,000 spread and earnings were just a huge beat and we do have 4 uncovered… Hmm,  we can sell 4 Dec $21 calls for $1 ($400) and generate 3x of those into next year for $1,200 upside potential, which is 40% plus maybe a bit more headroom as we roll the spread – so it’s certainly better than sitting in cash, right? 

Finviz Chart

    • HELE – Retail is very scary but HELE crushed their last earnings (July 8th) and we’re miles over our target at net $4,100 on the $7,500 spread so all HELE has to do is hold $20 (28% below the current price!) and we’ll make another potential $3,400 (82.9%) so this one is actually Good for a New Trade – even if you did miss our first $2,100 (105%) worth of profits.  

Finviz Chart

    • SOFI – Near the top of our range with a year to go at net $4,122 out of $8,000 so $3,878 (94%) upside potential and we have 3 open slots so let’s sell 3 Nov $20 calls for $1.45 ($435) using 94 of our 521 days.  So 5 sales of $435 is $2,175 (52.7%) of premium selling potential as well – Great for a New Trade!  

Finviz Chart

This is a great example of our Landlord Strategy – you don’t NOT take the $435. It may not seem like much but 5 of those sales is 52.7% over the next year – WHY WOULD YOU NOT TAKE THE MONEY?!? The short calls can’t hurt us – they can only cap our gains but those gains are POTENTIAL – NOT guaranteed while the options premium we sell go straight into our pocket and become more investible CASH!!!

    • SQQQ – Our hedge is down a bit but not much and if the Nasdaq drops 20%, SQQQ will gain 60% from $36.42 to $58.27 and that would pay off 28.27 x 30 contracts is $84,810 and the current net of the spread is $17,550 so we have net $67,260 of downside protection! Good for a New Hedge but I’d sell the $55 calls at $9.35.  

Finviz Chart


IN PROGRESS


Subscribe
Notify of
0 Comments
Inline Feedbacks
View all comments