

The first wave of Q3 reports from yesterday and this morning tells a very clear story that fits right into our portfolio review thesis:
Wall Street’s trading desks and AI hardware monopolies are printing money, while traditional Commercial Banking and Main Street lending are hitting a wall. Valuation discipline is back with a vengeance (and we love it!). Beating a lowered bar (like Citi or J&J did) gets your stock sold by 5% to 6% if the underlying revenue growth or valuation multiple doesn’t hold up, while Bank of America’s $1.36Bn revenue miss this morning shows the consumer and commercial banking engine is sputtering underneath the surface.
1. The Great Bank Split: Wall Street Trading vs. Main Street Lending
-
-
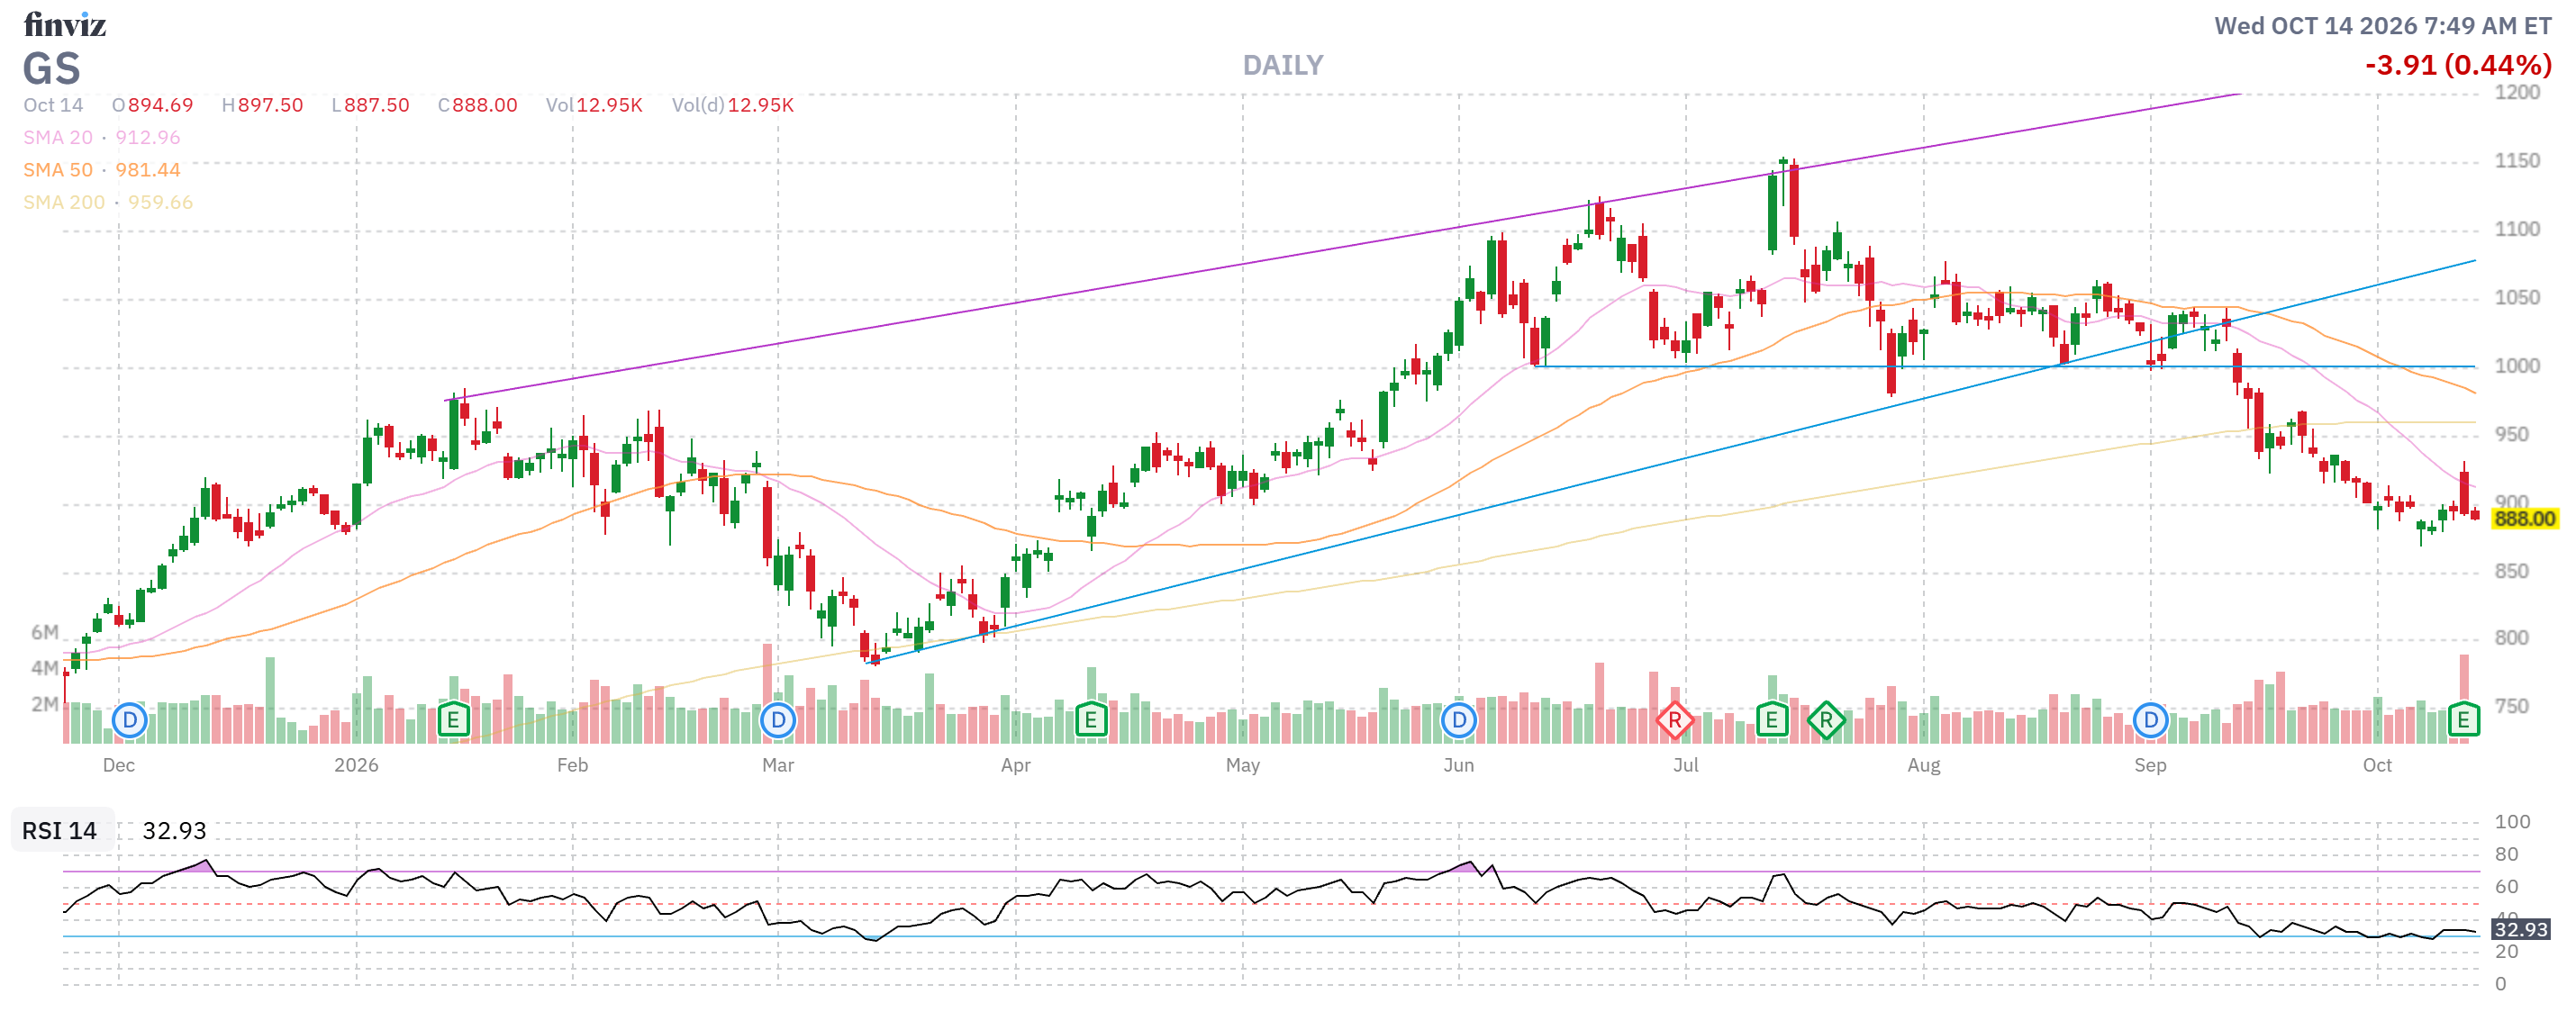
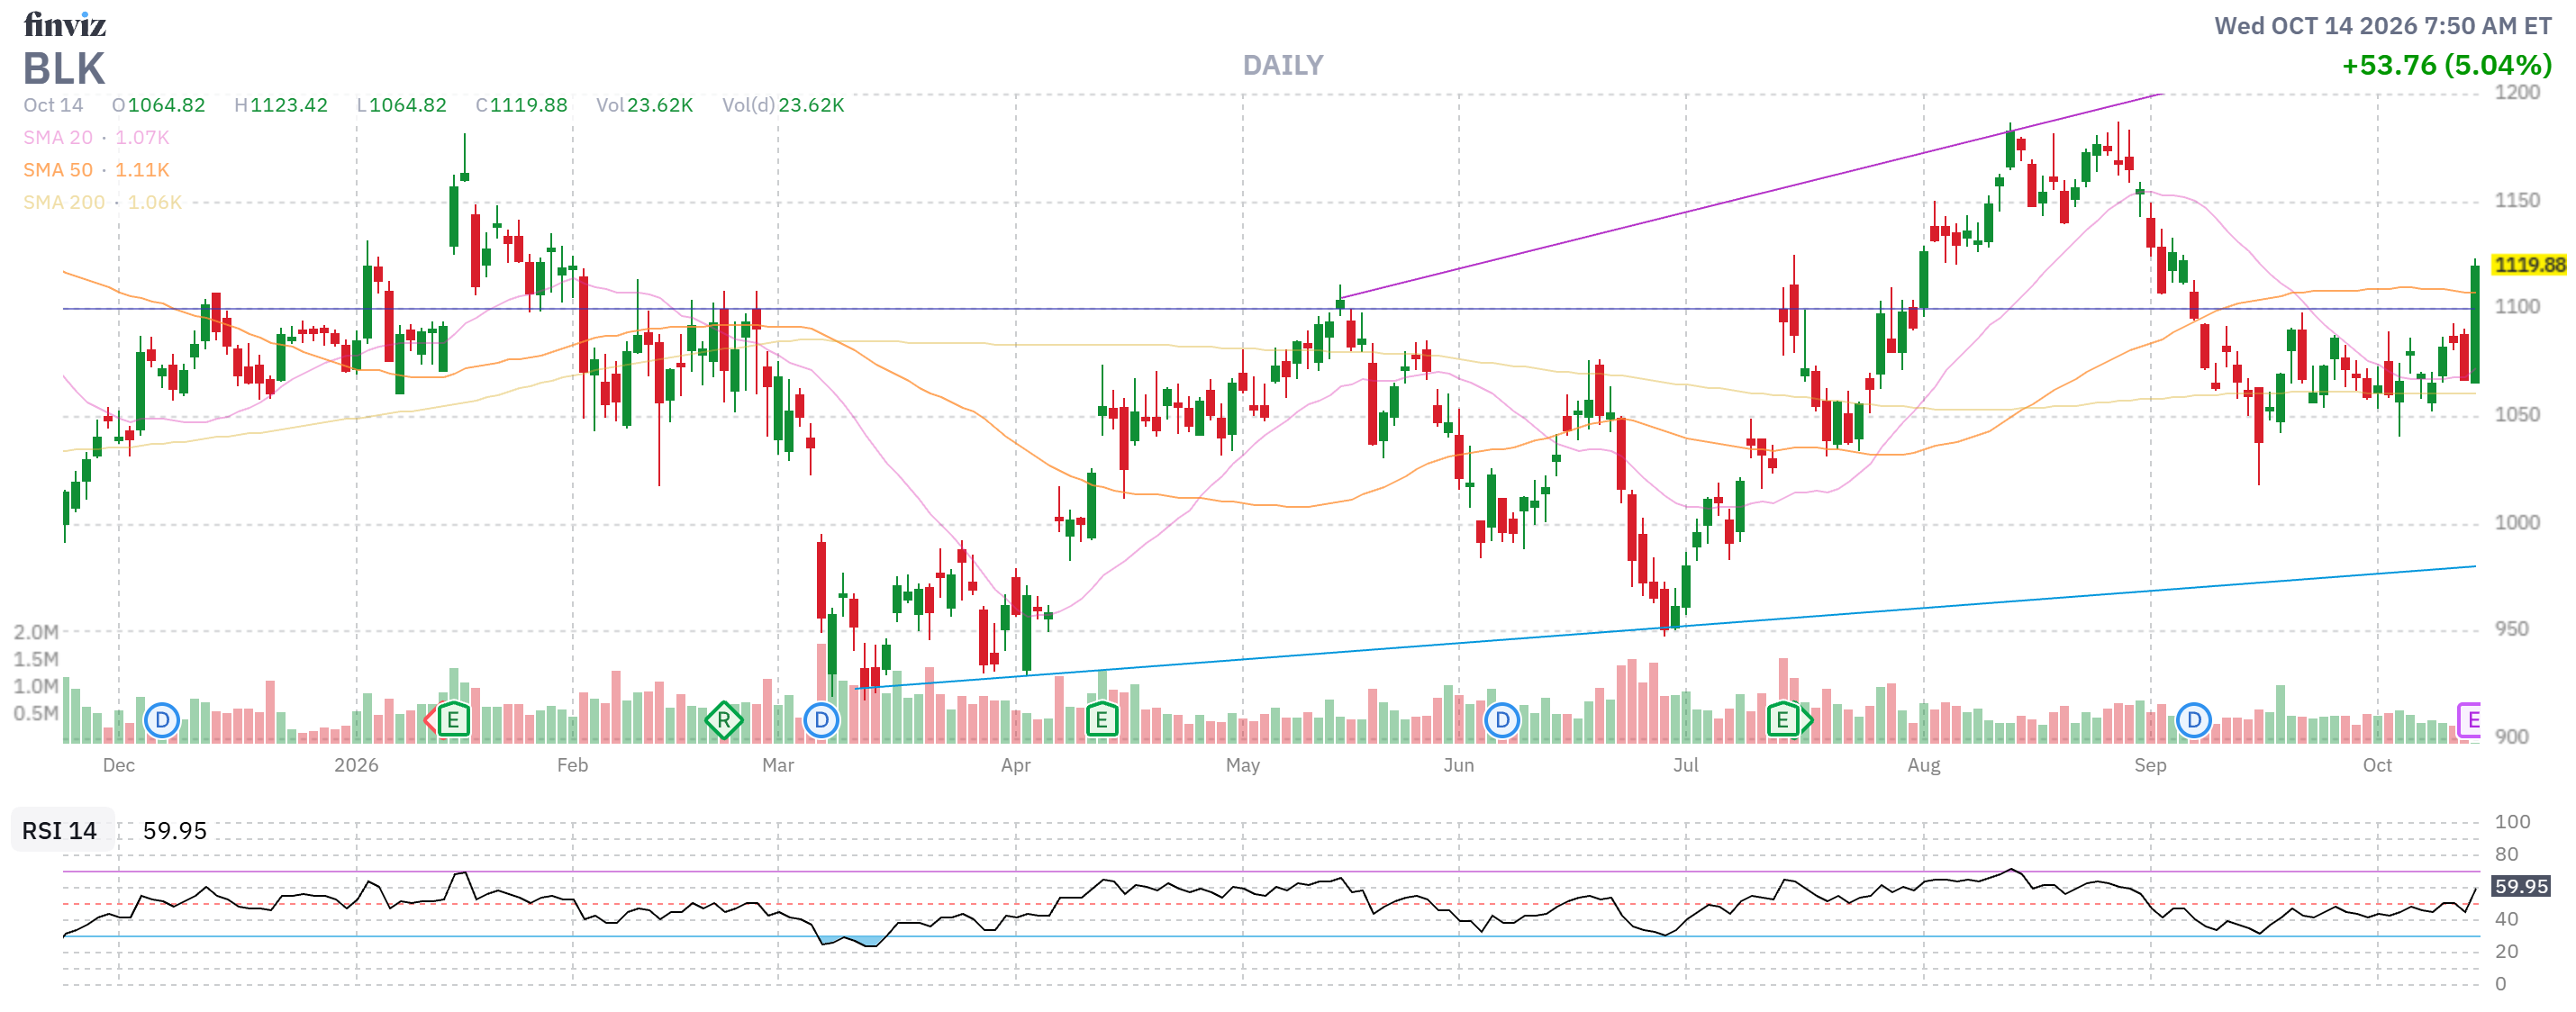
Goldman Sachs (GS) & BlackRock (BLK) are feasting on volatility and flows: Yesterday, Goldman blew the doors off with $18.68 billion in revenue (its second-best quarter ever) and $5.29 billion in net earnings, crushing consensus by roughly 30% thanks to booming equities and fixed-income trading desks. This morning, BlackRock followed suit with a massive Q3 beat, posting $15.93 adjusted EPS (vs. $13.97 expected) on $7.75 billion in revenue (up 19% YoY). Investors handed BlackRock $205 billion in net inflows in a single quarter as money poured into bond funds and Aladdin tech services grew 14%.
-
-
-
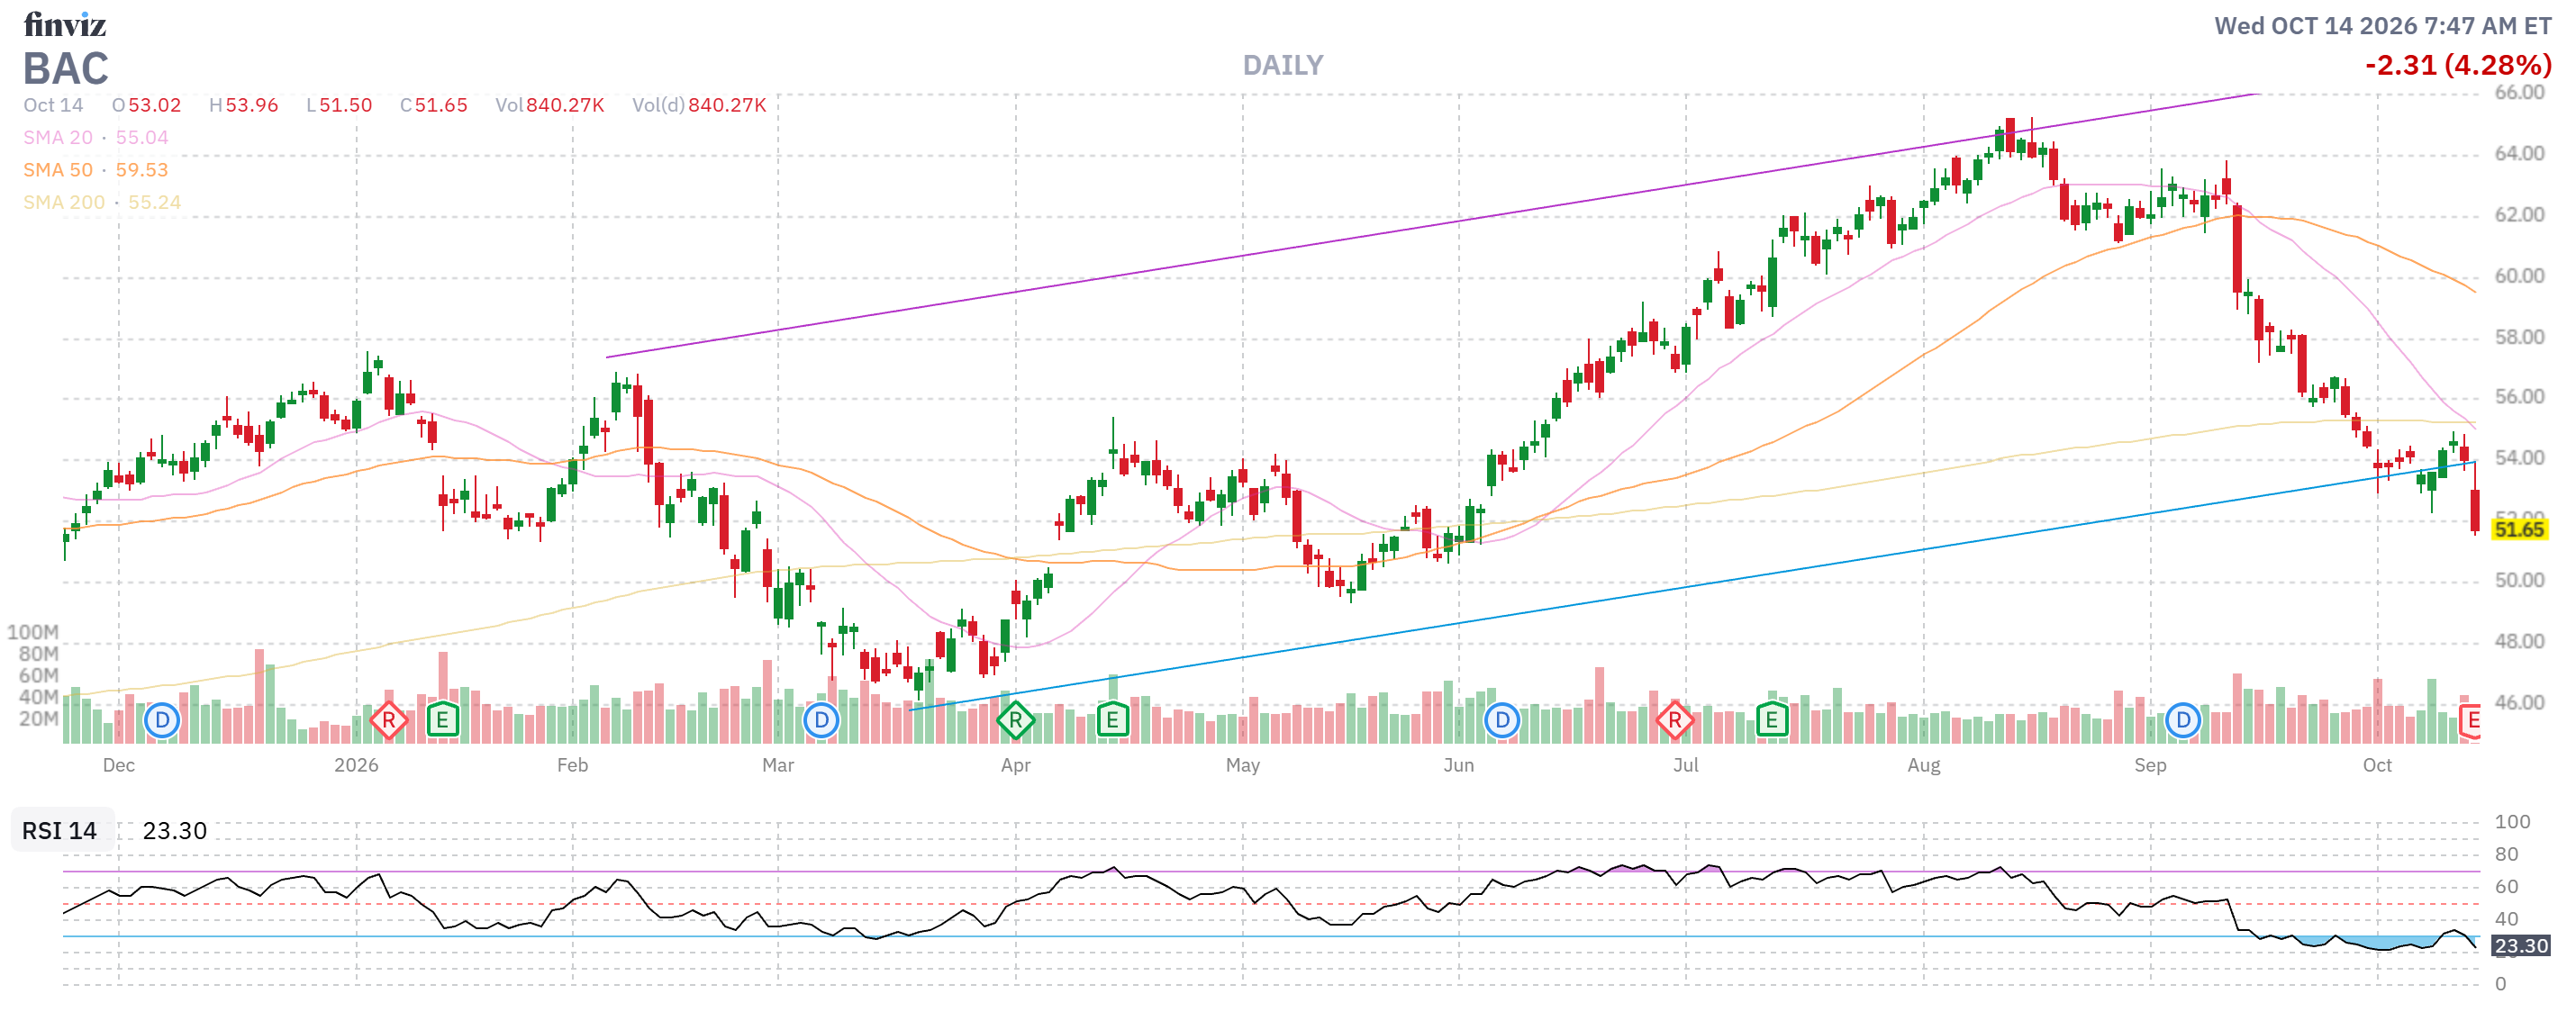
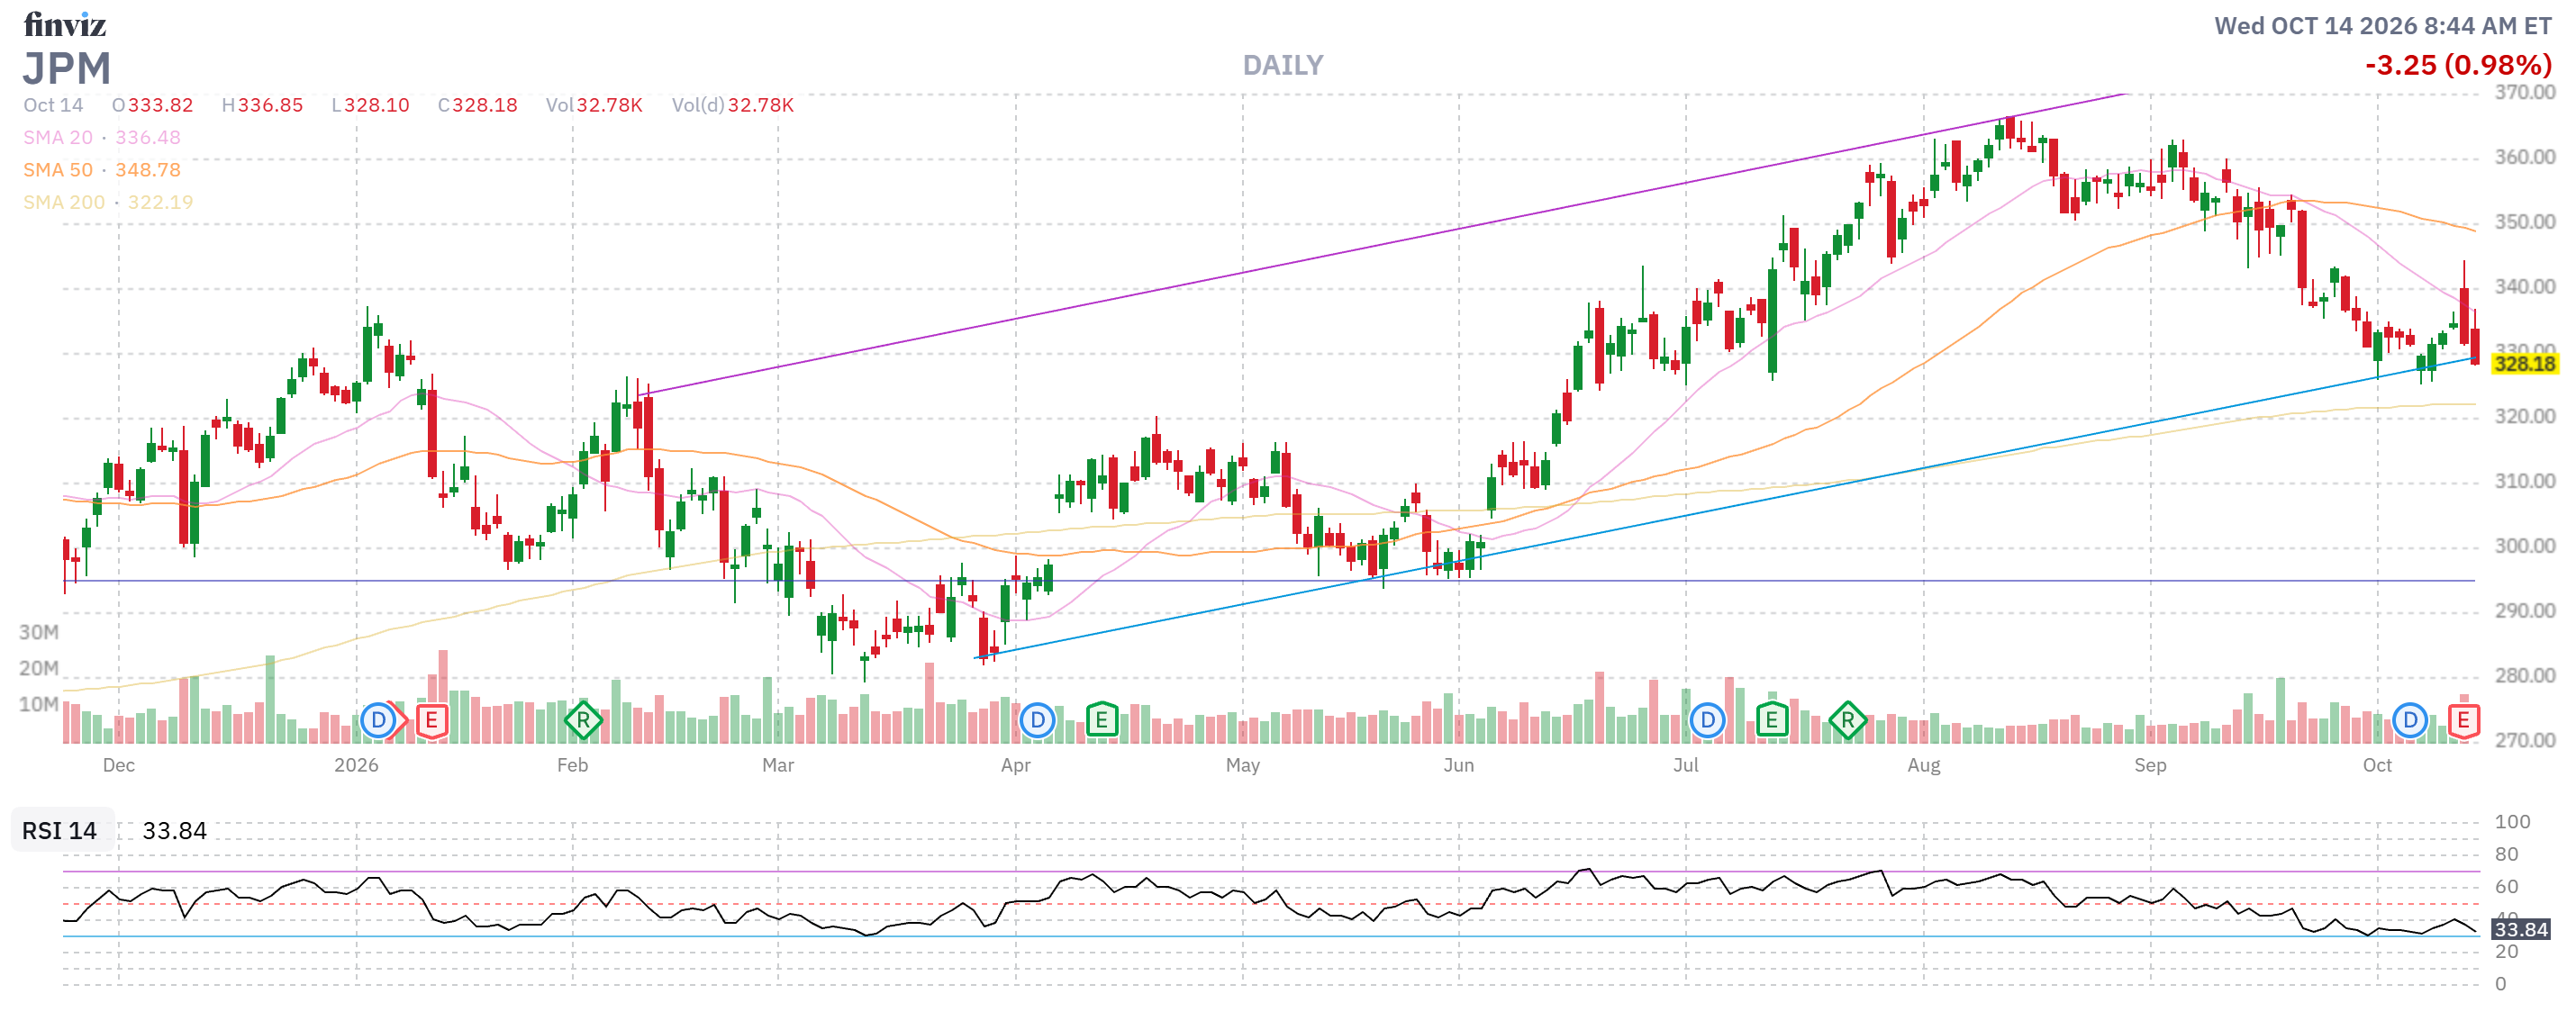
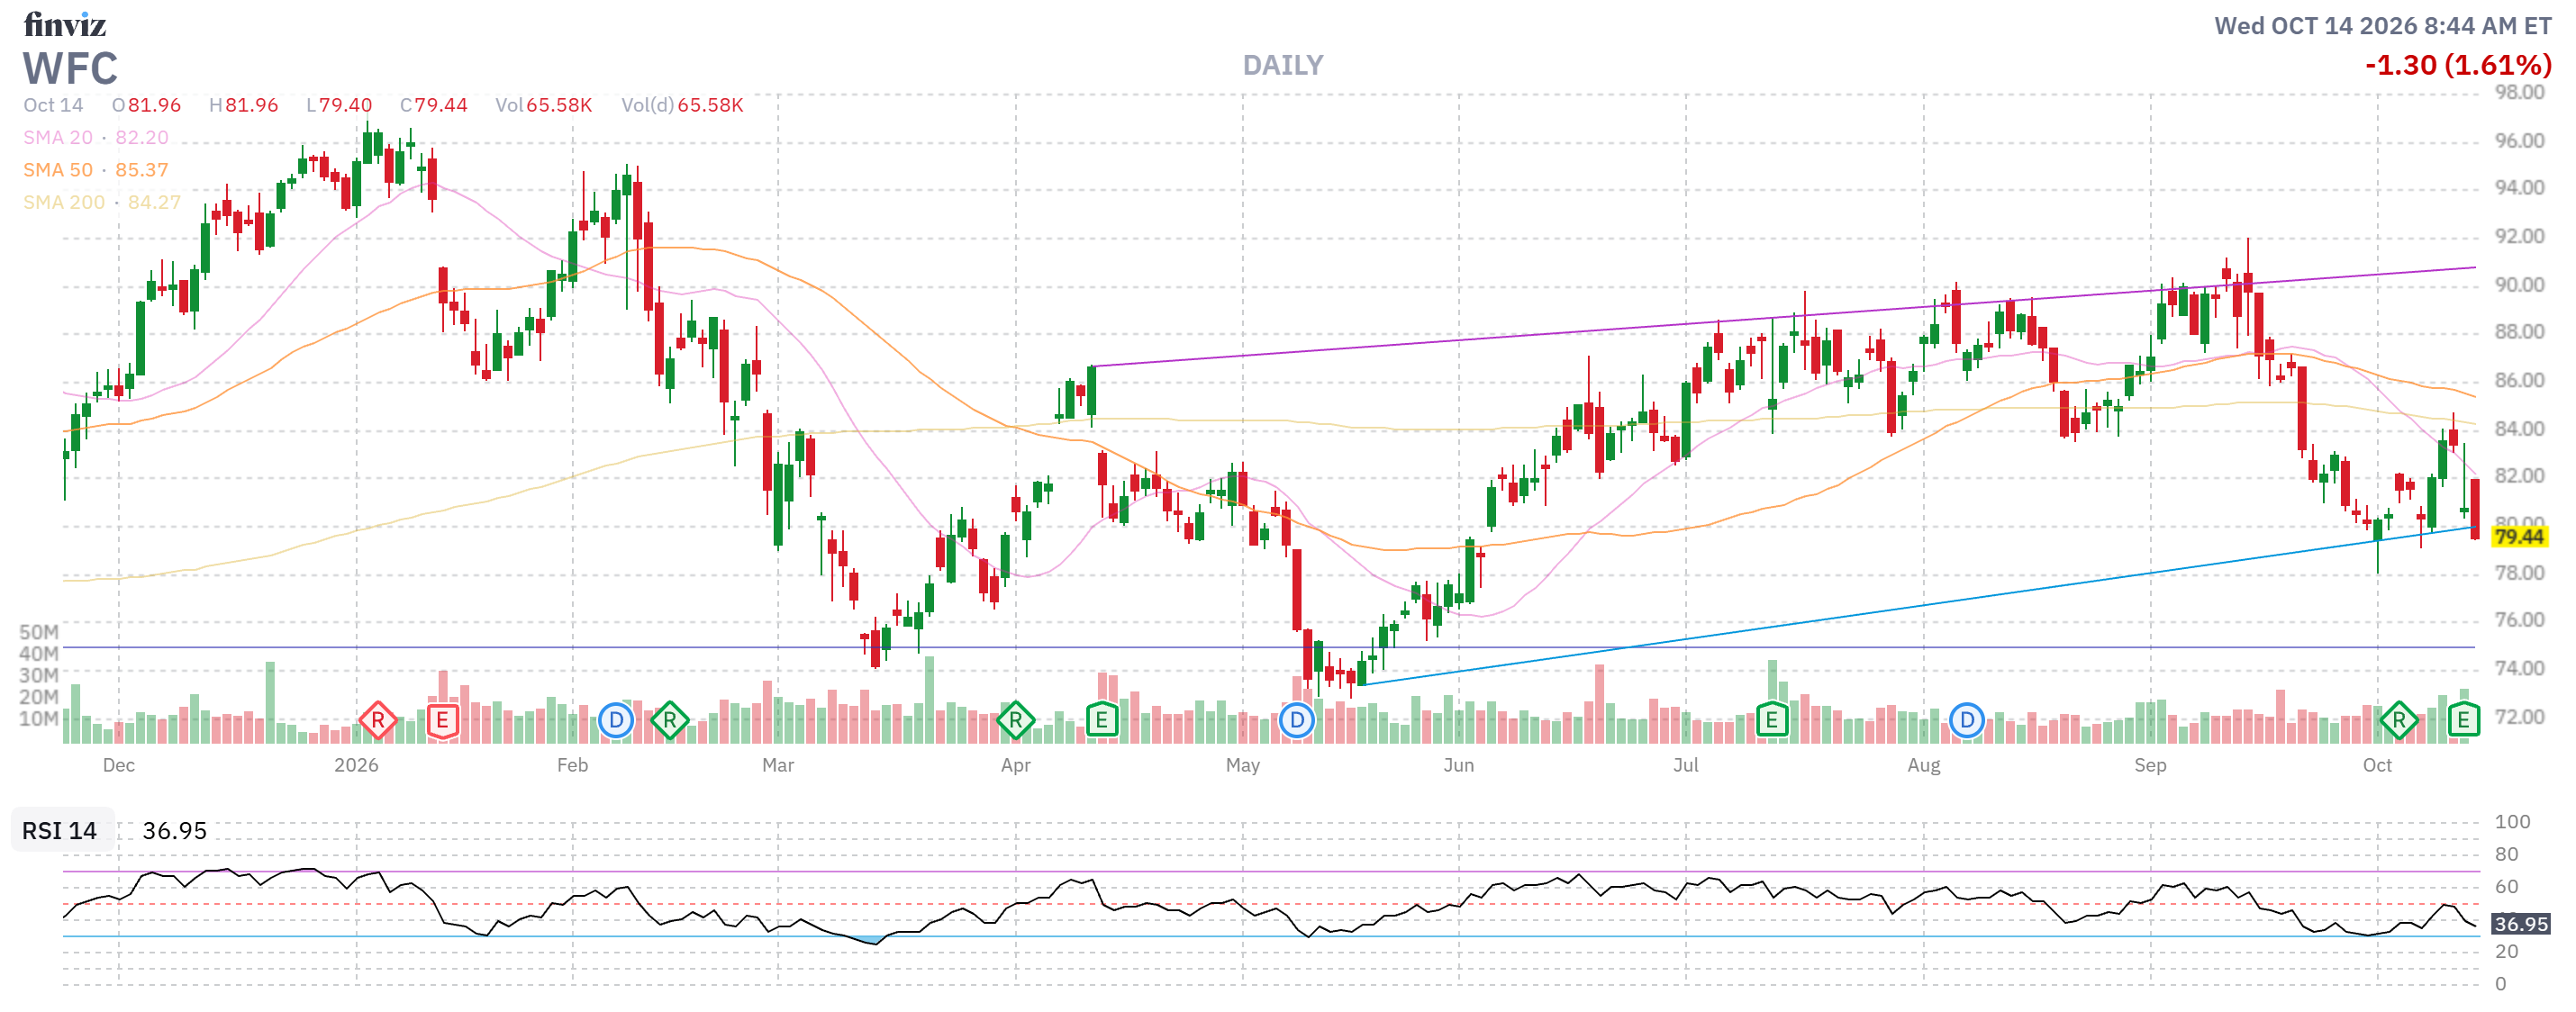
JPMorgan (JPM), Wells Fargo (WFC) & Bank of America (BAC) are feeling the squeeze: Despite a 49% jump in equities trading revenue, JPMorgan posted a rare top-line miss yesterday ($15.3 billion net income, $5.57 EPS), dragged down by a significant securities loss, rising costs and slower investment banking dealmaking. Wells Fargo slipped over 3% after missing on revenue ($21.9 billion, down 3% sequentially from Q2).
-
-
-
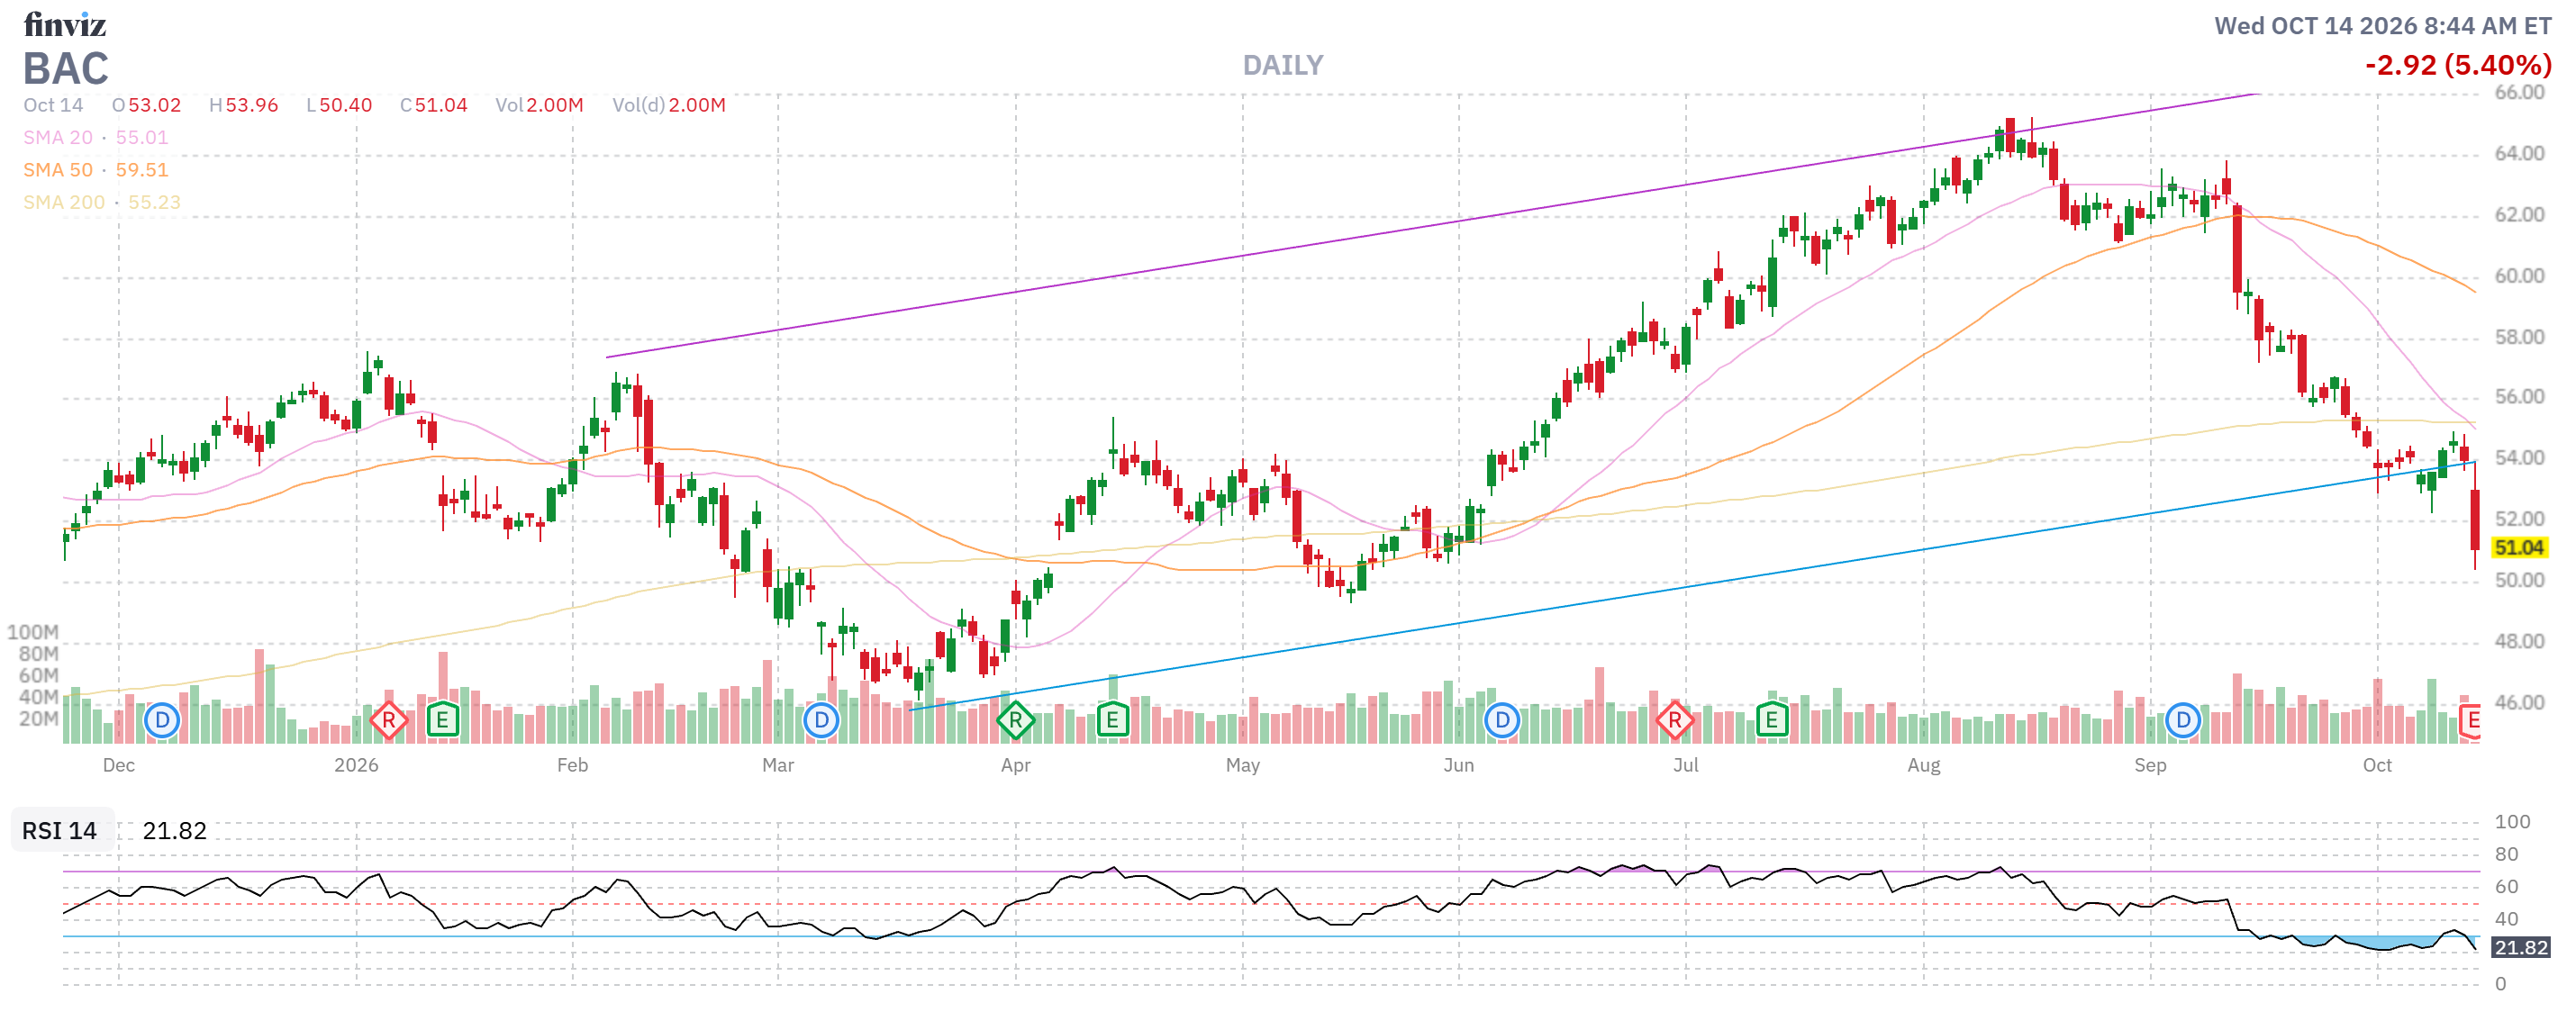
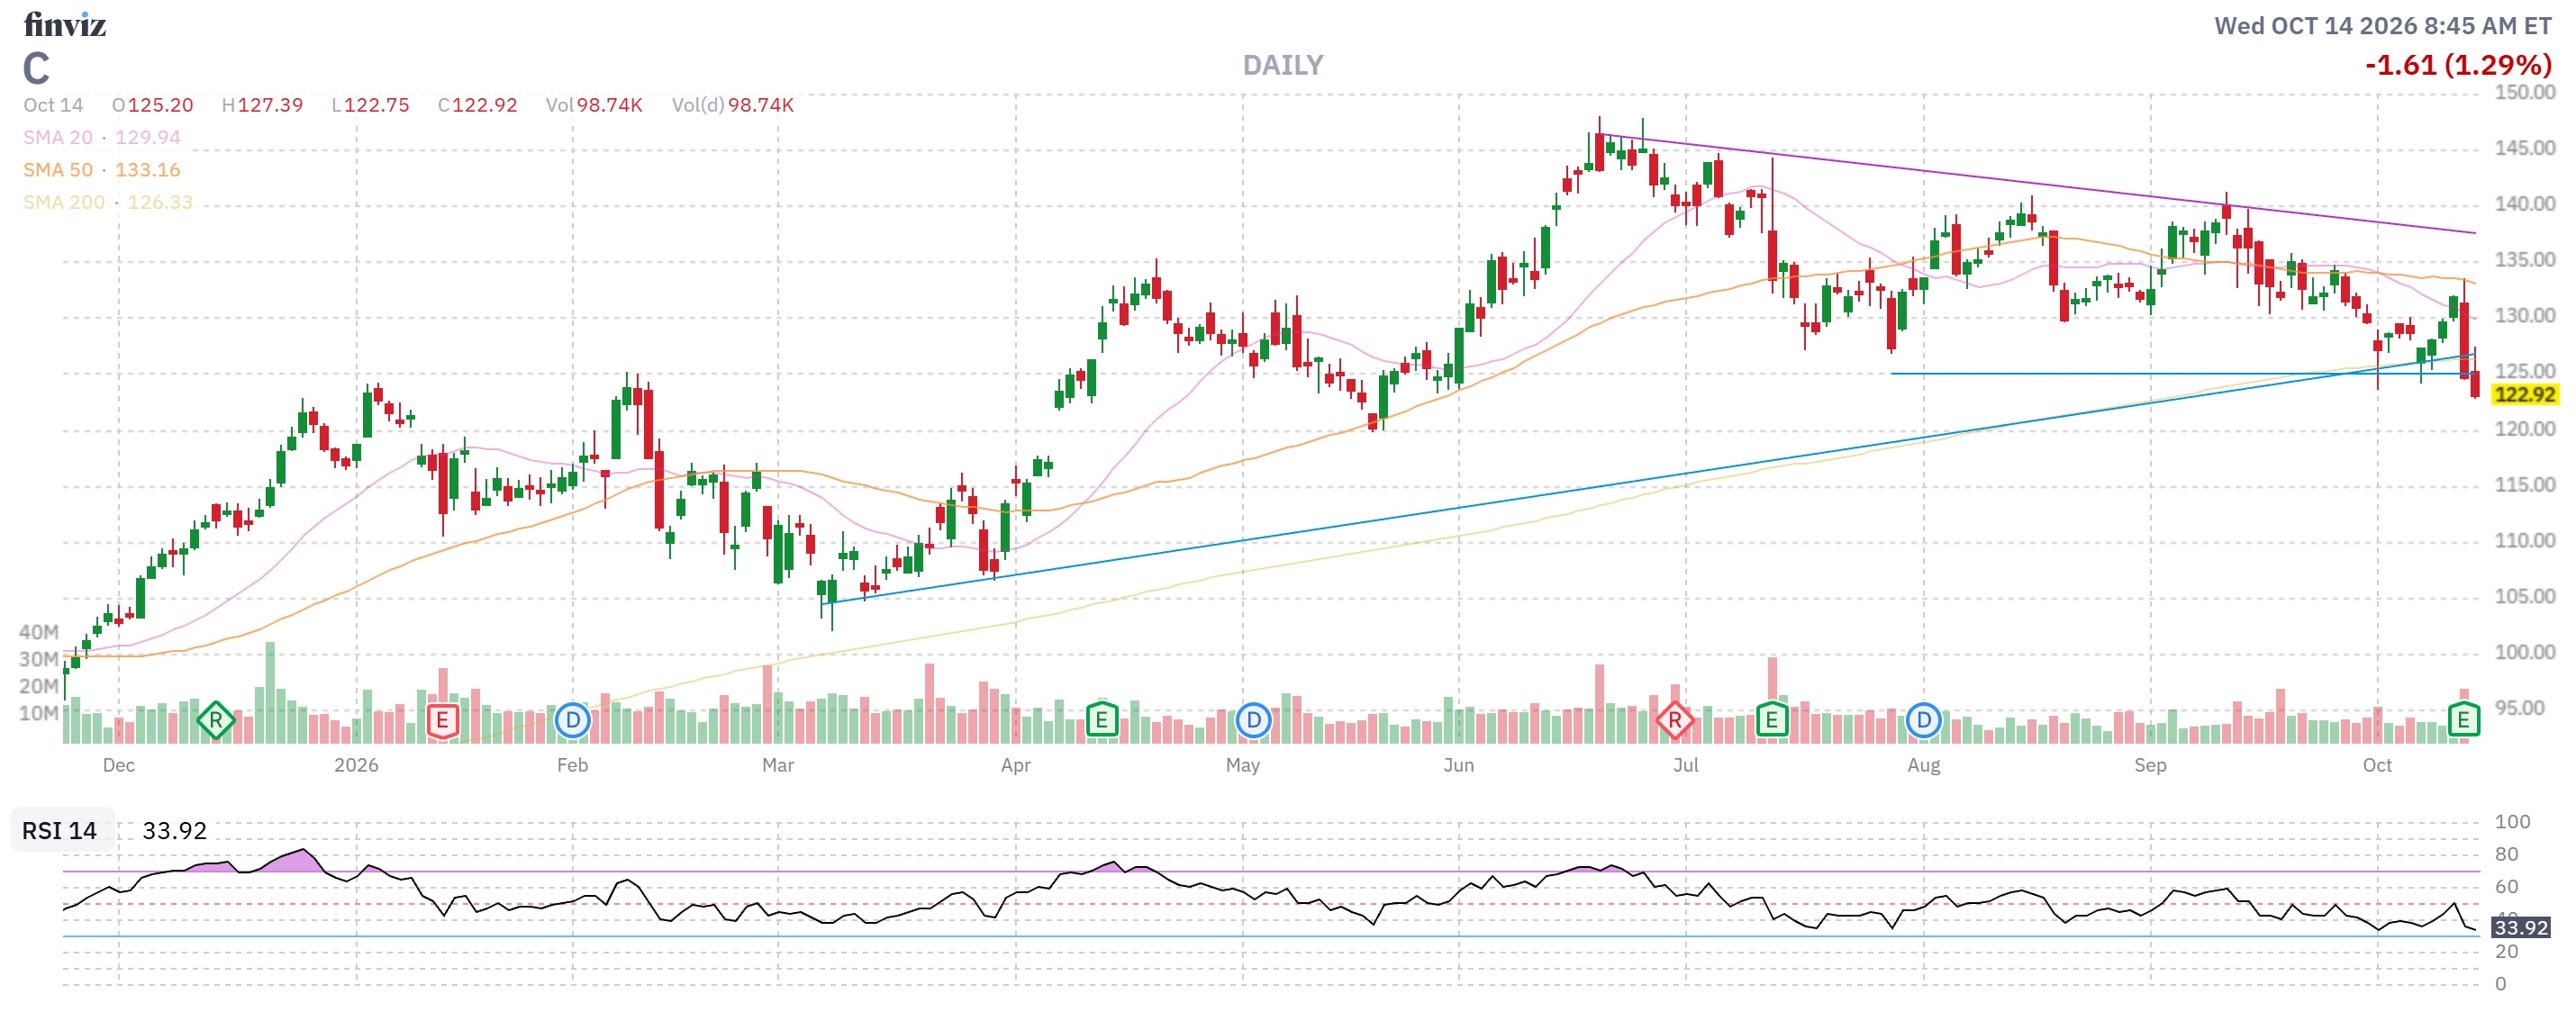
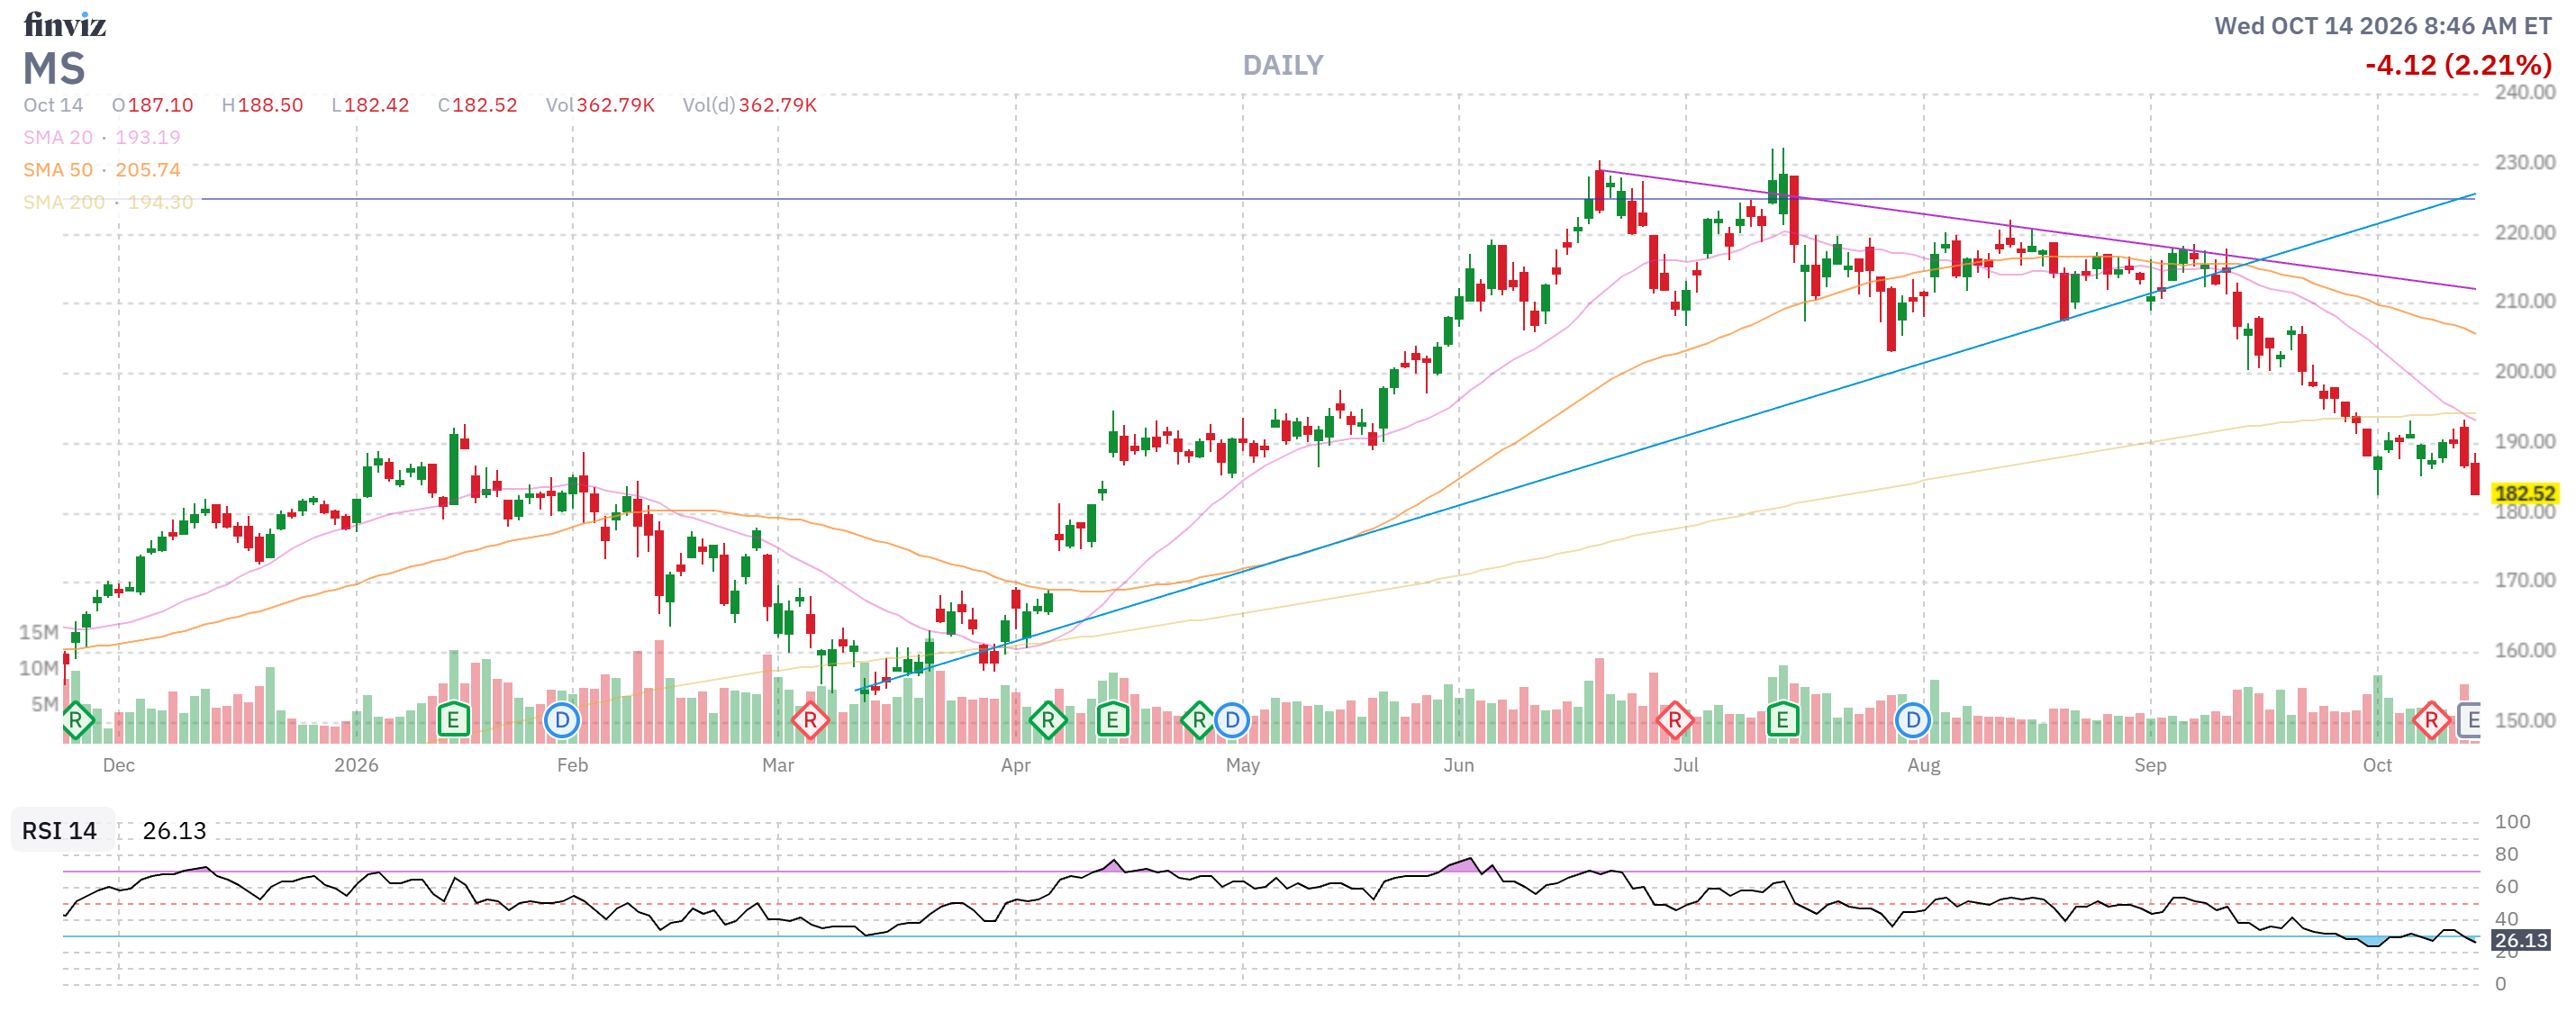
This morning’s red flag from Bank of America (BAC): Right before 7:00 AM today, BofA posted an outright miss on both lines, reporting $1.08 EPS (missing the $1.16 estimate) and $29.96 billion in revenue (missing expectations by about $1.36 billion). Meanwhile, Citigroup (C) actually beat EPS estimates ($2.85 vs. $2.41 expected) yesterday, yet the stock still got hammered for a 5.6% loss as the market sold the news across commercial lenders. Morgan Stanley (MS is dropping its numbers around 7:30 AM ET to test whether its $10 trillion wealth management machine can mirror Goldman and BlackRock.)
-
2. ASML Proves the AI Capex Boom Isn’t Slowing Down
-
-
-
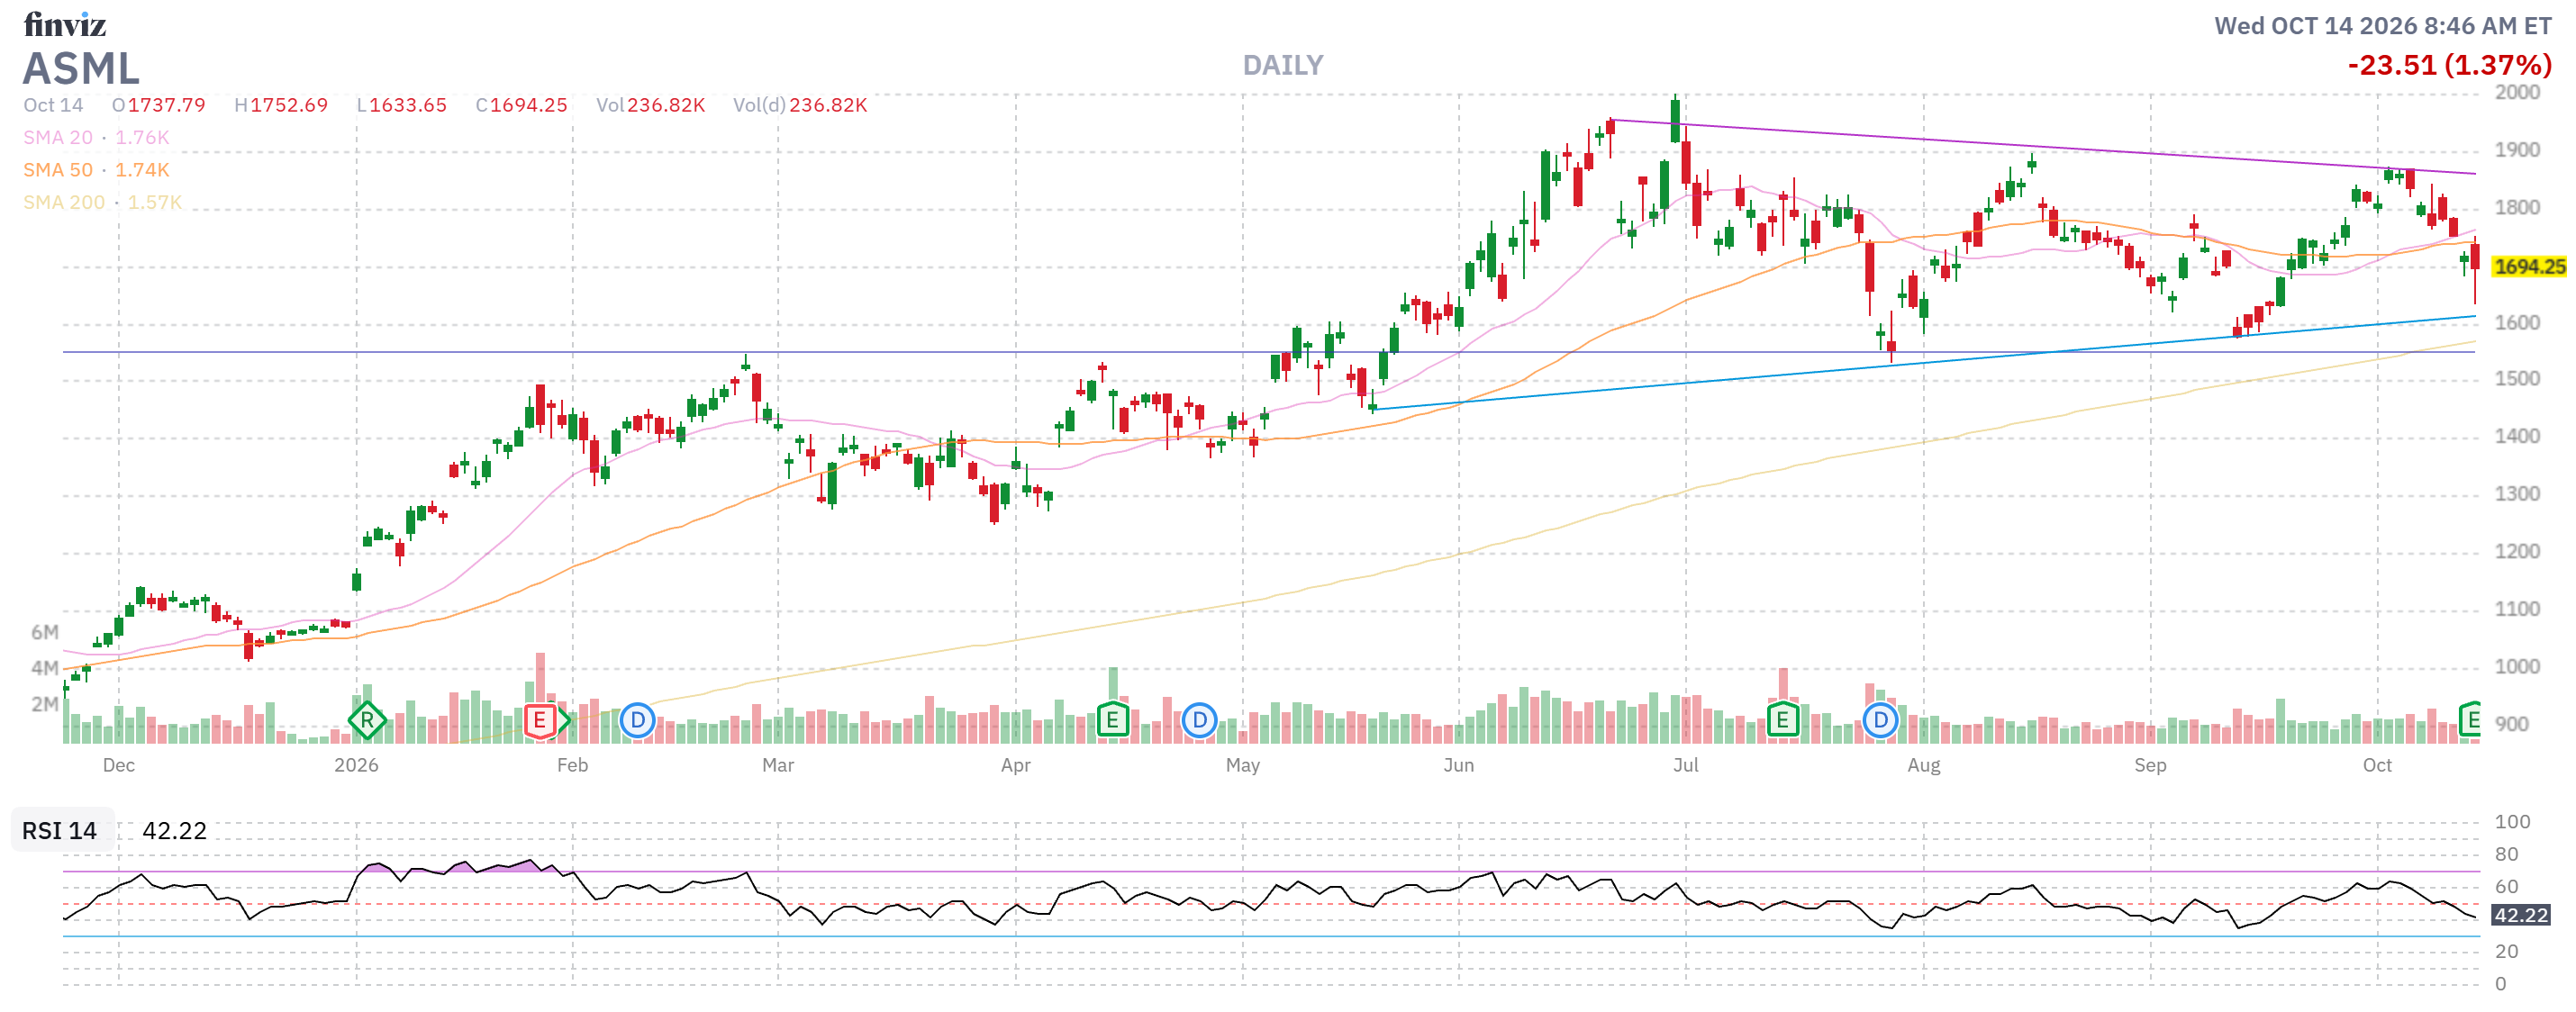
Massive Sequential Jump: Q3 total net sales hit €11.66 billion (up from €9.33 billion in Q2) with net income surging to €4.96 billion (€12.95 EPS vs. €7.59 in Q2). Gross margins expanded by 350 basis points in a single quarter from 54.0% to 57.5%, and they shipped 113 new lithography systems compared to 86 last quarter.
-
Blockbuster Q4 Guidance: They guided Q4 net sales to €14.2 billion to €15.2 billion at a ~57% gross margin, putting full-year 2026 sales at €44 billion to €45 billion. They also warned that planned equipment supply may actually trail demand in 2027 and 2028, with customers already lining up for 2030 delivery slots.
-
-
3. Healthcare & Geopolitical Crowding Out: The J&J Warning
-
-
-
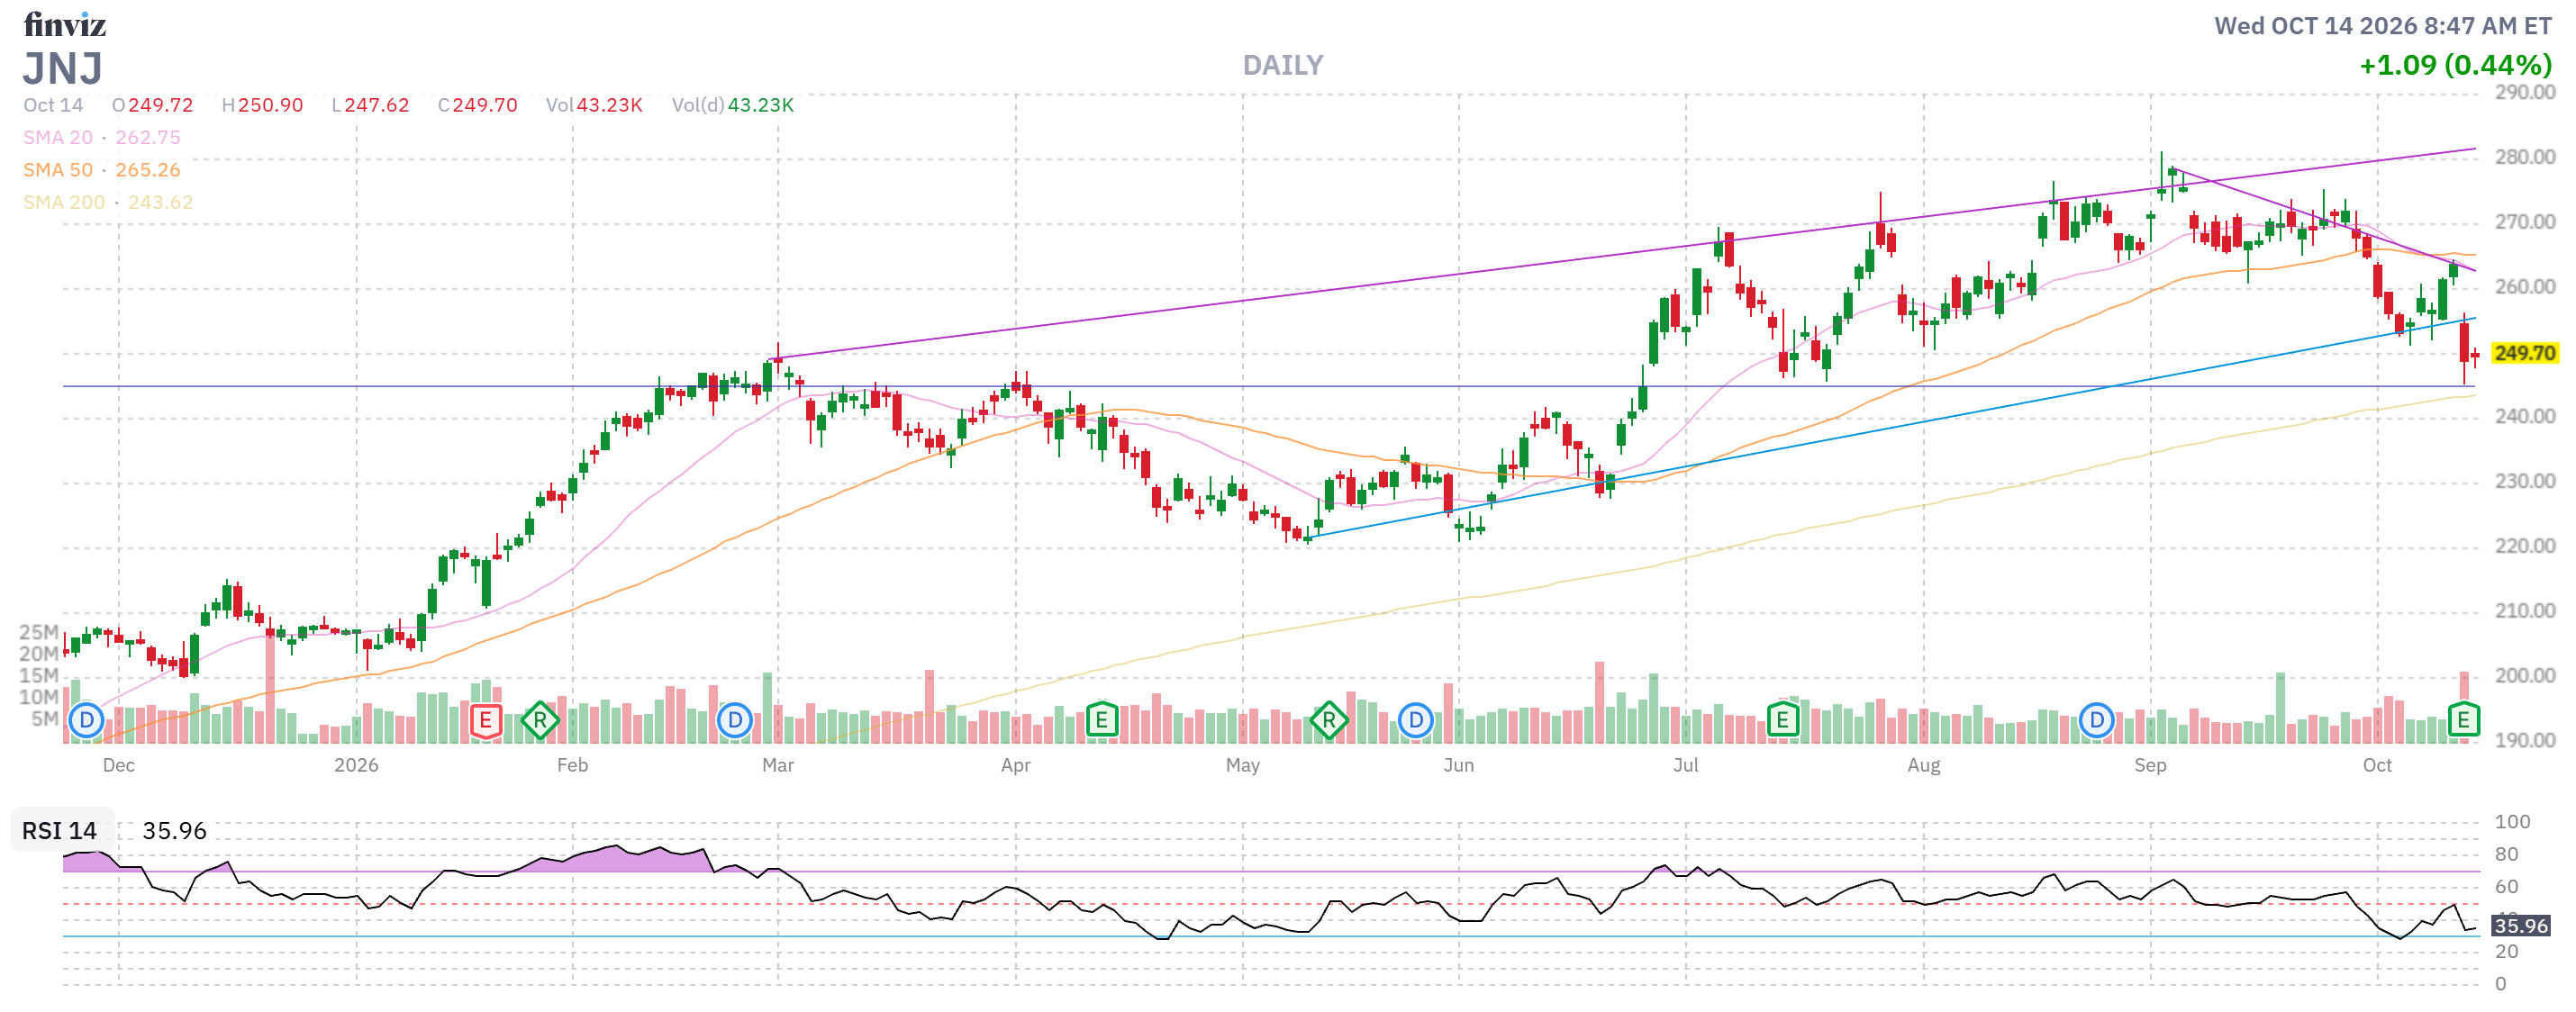
Why it sold off: First, JNJ is priced at over 22x adjusted earnings and nearly 29x free cash flow, which leaves zero margin for error when top-line growth is around 7%. Second, its MedTech segment missed estimates ($8.64 billion vs. $8.74 billion expected), with surgical revenues actually shrinking 0.6% YoY.
-
The Macro Tell: On the call, JNJ’s CFO dropped a fascinating geopolitical data point, noting that international MedTech sales were weak in the Middle East not because patient demand disappeared, but because sovereign budgets in surrounding countries are actively shifting money away from healthcare and into defense spending.
-
-
Summary Scorecard of Key Reports So Far
| Company | Q3 EPS (Actual vs. Est.) | Q3 Revenue | Key Takeaway & Market Reaction |
| Bank of America (BAC) | $1.08 vs. $1.16 (Miss) | $29.96B (Miss by $1.36B) | Reported this morning; big top-and-bottom-line miss shows NII and lending pressure. |
| BlackRock (BLK) | $15.93 vs. $13.97 (Beat) | $7.75B (+19% YoY) | Reported this morning; $205B in Q3 net inflows and expanding 47.8% operating margins. |
| ASML Holding (ASML) | €12.95 (vs. €7.59 in Q2) | €11.66B (+25% QoQ) | Reported this morning; 57.5% gross margin and massive €14.2B–€15.2B Q4 revenue guide. |
| JPMorgan Chase (JPM) | $5.57 ($15.3B Net Inc.) | Missed consensus | Equities trading jumped 49%, but securities losses and slower IB dealmaking weighed. |
| Goldman Sachs (GS) | $5.29B Net Earnings (+30% Beat) | $18.68B (2nd best ever) | The clear Wall Street winner yesterday; trading desks thrived on market volatility. |
| Wells Fargo (WFC) | $1.87 (+13% YoY) | $21.9B (-3% QoQ) | Thin EPS beat masked a sequential revenue drop; shares fell over 3%. |
| Johnson & Johnson (JNJ) | $2.59 vs. $2.53 (Beat) | $25.4B (Beat) | Raised FY26 guidance, but shares plunged 5.7% on MedTech miss and rich 22x+ multiple. |
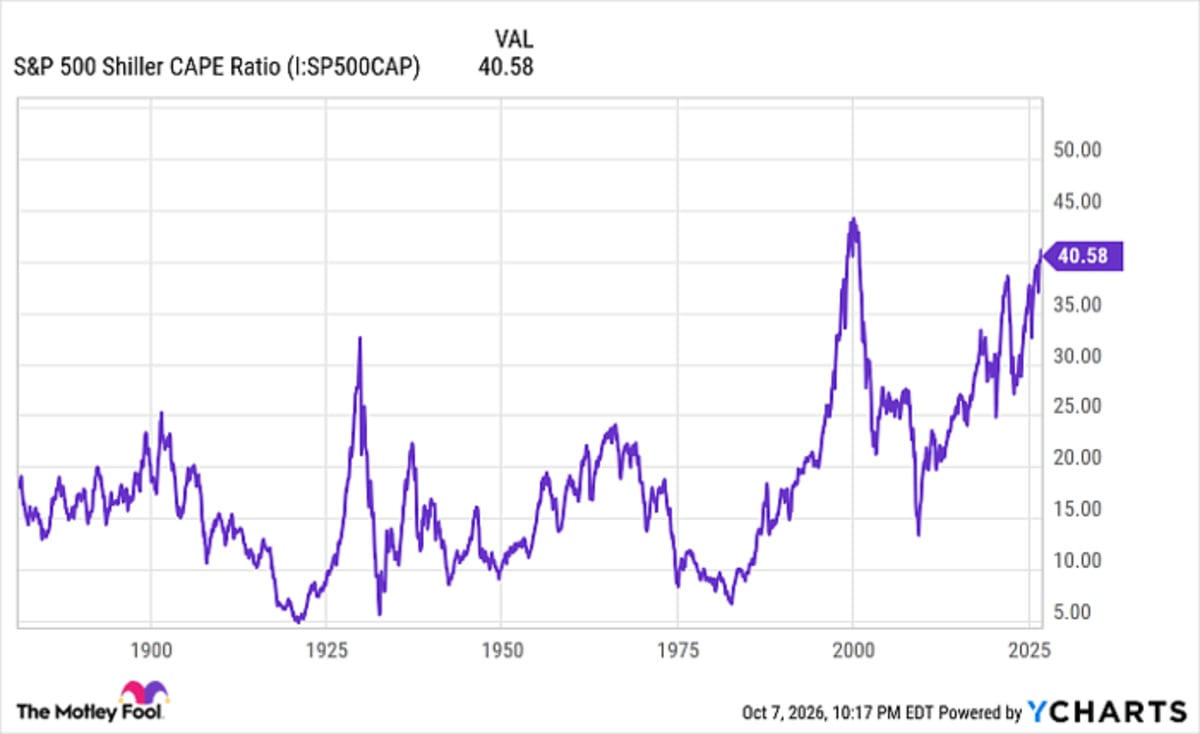
What is the core issue here? That’s actually fairly simple: Companies CAN’T keep growing at the implied forward Revenue and Earnings rates because the Global Economy isn’t growing fast enough to support it. This is not philosophy – it’s MATH!!! The Shiller CAPE Ratio measures the average ACTUAL earnings of the past 10 years and those earnings CREATE the current GDP – they are driving GDP growth – not the other way around!

Currently we’re well over 40x ACTUAL earnings – a level not hit since the 1999 dot com bubble and, before that, 30x ACTUAL earnings preceded the 1929 crash (October, in fact) that triggered the Great Depression. If you’ve been reading PSW
IN PROGRESS

