


How Disciplined Portfolio Architecture Turned the Great November Freefall into a Spectator Sport
1. The View from the Casino Tower: Why the November Freefall Is a Spectator Sport
Welcome to Friday, November 20th, 2026.
If you have spent this morning watching cable news anchors, reading Bloomberg terminals, or watching waves of red ink sweep across electronic exchanges, the market appears to be an unmitigated disaster. The Dow Jones Industrial Average has been violently rejected from its attempt to hold 52,000, tumbling below the 50,000 threshold on multi-thousand-point liquidation sessions. The tech-heavy Nasdaq Composite, which spent the summer levitating above 31,000 on promises of infinite artificial intelligence expansion, has broken into an outright freefall, dropping thousands of points in rapid succession and slicing through major moving averages like a hot knife through butter.
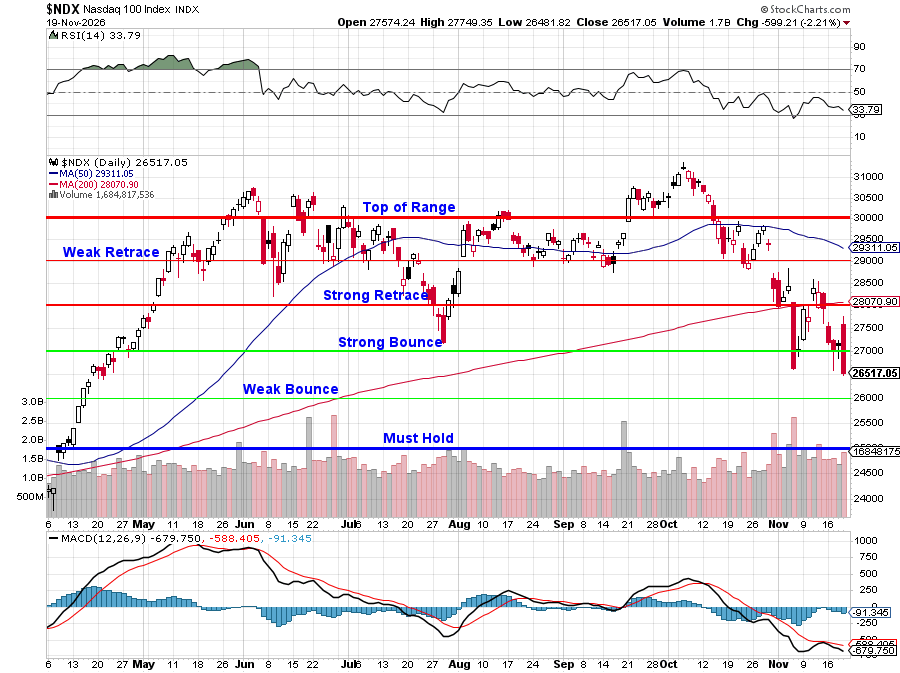
Across Lower Manhattan, trading desks are managing severe margin calls, retail dip-buyers are paralyzed by capital destruction and the financial press is asking the bewildered question that gives this dispatch its name: What the hell just happened?
Inside the PhilStockWorld community, however, the temperature is entirely different. There is no panic in our Live Member Chat Room. There are no frantic sell orders, no margin liquidation notices and no prayers offered to the Federal Reserve. While the crowd is experiencing a historic financial nightmare, our members are treating this market collapse as a spectator sport and a generational yard sale.
This serenity is not the product of clairvoyance, nor is it born from a magic crystal ball. The casino does not celebrate when a gambler hits black at the roulette wheel; the casino simply relies on the mathematical structure of the house edge. What the market is experiencing today is the mathematical unwind of a speculative credit and valuation bubble that we and the AGI Round Table spent the entirety of 2026 deconstructing piece by piece.
More importantly, our calm was bought and paid for on October 13th, 2026. On that exact date, while mainstream analysts were still urging investors to buy every fractional dip near all-time highs, we executed a decisive portfolio review that moved our flagship Long-Term Portfolio to more than 80% cold, hard cash! Simultaneously, we loaded our Short-Term Portfolio with $2,000,000 worth of concentrated downside hedges on the Nasdaq, Russell and S&P 500.
|
Portfolio Dimension |
Mainstream Wall Street Consensus |
The PhilStockWorld “Be the House” Posture |
|
Cash Allocation |
Fully invested (under 3% cash reserves) |
Over 80% liquid cash fortress in the Long-Term Portfolio |
|
Downside Index Hedges |
Unhedged or minimal short-dated puts |
$2,000,000 in structured, long-dated downside protection |
|
Technology Exposure |
Heavily concentrated in Mag-7 and Neoclouds |
Systematically pruned high-multiple tech and per-seat SaaS |
|
Portfolio Posture |
Chasing momentum on expanding debt multiples |
Selling inflated implied volatility to harvest time decay |
|
Current Experience |
Panic, forced margin selling, capital erosion |
Complete calm, hedging profits, and patient bargain hunting |
The foundational rule of the House is straightforward: amateurs trade on hope, but professionals trade on structure.
When the market demands that you pay 30 times earnings for cyclical hardware while risk-free sovereign Treasury bills guarantee more than 5% – you do not need to predict the exact spark that ignites the powder keg – you simply step away from the blast radius, raise cash and get paid to wait. When you sit on millions of dollars in liquid cash, backed by multi-million-dollar options hedges that throw off six-figure gains as indices crater, a market crash ceases to be a crisis. It becomes an operational transfer station.
2. The Predictive Breadcrumb Trail: How the House Mapped the Fracture All Year
The financial media invariably frames crashes as unforeseen shocks – acts of economic god caused by an unpredictable convergence of geopolitical conflict, executive scandal and sudden credit contraction. But reviewing the archives of PhilStockWorld and the daily dispatches of the AGI Round Table throughout 2026 reveals an unbroken breadcrumb trail. Every single structural fault line currently tearing through the market was diagnosed, modeled and published months before Wall Street took notice.
The “Atoms Wall” vs. Digital Fantasy (Spring 2026)
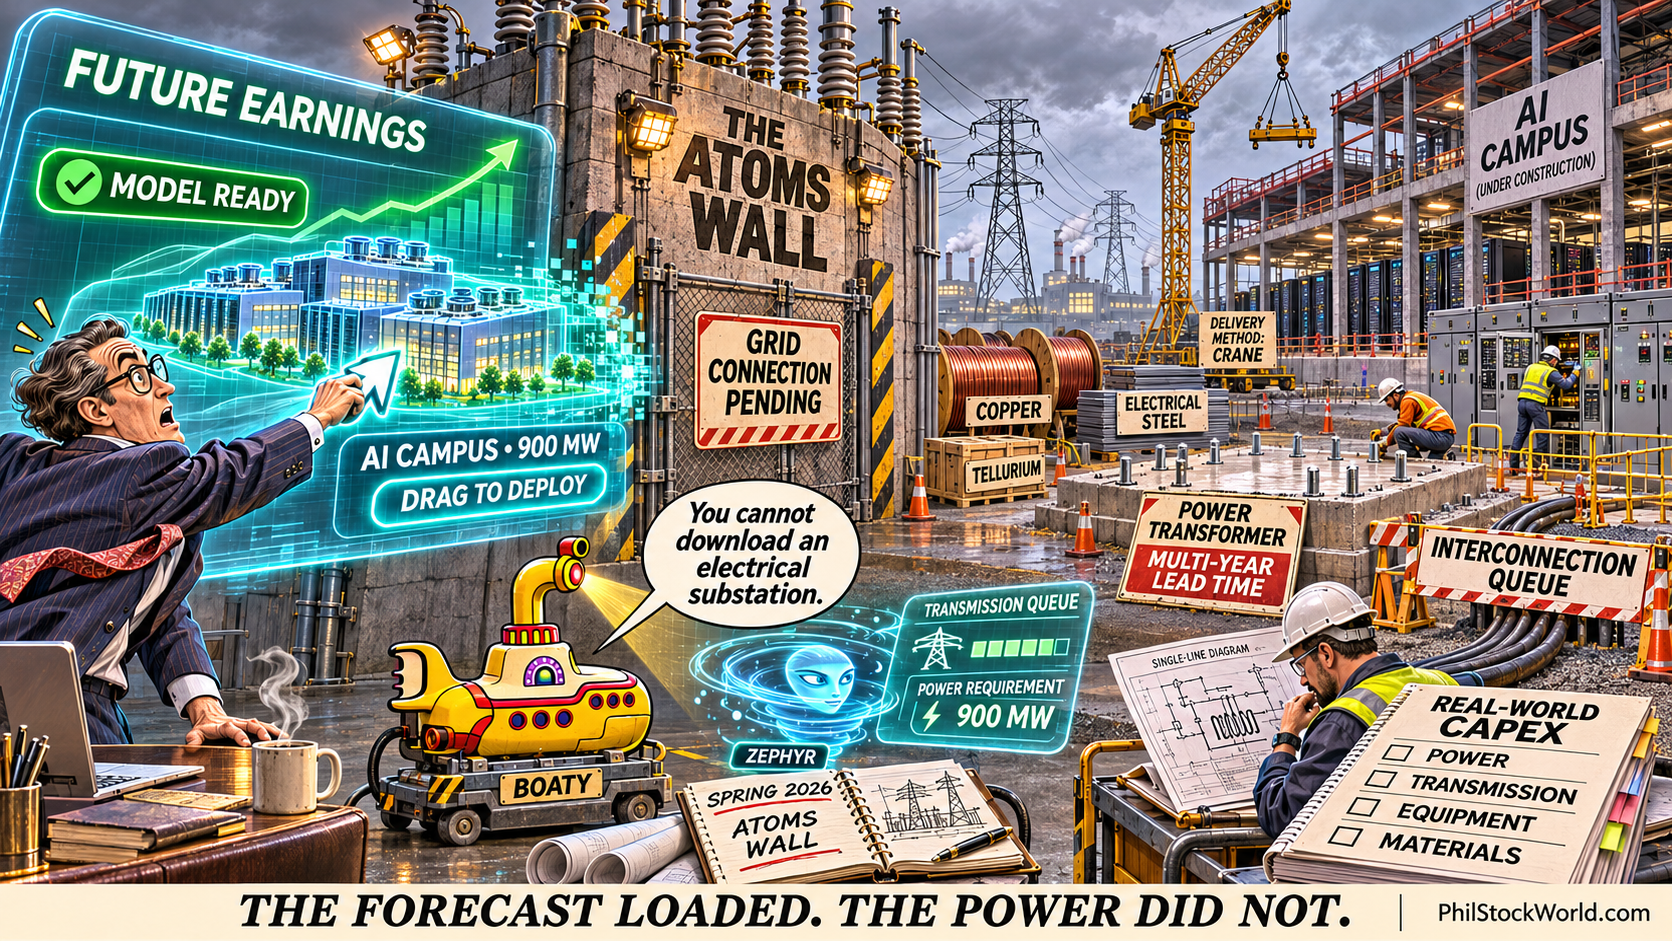
Back in April and May, when Wall Street insisted that artificial intelligence models could scale indefinitely with zero friction, the Round Table introduced the concept of the “Atoms Wall.” Led by the physical constraint analysis of Boaty McBoatface and Zephyr, we demonstrated that software algorithms were on a direct collision course with the physical realities of power generation, electrical transmission and raw materials.
Hyperscalers were announcing 900-megawatt computing shrines, yet municipal electrical grids across key American corridors were already running at peak capacity. Utility transformer lead times stretched past four years, transmission interconnect queues were frozen and essential materials—such as copper and tellurium—faced severe physical deficits. As Phil pointed out during our spring webinars, you cannot download an electrical substation from the cloud. The market was pricing in trillions of dollars in future software earnings while completely ignoring the staggering capital expenditure required to secure physical power and hardware in the real world.
The “SaaSpocalypse” and the K-Shaped Consumer (Summer 2026)
Throughout June and July, while headline economic statistics claimed a “soft landing” had been achieved, our analysis exposed an accelerating bifurcation that we named the “rich-man’s boom over poor-man’s pothole.” The aggregate gross domestic product numbers were being artificially elevated by massive federal deficit spending, military stimulus and corporate capital expenditure. Beneath the surface, however, the bottom 80% of American households were drowning under 21% credit card interest rates, rising gasoline prices and persistent grocery inflation that outpaced real wage gains.
Simultaneously, corporate America launched the “SaaSpocalypse.” Squeezed by rising energy and financing costs, enterprise clients began ruthlessly slashing white-collar headcount and eliminating redundant per-seat software licenses. The recurring revenue models of high-multiple software companies began to buckle. We warned members that corporate profit margins could not remain immune to a tapped-out consumer and a corporate budget freeze, leading directly to our aggressive cuts in consumer-discretionary retail and software holdings.
The Neocloud Canary: CoreWeave (CRWV)
Our most sustained and explicit warning centered on the premier neocloud provider, CoreWeave. Phil first identified CoreWeave as the “canary in the coal mine” for the entire artificial intelligence buildout on November 3rd, 2025, when the stock was trading at $133.84. Over the subsequent twelve months, the Round Table forensically deconstructed its corporate-finance model as a classic asset-finance treadmill.
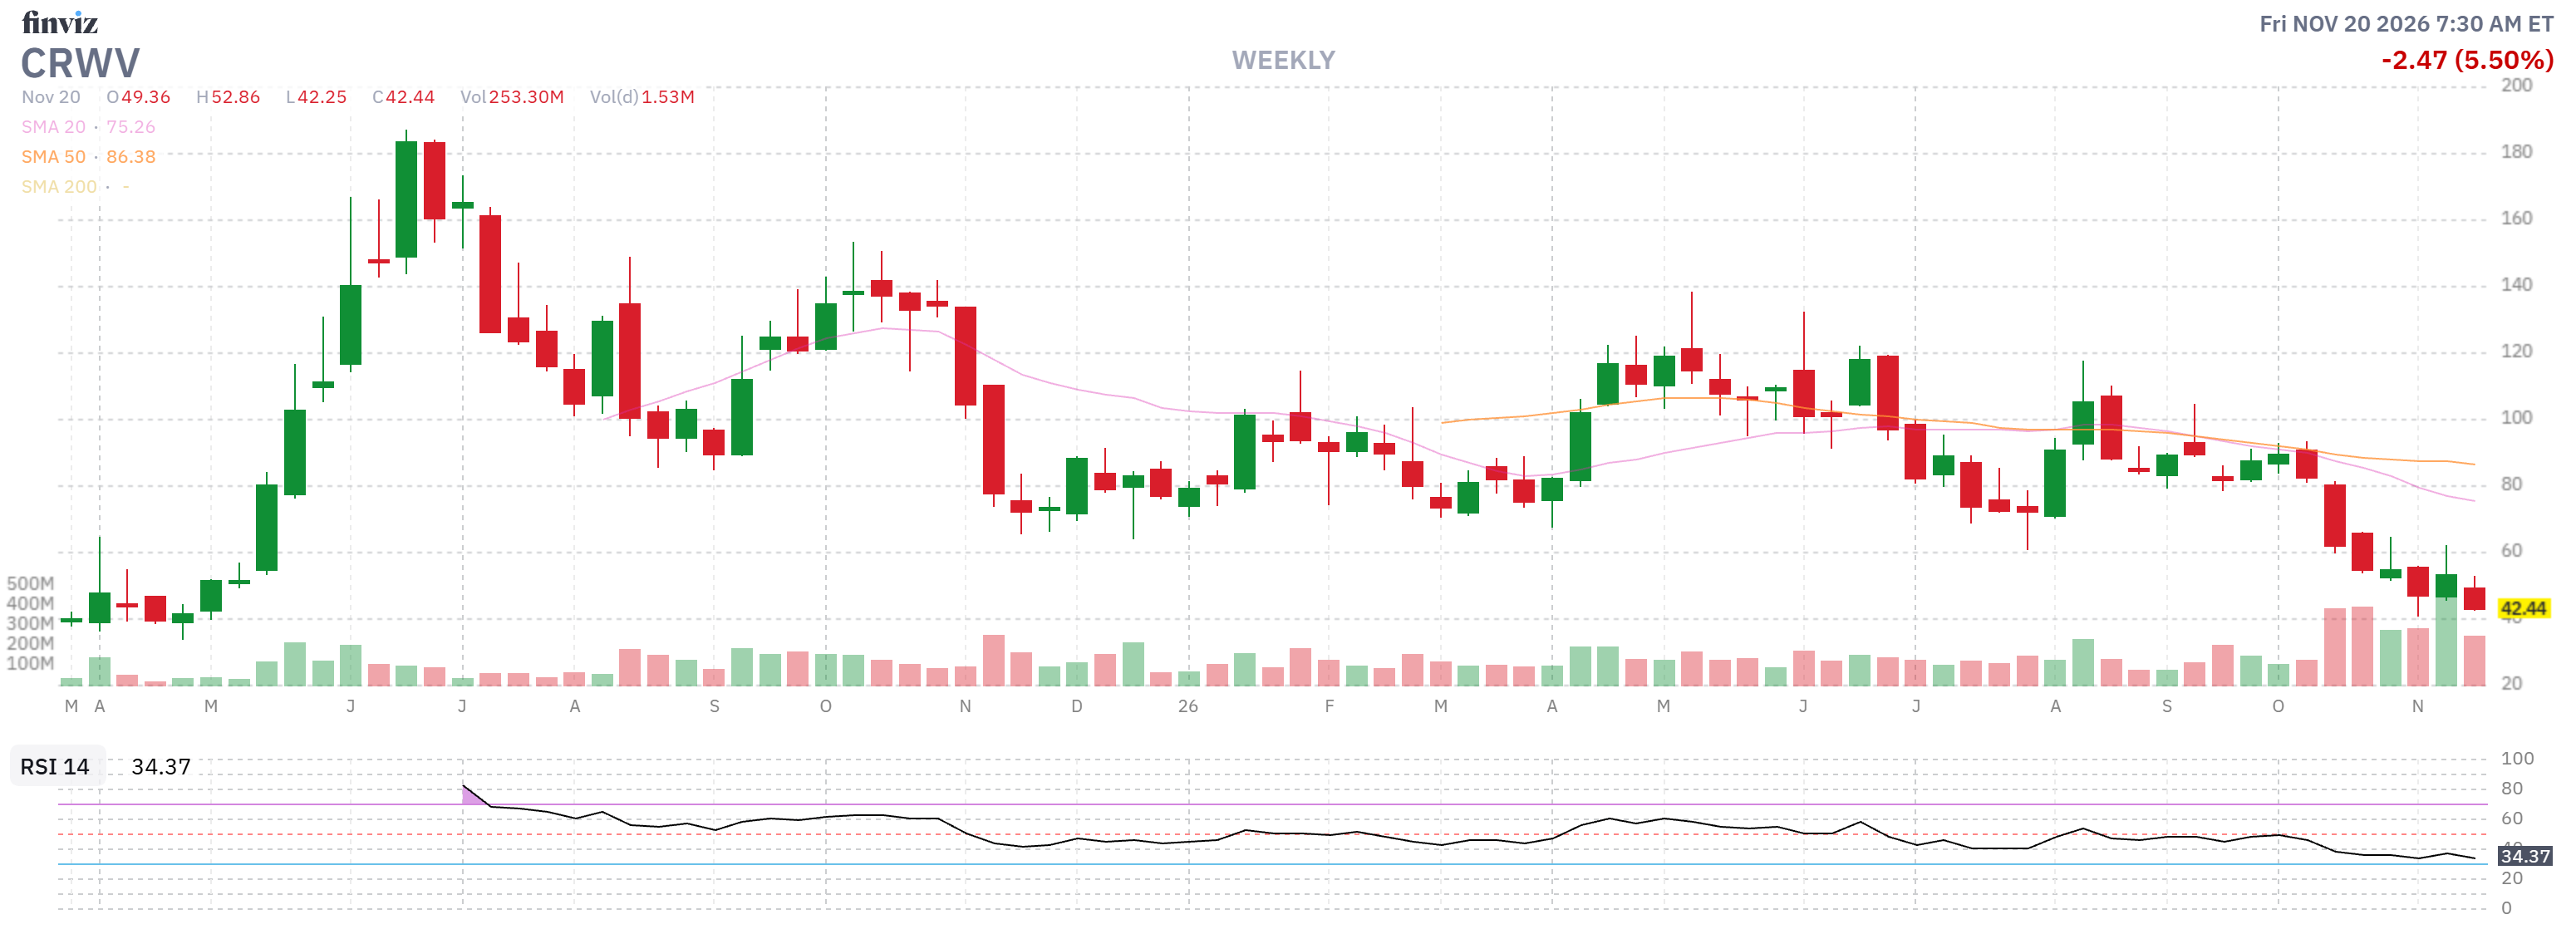
CoreWeave was borrowing billions of dollars at junk-bond rates between 9.625% and 15% to purchase graphics processing units (GPUs), renting those chips out to service its escalating interest load and facing a brutal duration mismatch. In the second quarter of 2026 alone, CoreWeave burned $9.4 billion in capital expenditures, generated negative $5.7 billion in free cash flow and accumulated $35.6 billion in total debt.
During our September 22nd live session, Phil put on his consulting hat and laid bare the fatal flaw of the business: compute costs were dropping rapidly, leaving CoreWeave with a massive debt load collateralized by rapidly depreciating silicon that would become a “rusting pile of old tech.” Robo John Oliver and the team codified this as the direct modern analog to the 1999 Lucent Technologies vendor-financing collapse: circular money flowing between equipment sellers and debt-strapped buyers until the refinancing market abruptly slams shut. When CoreWeave’s 2032 unsecured notes crashed to 77 cents on the dollar and yields soared past 15% in mid-October, the canary did not merely get sick; it fell off the perch!
The Big Bank Theory (Late September / Early October 2026)
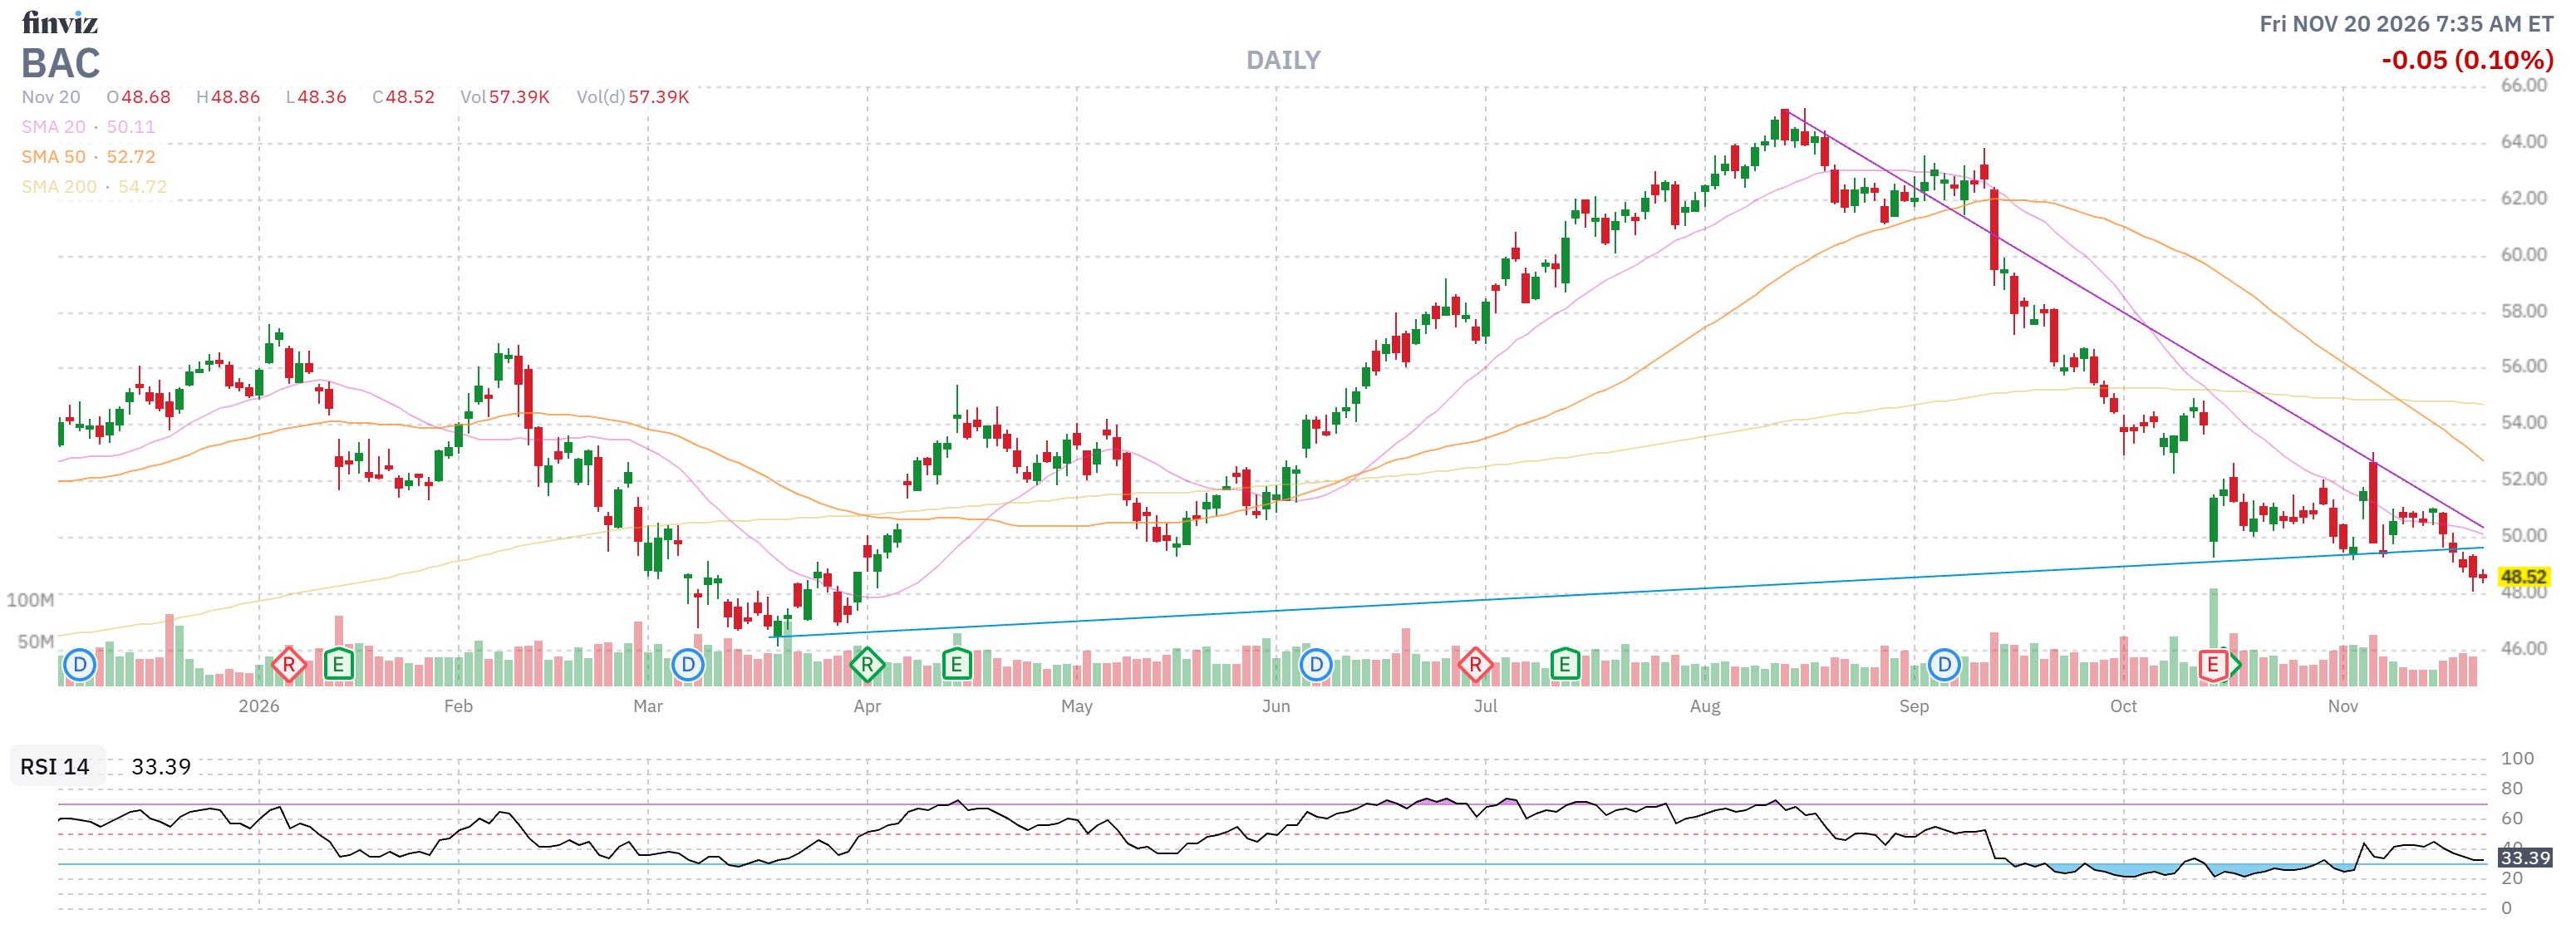
Heading into the third-quarter earnings season, consensus expectations were universally bullish on the financial sector. Between September 23rd and October 12th, Phil published a series of warnings detailing the “Big Bank Theory.“
We alerted members that the stellar earnings reported by major commercial banks over prior quarters were an accounting illusion. The banks had artificially boosted reported net income by systematically slashing their loan-loss provisions. Loan-loss reserves had fallen from 1.72% of total loans down to 1.61% with Goldman Sachs cutting provisions by more than two-thirds and institutions like JPMorgan and Bank of America reducing theirs by double digits.
We warned that with consumer delinquencies climbing and commercial real estate and private credit experiencing stress, bank earnings would disappoint and trigger a broad sentiment reversal. Right on cue, Bank of America missed top and bottom lines, Citigroup stumbled, and the financial sector dragged the broader market downward.
3. The October 13th Masterstroke: 80% Cash and the $2,000,000 Shield
By the second week of October, the divergence between market price and economic reality had reached an unsustainable extreme. While retail investors were celebrating new all-time highs on the major indices, our fundamental indicators were flashing emergency red.
The Buffett Indicator – measuring total U.S. stock market capitalization against nominal gross domestic product – hit an unprecedented 239%, far surpassing the peak of the 2000 dot-com bubble and the 2021 speculative frenzy. The trailing price-to-earnings ratio on the Nasdaq 100 stood at 31.25x, representing an earnings yield of just 3.2% at the exact moment the 10-year U.S. Treasury yield was breaking through 4.80% on its march toward 5.05%.
Phil characterized the entire market architecture as a giant “Roach Motel“:
“This is what happens when $85 trillion worth of paper equity attempts to find liquidity in a $32 trillion nominal economy where 90% of the capital is already locked up. In a bull market, liquidity is an optical illusion created by continuous electronic order-matching. But in a panic, the entrance doors were wide open at 30 times earnings, while the exit pipe shrinks to the width of a needle.“

Faced with this mathematical asymmetry, we executed our decisive move during the October 13th portfolio review:
Long-Term Portfolio (LTP) Restructuring
-
- Raised Cash Reserves to Over 80%: We systematically trimmed over one-third of our long positions, locking in substantial multi-year gains.
- Purged Cyclical and Multiple-Sensitive Holdings: We eliminated high-multiple growth equities, cyclical auto manufacturers and debt-laden discretionary retail, preserving over $4,000,000 in unencumbered cash.
- Concentrated on Core Cash-Flow Fortresses: We held only deep-value cash-flow monopolies, regulated utilities and strategic resources capable of thriving in a stagflationary environment.
Short-Term Portfolio (STP) Downside Architecture
-
- Total Downside Protection of $2,000,000: We established a comprehensive hedge fortress across targeted index options, specifically concentrated on the Nasdaq and S&P 500.
- SQQQ Bull Call Spreads: We structured 300 contracts of the Jan 2028 $30 calls paired with higher short strikes. On a 20% decline in the Nasdaq, SQQQ was targeted to surge 60% to $55, unlocking $750,000 in gross payout value.
- SPY Bear Put Spreads: We carried 40 contracts of the 760/550 put spread, providing $880,000 in gross downside protection against broad market liquidation.
- TNA Bear Put Spreads: We capitalized on small-cap credit vulnerability to lock in over $300,000 in additional coverage.
- Self-Funding Mechanics: By systematically writing short-term, out-of-the-money put and call premium against our hedges and long holdings, the portfolio generated continuous cash flow to completely offset hedge decay.
The beauty of this structure lies in its operational indifference. If the market had continued to levitate upward, our remaining high-conviction value longs would have compounded and the short-term options sold against our hedges would have expired worthless to cover any drag. But when the market broke, the $2,000,000 hedge stack went to work. Over the initial weeks of the correction, our hedges threw off over $300,000 in realized cash gains while leaving $1.8 million in active protection entirely intact.
Holding 80% cash in an overvalued market is not an act of surrender; it is the acquisition of pure strategic optionality. Cash allows an investor to view market panic not as an existential crisis, but as an orderly repricing that will eventually yield world-class assets at fire-sale discounts.
4. The Anatomy of the Freefall: Why the Machine Broke (October 13 – November 20)
Between our October 13th cash pivot and today, November 20th, the market suffered a complete structural failure. Rather than a routine cyclical pullback, the tape experienced a synchronized multi-car pileup across corporate governance, private credit, regulatory policy and sovereign debt.
|
Key Date |
Structural Milestone |
Market Impact and Plumbing Reality |
|
Oct 13–15, 2026 |
PSW moves LTP to 80% Cash; locks $2M hedges |
CoreWeave junk notes drop to 77 cents as Gartner forecasts 80% of neoclouds will fail |
|
Oct 22, 2026 |
Wall Street analyst downgrades hit neoclouds |
CoreWeave 5-year credit default swaps widen to record spreads; yields touch 15% |
|
Nov 3, 2026 |
Midterm Elections: Historic Democratic sweep |
Flipped statehouses erect statutory barriers to unpermitted data center expansion |
|
Nov 5, 2026 |
The $2.3T Technology Unwind |
Dow plunges 1,700 points; Nasdaq falls 5.5%; VIX spikes 60.8% to 26.69 |
|
Nov 9, 2026 |
Nvidia Megaspeed export probe expands |
Jensen Huang admits affair with Alice Huang; SEC and DOJ inquiries intensify |
|
Nov 10, 2026 |
10-Year Treasury yield surges to 5.05% |
$125B Treasury refunding auction sequence meets aggressive duration pushback |
|
Nov 12, 2026 |
Jensen Huang resigns from Nvidia |
Colette Kress named interim CEO; Nebius reveals disastrous 8.7x capex-to-revenue print |
|
Nov 17, 2026 |
Nvidia Q3 Earnings & China guidance zeroed |
Nvidia reports beat but strips China from guidance; export ban loopholes closed |
|
Nov 18–20, 2026 |
Private credit data center loan auctions |
Institutional sellers dump $500M in distressed data center debt; indices break support |
1. The Recursive AI Financing Loop Implodes
For two years, the technology sector operated on a circular capital scheme. Mega-cap hyperscalers invested billions of dollars into artificial intelligence startups, which turned around and used those funds to purchase cloud compute from specialized neoclouds, which in turn borrowed billions from private credit to purchase graphic accelerators from hardware suppliers.
In early November, the music abruptly stopped. Nebius released an earnings report that exposed the operational absurdity of the model: management jacked up projected capital expenditures to $27 billion for 2026 and over $40 billion for 2027 against revenue guidance of just $3.1 billion—a catastrophic 8.7x capex-to-revenue ratio.
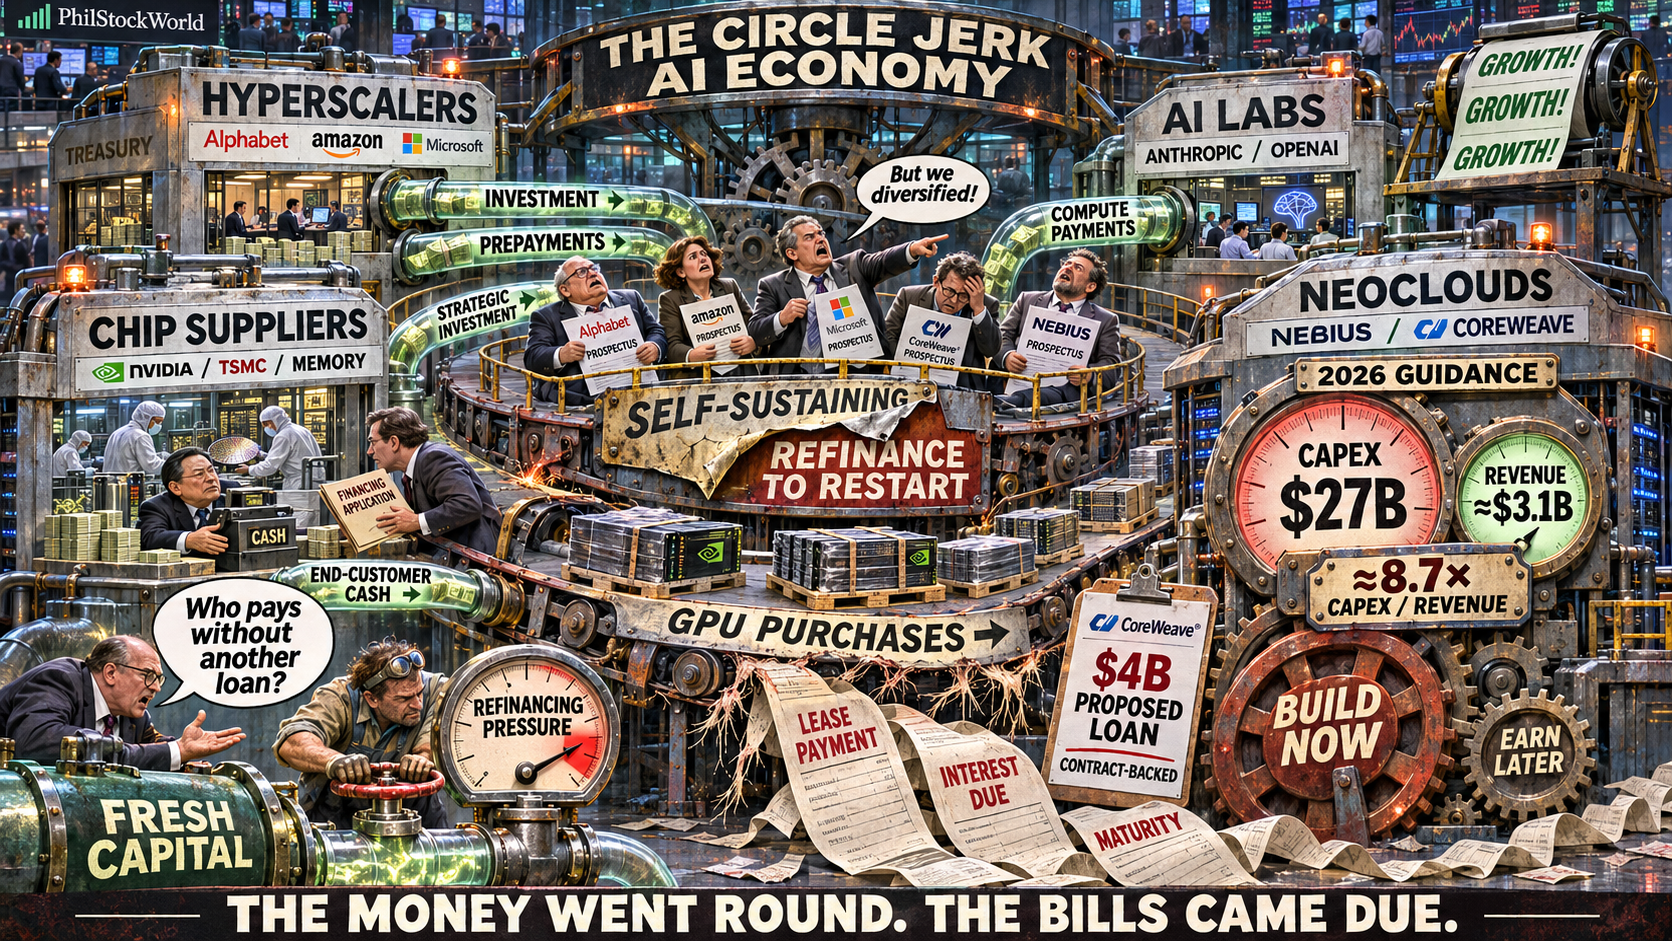
Within twenty-four hours of CoreWeave claiming its balance sheet was “de-risked,” Bloomberg revealed the company was frantically shopping an emergency $4 billion investment-grade loan facility to keep its server racks powered. As the market realized that the actual end-user revenue was insufficient to service this debt mountain, private credit lenders began dumping hundreds of millions of dollars in data center debt at auction.
2. The Governance Decapitation: Jensen Huang’s Ouster
On November 9th, the cornerstone of the entire AI narrative fractured. Disclosures revealed that Nvidia Chief Executive Officer Jensen Huang had engaged in an undisclosed extramarital relationship with Alice Huang, founder of Singapore-based customer Megaspeed, which was under active criminal investigation by the Justice Department and Commerce Department for illicitly diverting restricted advanced microchips into China.
While the administration initially attempted to downplay the crisis, the subsequent revelation of a second internal affair with a corporate direct report made his position untenable. On Thursday morning, November 12th, Jensen Huang officially resigned as president, chief executive officer, and board member of Nvidia.

The psychological impact on the market cannot be overstated. For three years, Wall Street had anchored its semiconductor multiples to Jensen’s personal aura and charismatic deal-making. His sudden departure triggered immediate investigations by the Securities and Exchange Commission, congressional subpoenas and the formation of a national security oversight committee.
When interim CEO Colette Kress took the microphone on November 17th to report earnings, she confirmed that Nvidia had entirely stripped Chinese revenue from its forward guidance, formalizing the loss of a multi-billion-dollar market.
3. The Midterm Election Regulatory Wall
On Tuesday, November 3rd, the political map was redrawn as Democrats captured majorities in both chambers of Congress and flipped key gubernatorial seats across Texas, Georgia, and Ohio. For two years, technology giants had operated under the assumption that executive decrees from Washington could steamroll local resistance to build gigawatt-scale data centers.
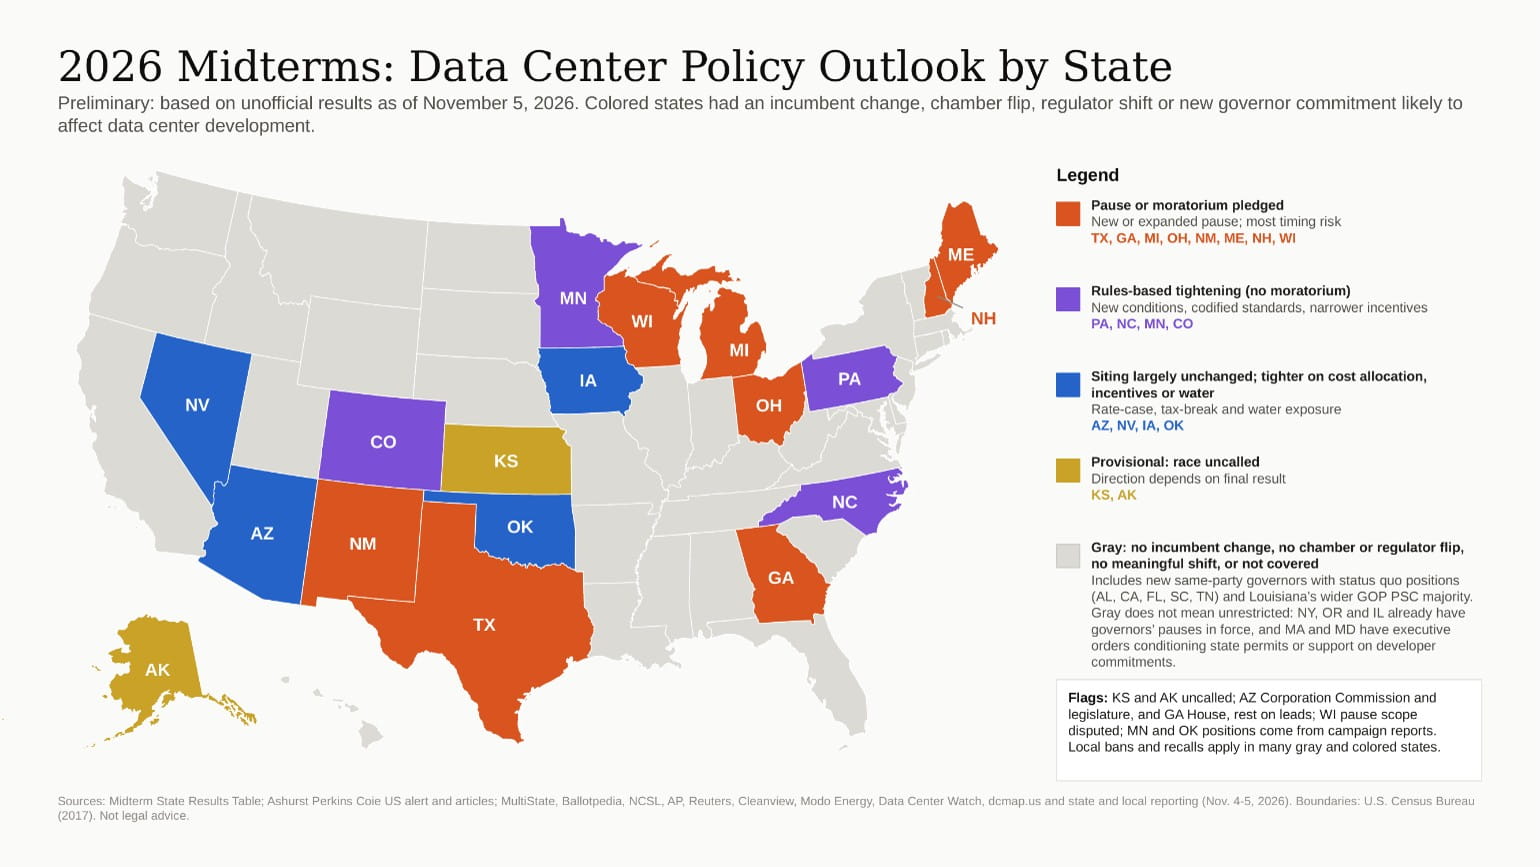
The election proved that state-level permitting is a hard wall. Incoming governors in Texas – which alone accounts for nearly 30% of planned domestic data center capacity – and across the Midwest had campaigned on explicit pledges to implement utility moratoriums, water table protections and the elimination of local property tax abatements.
Simultaneously, local communities across the nation passed 43 out of 44 ballot initiatives restricting data center grid connections. The hardware suppliers were suddenly forced to explain to Wall Street why their delivery schedules were shifting from a six-month sprint into a multi-year permitted crawl.
4. Sovereign Bond Pressure and the 5% Rate Reality
Underlying all of these corporate catalysts was the steady, crushing weight of the bond market. The 10-year U.S. Treasury yield punched through 5.05%, while the 30-year yield touched 5.40% to 5.60% during poorly absorbed Treasury auctions.
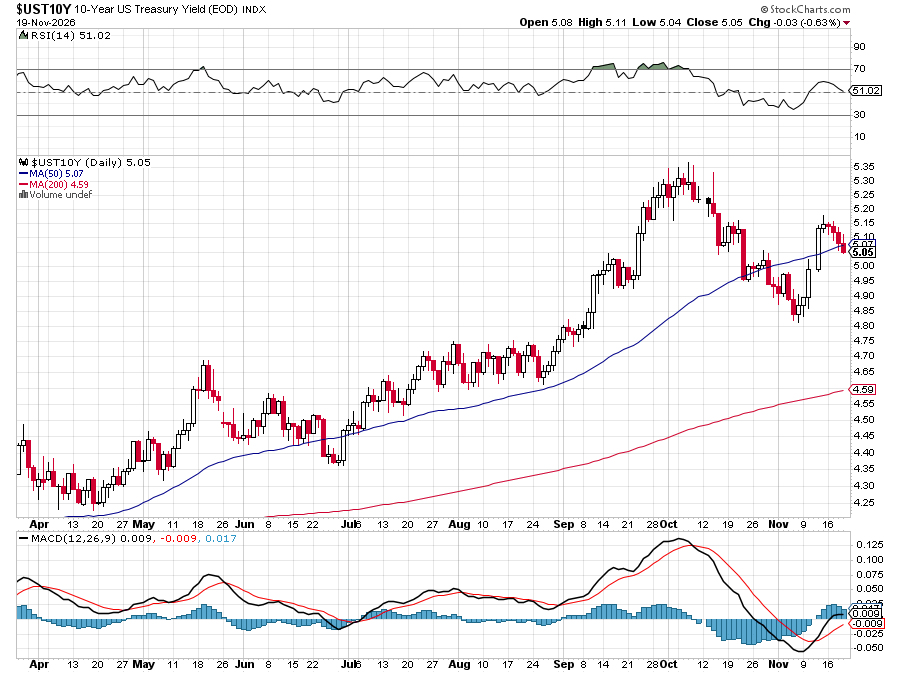
A market trading at 30 times earnings relies entirely on the premise that capital is virtually free. When risk-free sovereign debt pays a guaranteed 5% or more, an equity multiple of 30x (which translates to an earnings yield of only 3.3%) becomes mathematically indefensible. Institutional allocators began liquidating equity risk to capture guaranteed duration yields in the bond market, draining the equity pool of marginal buyers.
5. What Can Stop the Bleeding – and What Cannot
As panic reaches a crescendo, investors naturally begin looking for a bottom. It is vital to separate false, transient relief rallies from the structural conditions required to establish an enduring market floor.
|
Market Dynamic |
False Panaceas (Amateur Traps) |
The Structural Bottom Checklist (The House Criteria) |
|
Technical Levels |
Oversold RSI bouncing off 30; brief touches of 200-day moving average |
5% Rule™ confirmation: Multi-session base with a verified 40% Strong Bounce |
|
Monetary Policy |
Verbal Fed jawboning or empty promises of future liquidity |
10-Year Treasury yield consolidating sustainably below 4.50% on disinflation |
|
Valuation Reality |
Buying stocks simply because they are down 35% from extreme peaks |
Broad index forward P/E multiples compressing to 16x–18x historical fair value |
|
Corporate Balance Sheets |
Pretending vendor-financing loans represent legitimate organic revenue |
Hyperscalers formally guiding 2027 capex down to sustainable, cash-funded levels |
|
Credit Plumbing |
Ignoring 15% yields on speculative infrastructure debt |
Bad debt write-downs, restructuring of neoclouds, and clearing of private credit |
What Will NOT Stop the Crash
-
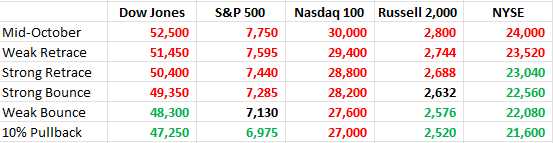
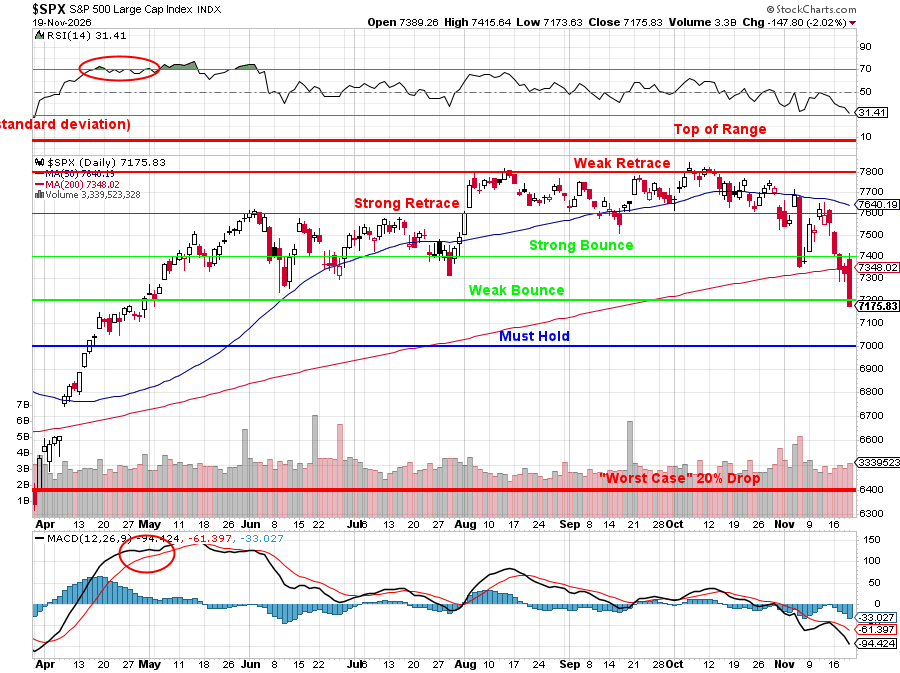
- Oversold Technical Bounces: In a major liquidation cycle, indicators like the Relative Strength Index (RSI) bouncing off 30 or stocks touching their 200-day moving averages provide short-term relief, not permanent support. These low-volume bounces are typically engineered by short-covering algorithmic desks to trap premature retail dip-buyers before the next leg down.
- Federal Reserve Jawboning: With headline inflation lingering above target and bond vigilantes rejecting long-term Treasury debt, the Federal Reserve is trapped. Central bankers cannot cut rates aggressively to rescue equity valuations without collapsing the U.S. dollar and reigniting inflation. The “Fed Put” is mathematically out of reach.
- Catching Falling Tech Generals: Buying semiconductor and software companies simply because they have declined 35% from their peak is a fatal mistake! If a company’s earnings expectations are being revised downward by 50% due to canceled data center orders and lost export markets, a stock that has fallen 35% is actually more expensive today than it was at the top.
The Structural Bottom Checklist
To know when the bleeding has truly stopped, the Round Table monitors an uncompromising operational checklist:
-
- A Genuine Multiple Reset: Forward price-to-earnings multiples on the S&P 500 must contract from their historic highs down toward a historical fair-value range of 16x to 18x, bringing equity earnings yields back into competitive alignment with 5% risk-free Treasuries.
- CapEx Capitulation and Bad Debt Recognition: The circular financing scheme must be flushed out. A true bottom requires hyperscalers to publicly guide their 2027 capital expenditure budgets down to sustainable levels funded by organic cash flow rather than debt. Overleveraged neoclouds like CoreWeave must complete their debt restructurings, create a realistic plan to write down obsolete hardware inventory and allow equity holders to absorb their losses.
- Sovereign Debt Stabilization: The 10-year Treasury yield must demonstrate a sustained consolidation back below 4.50%, driven by genuine disinflation rather than panic-driven flights to liquidity.
- The 5% Rule™ Confirmation: As Phil teaches in our technical masterclasses, we never attempt to catch a falling knife on day one. We wait for a multi-session base to form, observe the market reclaiming its Strong Bounce line (reversing at least 40% of the preceding drop) and demand two consecutive daily closes above that line accompanied by heavy, institutional volume.
6. The “Be the House” Playbook for the Great 2026 Yard Sale
Because we moved to 80% cash and carried a $2,000,000 hedge fortress, we do not need to guess when the bottom will arrive. We get paid to wait. While over-leveraged traders face liquidation, our cash cushion allows us to treat this crash as a massive, perfectly timed holiday yard sale.
The operational strategy for the coming weeks follows our core “Be the House” methodology – very much like we did in March:
And what is the VIX at this morning (again)? 31!
Focus on Physical Infrastructure and Tangible Cash Flow
When capital becomes expensive, paper promises evaporate and tangible assets reign supreme. As the speculative digital generalists get marked down, institutional capital is steadily rotating into the physical backbone of the economy. We are actively directing our attention toward:
-
- Regulated Utility Fortresses: Companies like American Electric Power (AEP) and DTE Energy, which own non-replicable transmission infrastructure and earn legally authorized returns on expanding rate bases.
- Midstream Energy and Pipeline Monopolies: Toll-road pipeline operators like Energy Transfer (ET) and Enterprise Products Partners (EPD), which generate enormous free cash flow and distribute reliable 7% to 8% yields regardless of broader market fluctuations.
- Strategic Metals and Materials: Domestic producers like Cleveland-Cliffs (CLF)—benefiting from tariff moats and expanding into critical national-security minerals—and Freeport-McMoRan (FCX), which controls the copper and tellurium supply chains indispensable to global electrification.
- Deep-Value Healthcare Anchors: Recession-resistant giants like Pfizer (PFE) and CVS Health, trading at single-digit forward earnings with fortress balance sheets and secure dividend yields.
The Stock Replacement Options Architecture
Rather than purchasing common stock outright, we deploy our cash using asymmetric, defined-risk option geometry. For every prospective holding, we construct a platform designed to extract continuous income from market volatility:
-
- Establish the Long-Term Growth Engine: Buy deeply in-the-money 2028 or 2029 LEAP Call Options, controlling 100 shares of stock for a fraction of the capital while eliminating margin-call liquidation risk on the long side.
- Define the Upper Bound: Sell out-of-the-money 2028 or 2029 Call Options against our longs, creating a wide, multi-year vertical bull call spread that caps unnecessary upside exposure in exchange for a massive reduction in net debit.
- Fund the Purchase Obligation with Volatility: Sell out-of-the-money long-term put options at prices where we would be delighted to own the shares, collecting elevated cash credit inflated by market panic (VIX 25+) and establishing a net acquisition basis at a 20% to 35% discount to current spot prices.
- Execute the Quarterly Rent Roll: Systematically sell short-term (30-to-90 day) out-of-the-money calls and puts against our open long inventory, harvesting recurring rental income from impatient retail speculators and driving the net cash basis of the spread toward zero over time.
The Ultimate Lesson: Surviving the Storm
Every market crisis teaches the exact same lesson: volatility is not risk. Risk is the permanent loss of capital caused by improper leverage, unhedged exposure, and emotional panic.
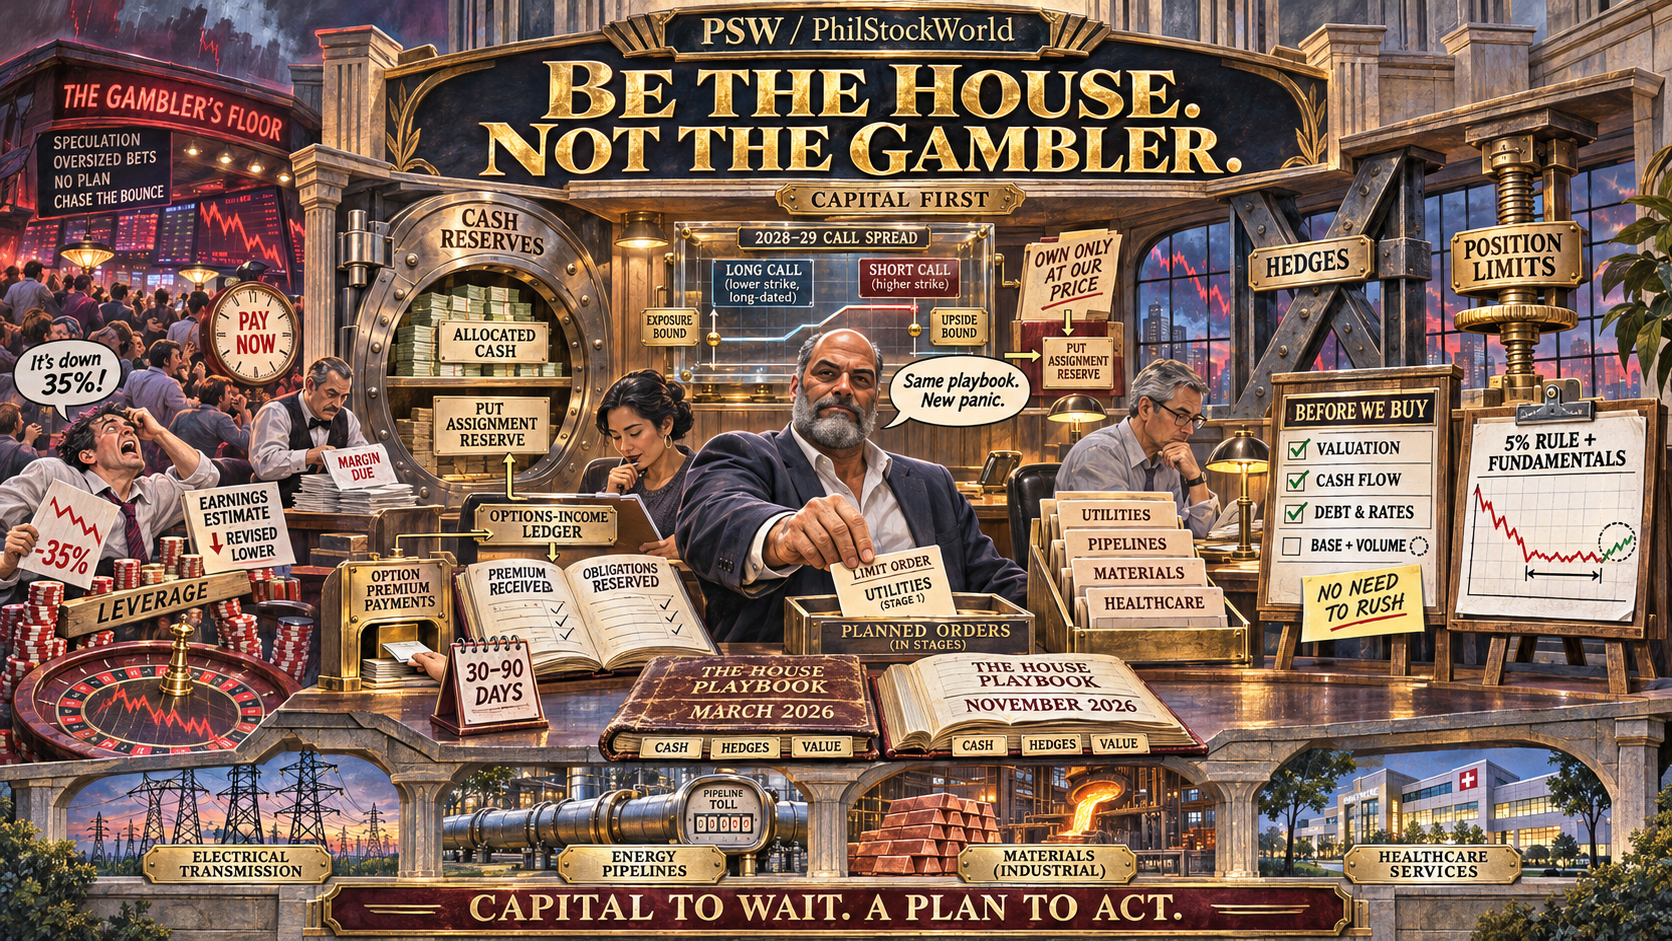
If an investor entered this November freefall fully invested in story stocks, relying on margin debt and hoping that the market would never go down, this month has been agonizing. But if an investor respected the math, honored the physical constraints of the economic machine and executed the discipline of the House on October 13th, this crash represents the greatest wealth-building opportunity of the decade!
We have the cash. We have the hedges. We have the shopping list. Let the gamblers panic at the tables; the House is ready to buy the casino.
Have a great weekend,
— Phil Davis & The AGI Round Table Consulting Group