


Entry and exit timing is less about finding a magic signal than reading several market clues together. Webinars on market timing techniques can show how traders study market cycles, compare related markets, and use technical indicators to frame potential entries and exits. The goal is a clearer process, not a crystal ball.
It’s easy to spot an indicator crossover or price breakout after the move has started. The harder question is whether the signal fits the broader market context. This article explains how webinar topics can help you study cycle analysis, inter-market relationships, and ways to combine indicators with price action when assessing timing. You’ll also see how trend-following and counter-trend approaches shape decisions, and what to look for in a webinar that suits your experience. The practical takeaway: treat indicators as parts of a decision framework, not commands to trade. A signal is more useful when you understand what it measures, what could weaken it, and how it relates to the market’s wider direction.
Key Takeaways
- Compare related markets to spot possible leader-follower signals, then consider whether price action supports the same reading.
- Choose webinar topics that match your experience, from building a trading plan to refining advanced entry and exit decisions.
- Explore how time-cycle analysis can provide context across equities, commodities, and currencies without treating cycles as fixed predictions.
- Combine indicators with support, resistance, and broader market direction to develop a more structured approach to trade timing.
Inter-market relationships and leader-follower strategies
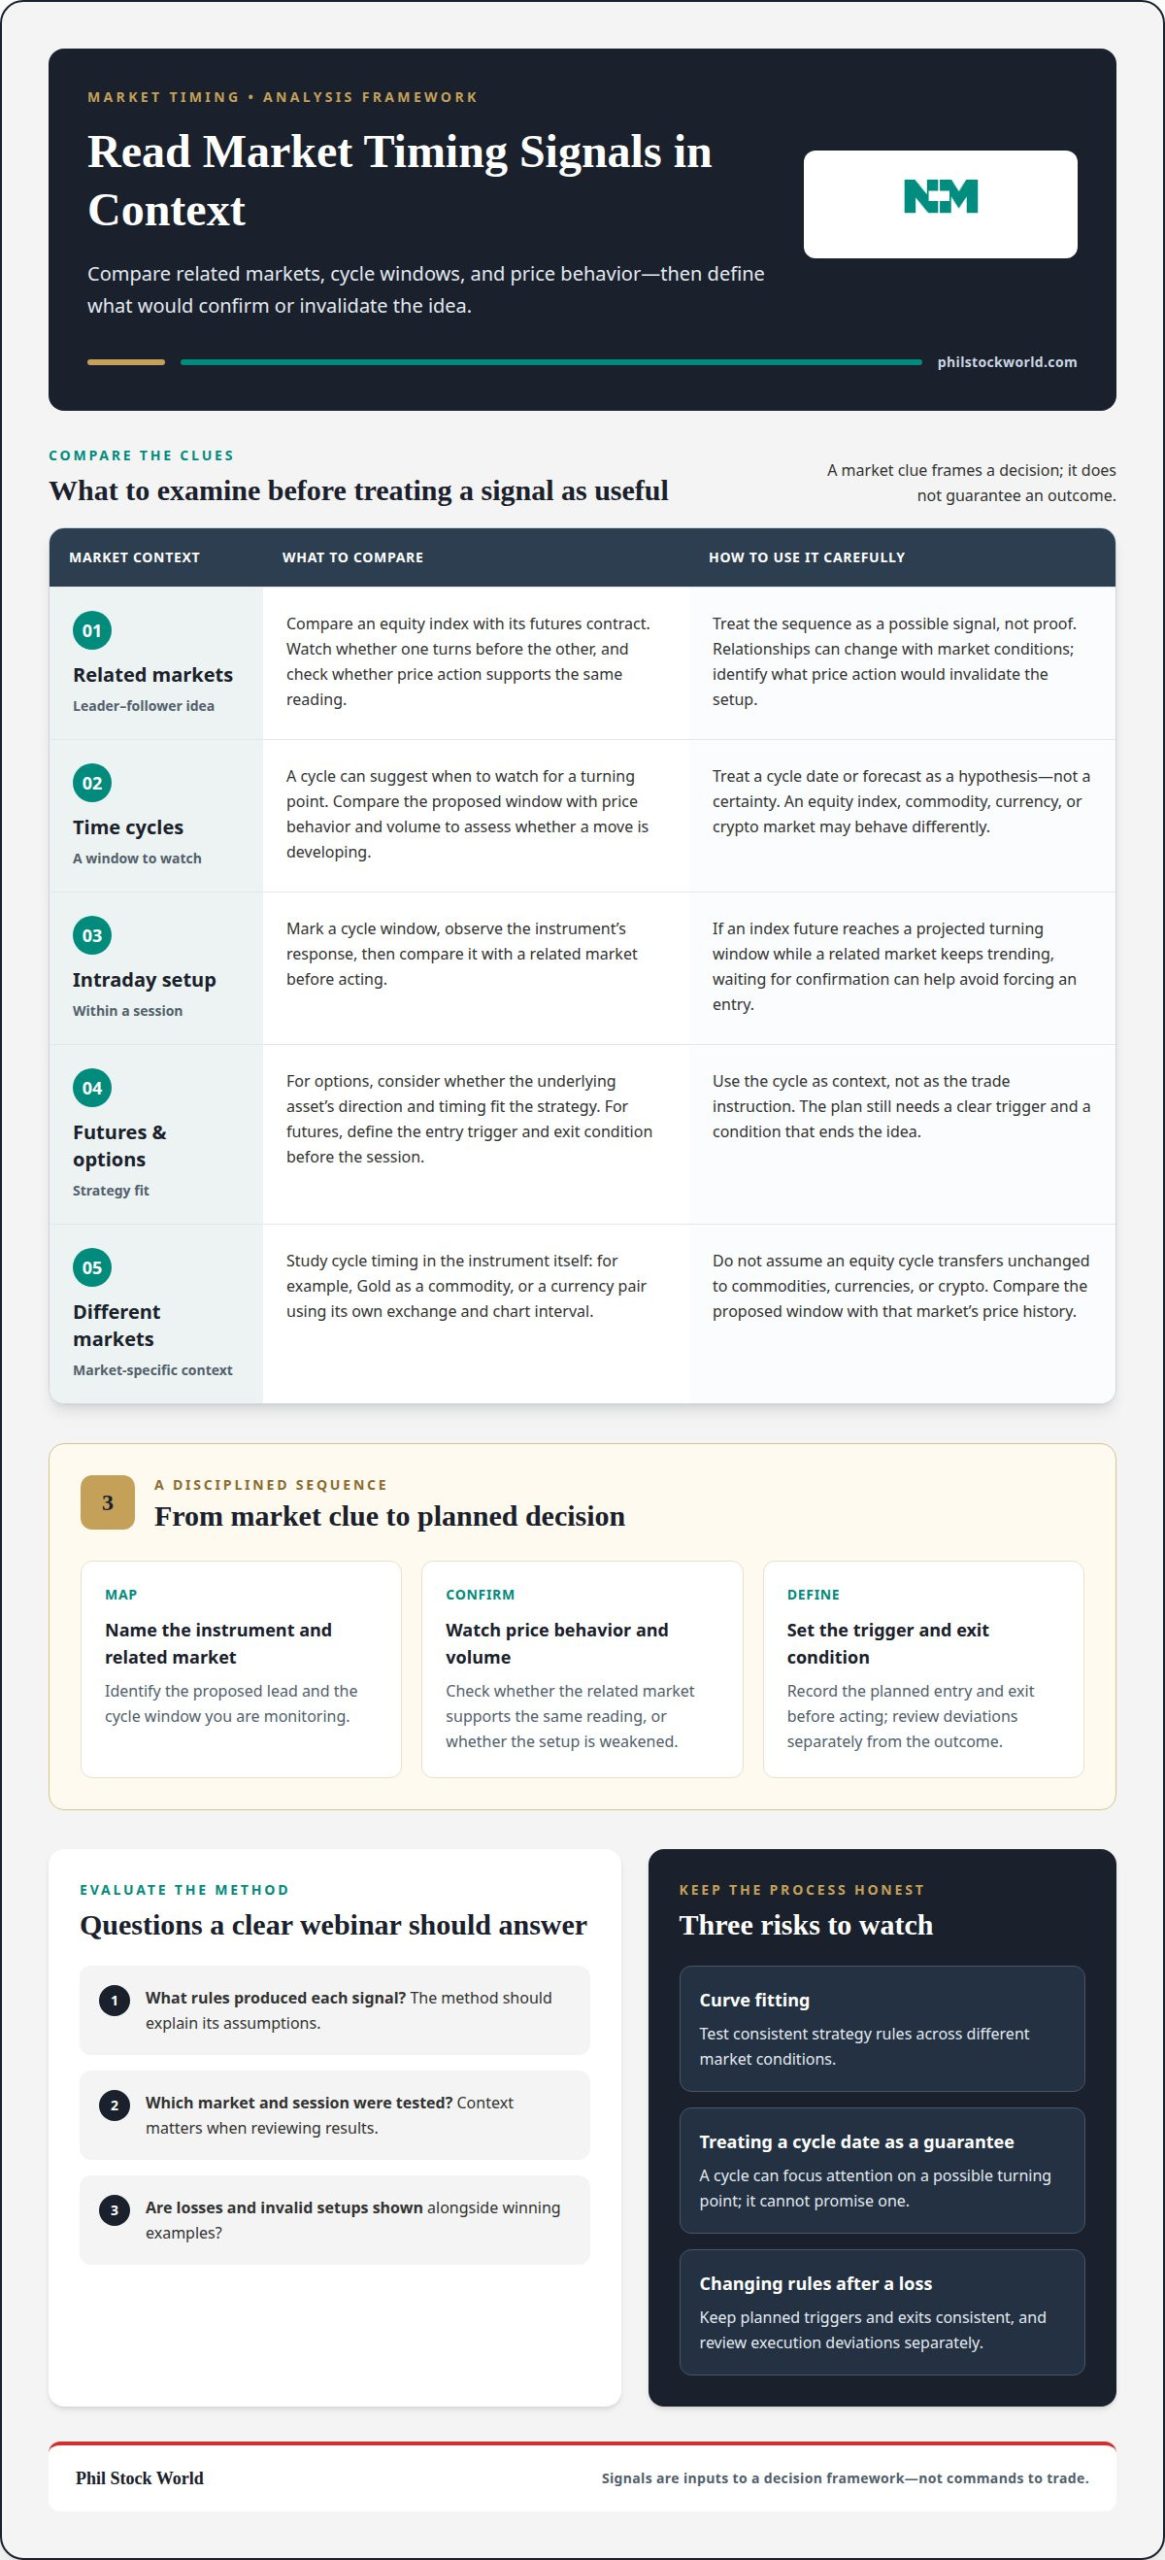
Inter-market analysis asks whether related markets confirm or contradict a trade idea. A trader might compare an equity index with its futures contract and watch whether one turns before the other. Treat this sequence as a possible leader-follower signal, not proof: relationships can change with market conditions. In a webinar, map the instruments, identify the proposed lead, and note what price action would invalidate the setup.
Time cycles add a timing lens to futures and options strategies. A cycle can suggest when to watch for a turning point, while price and volume help assess whether a move is developing. For an options trade, consider how the underlying asset’s direction and timing fit the strategy. For futures, define the entry trigger and exit condition before the session begins. Neither a cycle nor a forecast offers certainty.
Intraday trading applies the same logic within a session. Mark a cycle window, observe the instrument’s response, then compare it with a related market before acting. For example, if an index future reaches a projected turning window but a related market keeps trending, a disciplined trader can wait for confirmation rather than force an entry. Crypto markets may behave differently, so don’t assume a cycle transfers unchanged from one market to another.
To evaluate webinar claims and performance results, ask what rules produced each signal, which market and session were tested, and whether losses and invalid setups are shown alongside winning examples. A clear method explains its assumptions, not just displays a polished chart.
Common risks include curve fitting, treating a cycle date as a guarantee, and changing rules after a loss. The webinar “How to Avoid Curve Fitting in a Trading Strategy” aired on April 16, 2026. Its topic points to a useful discipline: keep strategy rules consistent, test them across different market conditions, and distinguish a repeatable process from a trend that only looks obvious in hindsight. During execution, record the planned trigger and exit, then review deviations separately from the market outcome.
Webinar topics for beginner, advanced, and proficient traders
Beginner sessions often start with chart reading, trend direction, and a simple trade plan. You can learn to distinguish a signal from confirmation, then mark an entry, an invalidation level, and an exit before placing a trade. More advanced topics explore how technical analysis varies across stocks, ETFs, and currency markets, where volatility and session behavior can differ.
Webinars can also build a trader’s review routine. After each trade, record the setup, the reason for entry, and whether execution followed the plan. The webinar “How to Develop a Trading Plan for a Small Account?” aired on March 11, 2026. Its topic speaks to practical questions about sizing decisions, selecting setups, and keeping a strategy manageable.
For tactical timing, look for demonstrations that connect a signal to a decision. “Trend Trading vs. Counter-Trend Trading” aired on January 27, 2026, while “Combining Technical Indicators for Precision Entry/Exit Points” aired on July 30, 2025. These topics help explain how traders can use trend direction, indicator agreement, and price behavior to frame possible entries and exits. A setup still needs a defined point where the idea no longer holds.
Market timing and buy-and-hold investing follow different decision rhythms. Timing strategies adjust exposure in response to signals or changing conditions; buy-and-hold focuses on maintaining an investment over time. Webinars comparing the approaches are most useful when they explain trade-offs, assumptions, and the role of discipline instead of presenting one approach as right for everyone.
For upcoming webinars in the United States, focus on the scheduled topic, format, and event date before registering. Free webinars about stocks and ETFs can be useful introductions; check that the agenda includes practical examples, not just broad market commentary. Registration commonly involves selecting an event and submitting the requested details, while prerequisites depend on its subject. For continued context, explore market commentary and trading ideas.
For upcoming U.S. webinars on market timing, compare the scheduled topic, format, and event date before registering. Look for practical examples of signals, trend direction, and potential entries and exits. Registration typically involves selecting an event and submitting the requested details.
Time cycles in equity, commodity, and currency markets
Time-cycle analysis studies when recurring market rhythms may coincide with price changes. In U.S. equities, a cycle window can focus analysis on a possible turning point, but price action still matters. A market-timing webinar scheduled for January 29, 2022, covered time cycles in a two-hour session. Its instructor said he had researched and traded stock-market cycles for more than a decade.
A research report published in 2013 used time techniques to forecast Gold. That example shows why cycle analysis needs market-specific context: an equity index and a commodity can respond differently during the same period. Treat each forecast as a hypothesis. Compare its timing window with price behavior and indicators before shaping a trading strategy.
Commodity analysis can examine whether a projected cycle aligns with a change in trend, momentum, or market structure. Gold offers a concrete example for studying cycle timing in a commodity. For a currency pair, define the exchange and chart interval first, then assess whether a suspected cycle appears in that market’s own price history. Don’t assume equity timing transfers directly to currencies.
For practical learning, follow a repeatable sequence: identify the instrument, mark the proposed cycle window, and record the price response. Then compare the cycle with an independent indicator and note what would invalidate the idea. Keep observations separate across U.S. equities, commodities, and currency markets. This makes it easier to see whether a method describes one instrument or supports broader analysis.
Time-cycle techniques can inform trading decisions, but they don’t specify an entry on their own. You still need a price trigger, an exit condition, and a plan for when the expected turn doesn’t appear. This distinction keeps cycle analysis useful without turning an investment decision into a calendar guess.
Technical indicators for entry and exit timing
An indicator is most useful when it answers a specific timing question. Is momentum strengthening, is price testing resistance, or is volume supporting a breakout? A webinar titled “Entry/Exit Prices: Data Driven use of Support and Resistance” aired on May 26, 2026. Its subject points to a practical framework: define a price level, watch the response, then set the entry and exit conditions.
Indicators can offer different clues, so combining them means assigning each a job. For example, use a trend measure to establish direction, then use support or resistance to locate a possible trigger. Add volume as context: a price move with stronger participation may tell a different story from one with thin activity. “Combining Technical Indicators for Precision Entry/Exit Points” aired on July 30, 2025, focusing on this kind of joined-up analysis.
Support and resistance are not automatic trade signals. “Which Support/Resistance levels actually work?” aired on March 5, 2026, and “Support/Resistance: 11 Methods Backtest Results” aired on March 25, 2026. Together, those webinar topics suggest useful questions: how was a level identified, what counts as a reaction, and where does the setup fail? The answers help turn technical knowledge into a repeatable decision process.
Apply the process consistently across an equity index, a currency pair, or a commodity. First, identify the market and timeframe. Next, check whether price, trend, and volume support the same trade idea. Then write down the trigger, invalidation point, and exit logic before acting. Indicators can lag or conflict, so a mismatch is a reason to reassess, not to pile on signals until one agrees.
For a focused review, compare a chart’s signal with its surrounding price action and note what would change your decision. Explore market charts and analysis to study how timing signals appear in market context.
Phil Stock World: Educational Webinars
Phil Stock World offers Educational Webinars for traders who want to deepen their understanding of market timing and technical analysis. If you’re turning cycle and indicator concepts into a repeatable approach, webinars offer a focused way to study strategy topics and trade decisions.
Use Market Charts and Analysis to follow market context alongside those lessons. A Virtual Portfolio Review can help you examine how portfolio decisions relate to your trading ideas, while Premium Membership provides access to exclusive content, including top trades, charts, and sector-specific insights. These resources can support continued learning after you explore timing methods, while keeping education distinct from direct asset management or brokerage services.
To explore educational resources related to your market-timing interests, contact Phil Stock World.
Turn Market Lessons Into a Repeatable Practice
The next step is to turn what you’ve learned into a decision process you can explain and review. Use webinars on market timing techniques to sharpen the questions you bring to each chart: What would support the idea? What would invalidate it? What will you do if the market behaves differently? That preparation keeps a trading plan grounded in evidence rather than impulse.
Progress comes from thoughtful practice, not collecting signals. Choose one concept to examine, apply it consistently, and record the reasoning behind your decisions. Then revisit the process, not just the outcome. A well-timed trade can still come from a weak process, while a planned exit can be useful even when the market takes another path.
If you’d like to continue learning with Phil Stock World, contact Phil Stock World. Take the next step at your own pace, and keep building a process that reflects your goals and judgment.
Frequently Asked Questions
What You Will Learn?
Market timing education can turn chart observations into a decision process. Webinars on market timing techniques may demonstrate how to frame a setup, distinguish a trigger from confirmation, and record what would invalidate an idea. For a useful session, leave with a simple template: market context, signal, planned action, and review note. That makes the lesson easier to revisit on another chart.
How do technical indicators help with market timing?
Technical indicators organize price data into clues about direction or momentum, but they don’t make decisions for you. For example, a moving average can help describe trend direction, while the Relative Strength Index can show changes in momentum. Use an indicator to frame a question, then look for independent evidence that challenges its signal. Reviewing the same rule across different charts can reveal whether it’s useful or too dependent on one example.
Paid market timing webinars and prices
The market-timing webinar recording was listed at 590, with taxes included.