


Sentiment can flag rising risk, but it can’t tell you when a crash will arrive. Understanding market sentiment indicators means reading the VIX and social-media activity as clues to market mood, not as standalone forecasts: the VIX reflects options-implied expectations for S&P 500 volatility over the next 30 days, while online chatter can amplify sentiment and contribute to sharp stock-price moves.
It makes sense to watch market sentiment indicators when headlines turn tense or a popular stock suddenly dominates the conversation. The key is to distinguish a shift in mood from a reliable signal about what prices will do next. This guide explains what the VIX measures, how social media can shape investor behavior, and what sentiment extremes may reveal about crash risk. You’ll also see how traders combine these clues with price action and risk-management rules instead of treating a spike in fear or a wave of optimism as a command to buy or sell.
Key Takeaways
- Use Fear and Greed readings as a snapshot of crowd mood, not a crash countdown.
- Read an elevated VIX as a sign of heightened concern, while remembering that fear can also appear near market lows.
- Social media can amplify bullish or bearish behavior, so weigh online chatter against broader sentiment and market evidence.
- Build a stronger trading view by comparing multiple indicators and pairing them with price action and risk-management rules.
Can I Use Market Sentiment Indicators To Predict Stock Market Crashes?
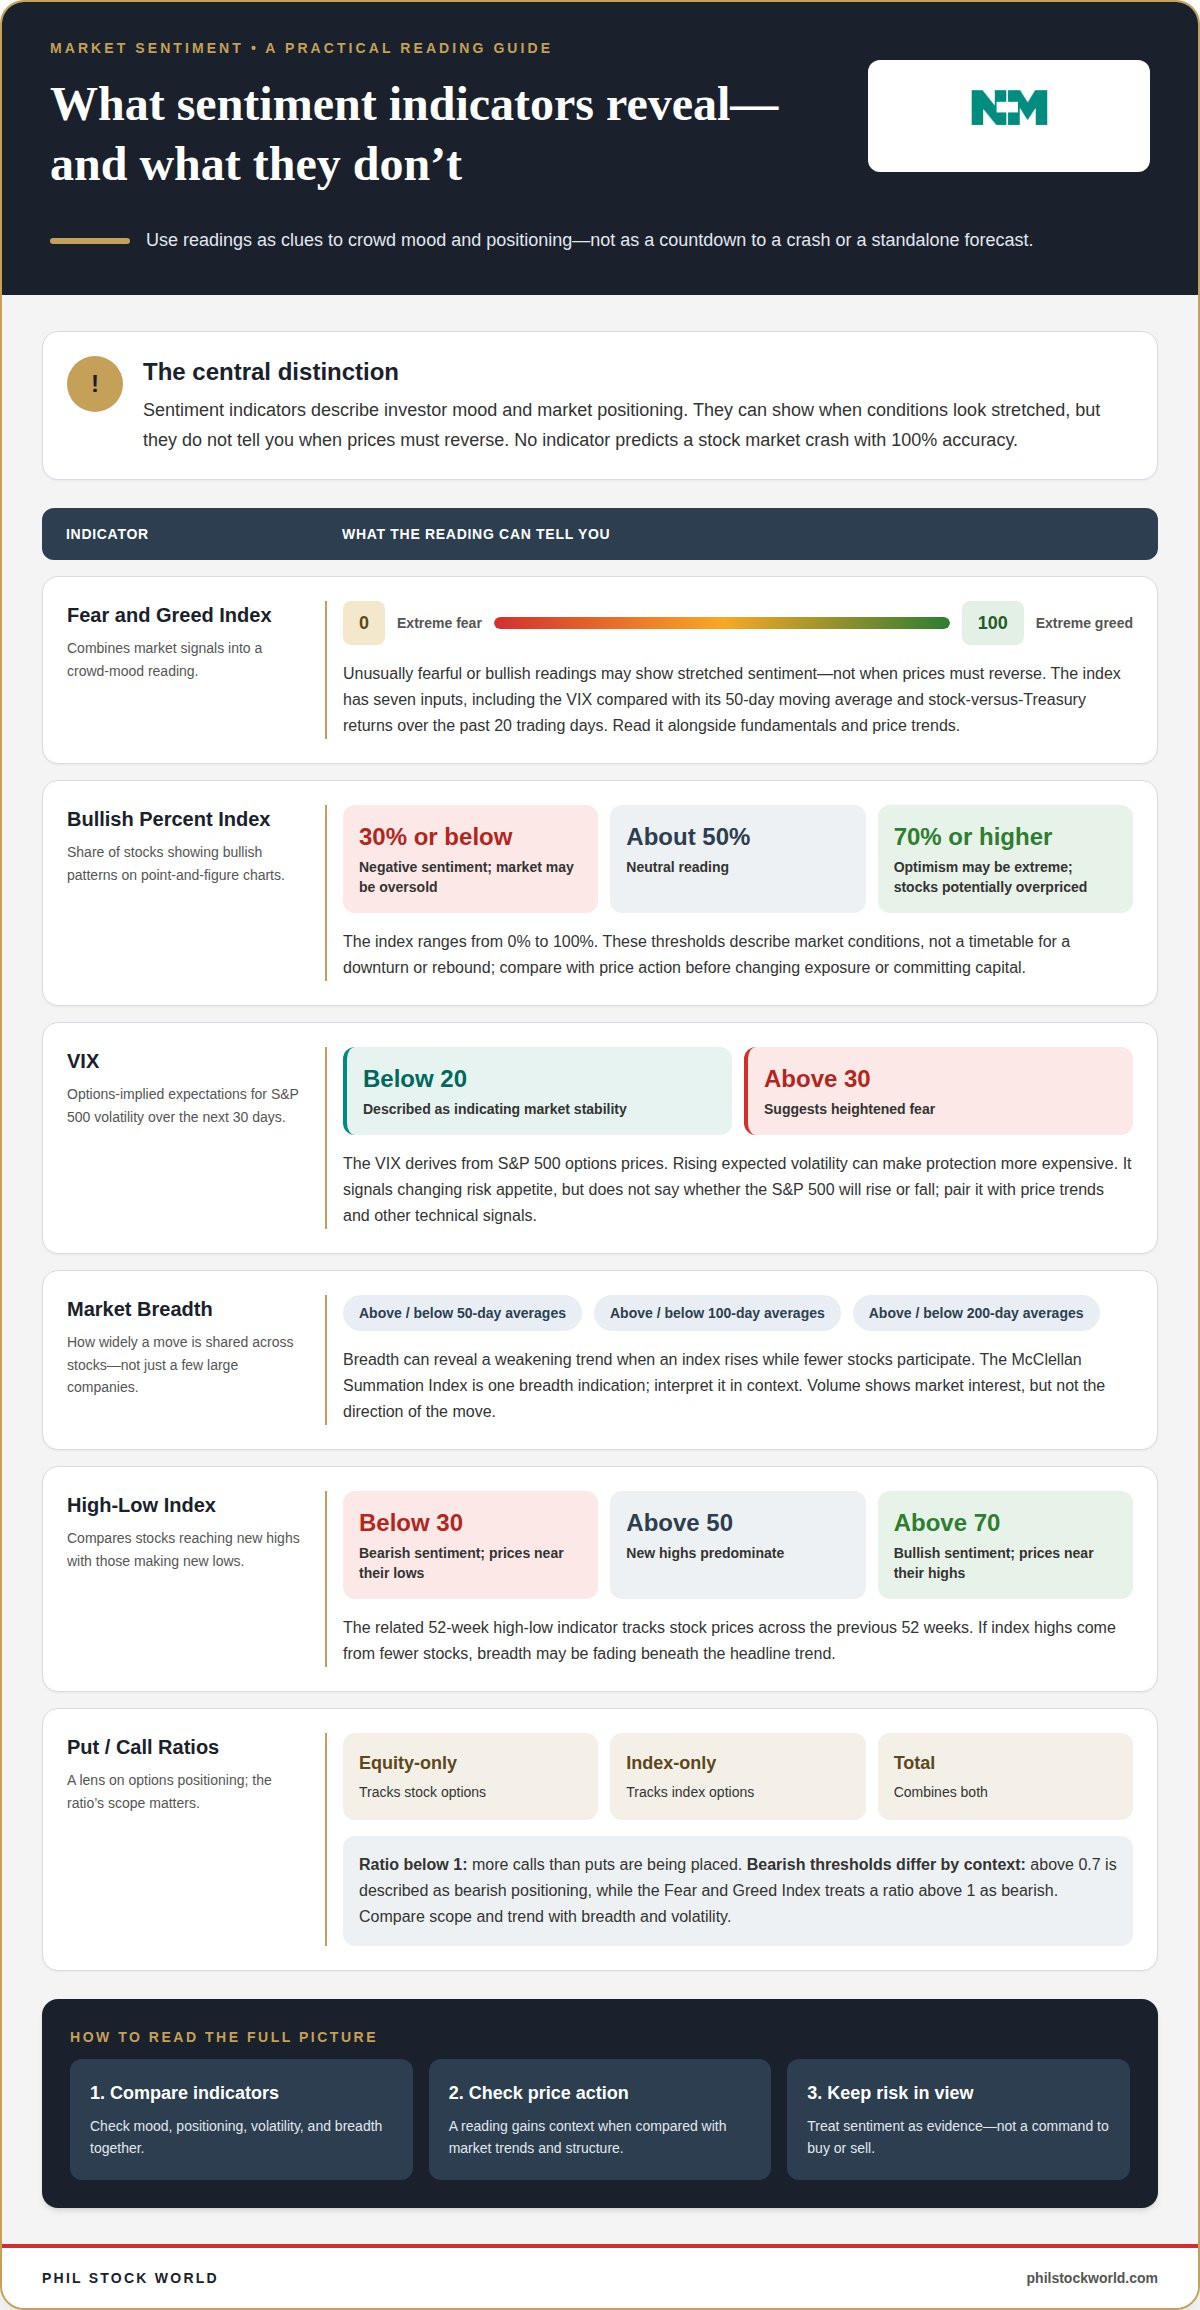
The most commonly used market sentiment indicators include the Fear and Greed Index, the VIX, breadth measures, and put/call ratios. They describe investor mood and positioning, not the market’s next move; no indicator predicts a stock market crash with 100% accuracy.
Fear and Greed Index
The Fear and Greed Index combines market signals into a reading from 0 to 100, with 0 indicating extreme fear and 100 extreme greed. Its value is context: unusually fearful or bullish readings can show when sentiment has become stretched, not when prices must reverse. The index includes seven inputs; these include the Cboe Volatility Index compared with its 50-day moving average and stock-versus-Treasury returns over the past 20 trading days. Treat the reading as a mood gauge alongside fundamentals and price trends.
Bullish Percent and Point-and-Figure Charts
The bullish percent index measures the share of stocks showing bullish patterns on point-and-figure charts. It ranges from 0% to 100%, with about 50% representing a neutral reading. At 70% or higher, optimism may be extreme and stocks potentially overpriced; at 30% or below, negative sentiment may signal an oversold market. These thresholds describe market conditions, not a timetable for a downturn or rebound. Compare the index with price action before changing exposure or committing capital.
Market Breadth and McClellan Volume Summation
Market breadth shows how widely a move is shared across stocks, rather than relying on a few large companies. One approach measures the percentage trading above or below their 50-day, 100-day, and 200-day moving averages. The McClellan Summation Index can offer one indication of market breadth, but its reading should be interpreted in context. Breadth can reveal a weakening trend when an index rises while fewer stocks participate. Volume shows market interest, but not the direction of the move.
High-Low Index and Stock Extremes
The High-Low Index compares stocks reaching new highs with those making new lows. A reading above 50 indicates new highs predominate; below 30 signals bearish sentiment and prices near their lows, while above 70 points to bullish sentiment and prices near their highs. The related 52-week high-low indicator tracks stock prices across the previous 52 weeks. When index highs come from fewer stocks, breadth may be fading beneath the headline trend.
Put/call ratios add a positioning lens: equity-only tracks stock options, index-only tracks index options, and total combines both. A ratio below 1 means more calls than puts are being placed; above 0.7 is described as bearish positioning. The Fear and Greed Index treats a ratio above 1 as bearish. Compare the ratio’s scope and trend with breadth and volatility before drawing conclusions.
VIX as a measure of options-implied volatility and protection costs
The VIX shows how options markets price expected S&P 500 volatility over the next 30 days. It offers traders a forward-looking sentiment signal, not a forecast of the index’s direction.
VIX and Options-Implied Volatility
The Cboe Volatility Index, or VIX, derives its reading from S&P 500 options prices. Those prices reflect what investors will pay for options, including protection against potential declines. When expected volatility rises, that protection can become more expensive. A VIX reading below 20 is described as indicating market stability, while a reading above 30 suggests heightened fear.
That makes the VIX a useful measure of changing risk appetite, but not a direct gauge of bullish sentiment. It captures expectations embedded in options prices, which can shift quickly as traders reassess risks. The VIX also doesn’t say whether the S&P 500 will rise or fall. Pair it with price trends and other technical signals to understand the broader setup.
Sentiment During Volatility and Recovery
In 2022, investor fear contributed to intraday S&P 500 volatility not seen since the Great Recession of 2008. That comparison shows how sharply market conditions can change, but it doesn’t make the VIX a crash-timing tool. A high reading can reflect demand for protection during a selloff, while volatility itself can ease before every concern disappears.
By September 2023, the VIX had reached a three-year low, suggesting calmer investor sentiment. That shift marked a different mood from 2022, not proof that markets had become risk-free. The VIX measures expected volatility over the next 30 days, so it can’t capture every future shock or explain what caused sentiment to change. Treat it as one signal, then compare it with market structure and other evidence.
For context, compare VIX movements with price action rather than treating any single reading as a trading trigger.
How Does Social Media Influence Market Sentiment?
Social platforms such as Reddit can amplify bullish or bearish sentiment and contribute to rapid, sentiment-driven stock-price moves. Bullish readings indicate optimism, bearish readings indicate pessimism, and neutral readings suggest neither mood dominates. These labels describe sentiment, not price direction.
Investor Psychology and Market Behavior
Investor psychology shapes buying and selling decisions as people respond to risk, headlines, and crowd behavior. A bullish outlook can encourage buying, while bearish expectations can intensify selling. Social media compresses these reactions into fast-moving conversations, allowing a widely shared narrative to influence attention and trading activity. Reddit discussions can amplify sentiment and contribute to rapid price movements, especially when investors focus on the same stock. Recognizing this dynamic helps distinguish crowd mood from evidence.
Interpreting Sentiment Readings
A sentiment reading is a snapshot of how surveyed investors view the market, not a verdict on what comes next. The AAII Sentiment Survey asks members weekly whether they feel bullish, bearish, or neutral about the next six months. Treat each label as a description of respondents’ outlook, then compare it with earlier readings and price behavior to assess whether sentiment may be shifting.
For the week ending June 3, 2026, 36.3% of investors were bullish, 26.7% neutral, and 37.0% bearish. Bearish responses exceeded bullish ones, but a single survey week doesn’t establish a lasting trend. Historical averages are 37.5% bullish, 31% bearish, and 31.5% neutral, providing useful context for that weekly snapshot.
Social feeds offer a different signal from surveys: spontaneous discussion can reveal which stocks are drawing attention, but online intensity doesn’t show how broadly investors are positioned or what fundamentals support a claim. Treat posts as clues about market psychology, then compare them with survey readings and price behavior.
Trading with market sentiment
Sentiment helps traders assess crowd positioning, but it works best as one input in a broader trading plan. Understanding market sentiment indicators means asking what each reading adds to technical structure and company fundamentals before deciding whether a rising market looks positive or fragile.
Trading with Sentiment Indicators
Traders use sentiment indicators to gauge whether optimism or pessimism is unusually strong. A high VIX can signal heightened worry and may appear near a market bottom; a low VIX can suggest complacency near a peak. Neither reading identifies a turning point. Compare multiple measures, then look for confirmation in price action and market structure. For a contrarian idea, recent price extremes can help frame risk.
Combining Sentiment with Other Analysis
Combining sentiment with technical and fundamental analysis means checking whether crowd mood, price behavior, and company conditions tell a consistent story. For example, bullish sentiment alongside rising prices may support a positive trend, while weakening breadth can reveal narrow participation. Fundamentals add another lens: assess the company’s underlying business rather than assuming social enthusiasm reflects financial strength. Understanding market sentiment indicators also means giving each signal a distinct role instead of letting one reading dictate a trade.
Make position changes measured, not reflexive. If two sentiment extremes align for two weeks, one suggested approach is a 5% equity tilt within an investor’s policy band. If all four sentiment indicators align persistently, a 10% to 15% tilt may be considered. When greed dominates, a modest cash increase can also help cover liabilities due within 12 to 24 months.
Sector sensitivity matters too: technology and consumer discretionary stocks tend to react more to mood shifts than utilities and consumer staples. Compare those differences with existing exposure before acting. Explore market charts and analysis to put sentiment readings alongside broader market trends.
Phil Stock World: Market Charts and Analysis
Phil Stock World helps readers put sentiment signals in context with Market Charts and Analysis. Explore these resources when a VIX move, shifting breadth, or a burst of social-media activity raises questions about your market view. Charts can help you compare indicators with price trends, while Educational Webinars help build your understanding of market behavior. Premium Membership provides access to member-focused market content, and a Virtual Portfolio Review can help you examine how market ideas relate to a portfolio you already hold.
Sentiment is most useful as part of a broader analysis, not as a standalone trading instruction. Explore Phil Stock World’s resources and bring your questions to the discussion.
Make Sentiment Part of a Sharper Process
Turn sentiment into a consistent decision framework. Understanding market sentiment indicators becomes more useful when you record what a reading suggests, what price action confirms, and what would invalidate your view. That discipline keeps a loud headline from quietly becoming your entire thesis.
Phil Stock World’s Premium Membership, Virtual Portfolio Review, and Educational Webinars offer different ways to deepen that process, from ongoing market context to reviewing portfolio ideas and learning strategies. Choose the format that fits the question you’re working through, whether you’re interpreting a shift in mood or refining how you assess risk.
The aim isn’t to eliminate uncertainty, but to make your reasoning more deliberate and your response more measured. Keep asking what an indicator captures, what it misses, and whether other evidence agrees. Contact Phil Stock World to discuss market sentiment, and take your next step with greater clarity.
Frequently Asked Questions
Are There Sectors That Are More Sensitive to Market Sentiment Than Others?
Yes. Technology and consumer discretionary stocks tend to react more strongly to shifts in market mood, while utilities and consumer staples are generally more stable. During a broad risk-off spell, for example, compare a growth-oriented company’s price behavior with a utility’s rather than assuming the whole market responds uniformly. Sector sensitivity helps explain why a sentiment signal may affect holdings differently across a portfolio.
What Is Sentiment Analysis?
Sentiment analysis assesses whether investors’ comments, survey responses, or market positioning lean optimistic, pessimistic, or neutral. In practice, an investor might compare the tone of social posts about a stock with its price trend and trading activity. The goal is to understand the mood behind market behavior, not to treat online opinions as proof that a company’s outlook has changed.
What are market sentiment indicators?
Market sentiment indicators describe how investors feel or position themselves rather than directly forecasting prices. Examples include volatility readings, surveys, breadth data, and options positioning. Each captures a different aspect of mood: a survey records stated expectations, while options data reflects trading activity. Comparing different indicator types can help reveal whether an apparent shift is broad or concentrated in one signal.
How do the VIX and volatility indexes measure market sentiment?
The VIX uses S&P 500 options prices to reflect expected volatility over the next 30 days. It signals how much movement options markets anticipate, not whether the index will rise or fall. A trader assessing a sudden VIX jump can compare it with actual S&P 500 price action and other indicators to distinguish a change in expected turbulence from a clear directional view.
What do the put-call ratio and options data reveal about investor sentiment?
The put-call ratio compares put-option activity with call-option activity, offering a view of options-market positioning. A ratio below 1 means more calls than puts are being placed, while a reading above 0.7 is described as bearish positioning. The ratio’s scope matters: equity-only, index-only, and total readings cover different options activity, so compare like with like when tracking a change.
How do the CNN Fear and Greed Index and similar sentiment indexes work?
The CNN Fear & Greed Index combines seven inputs into a score from 0 to 100, with lower readings indicating fear and higher readings indicating greed. Its components include the VIX compared with its 50-day moving average and stock-versus-Treasury returns over the past 20 trading days. The index recalculates as new data becomes available, so its reading can shift with market conditions.