
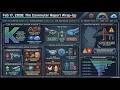
Portfolio Review & FED Minutes (2/18/2026)
01:52:28
PhilStockWorld's Thursday Wrap-Up: The Market s Two Stories
07:07
Iran US Brinkmanship - Oil Spiking, Market's Nervous?
07:12
PhilStockWorld Wednesday Wrap-Up - Bifurcation
06:48
AI Devours Software But Needs Physical Reality
07:00
The AI Whack A Mole Market
06:30
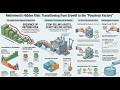
🏦 Retirement Strategies 101: Engineering Your Portfolio into a Paycheck Factory
07:14
Bargain Hunting & Retirement Income (2/11/2026)
02:05:32
PSW Commuter Report: Market Meltdown - AI-Phobia Takes Control
06:39
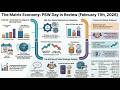
PhilStockWorld Commuter Report: Feb 11th 2026
07:12