

 Have you hear of the Titanic Signal?
I hadn't either until this morning, when I read this article from McClellan Financial that had this chart which shows the times (down arrows) in the past 30 years that the number of new 52-week lows exceeds the number of new highs on the NYSE within 7 trading days of a major market high.
Sound confusing? It's not, essentially what it's looking for is a broad sell-off where smaller amounts of stocks are propping up the indexes. That's something we pay attention to all the time in Member Chat (on an intra-day basis), so it's nice to know it makes enough sense to have a name amongst top-notch TA people like McClellan (yes, there are a few I respect). Per their analysis:
The top chart shows all of the instances since 1984 of these preliminary sell signals firing off. You can see that they do tend to cluster around major tops, but they also seem to cry “wolf” a lot at other times when an uptrend continues. Ohama noticed that too, and so he added further criteria to constitute what he called “additional evidence”. He wanted to see NL exceed NH for 4 out of 5 days, plus NH declining to less than 1.5% of total issues, and finally to have the DJIA (or SP500) decline for 4 out of 5 days. We now have 2 out of those 3 criteria met, but have not seen the DJIA or SP500 drop for 4 of 5 days.
 As we know, we're also getting scary signals from the "Hindenburg Omen," which has some similar criteria to the Titanic Signal and John Bollinger, who created Bollinger Bands, has a good way of describing both of these indications. Rather than thinking of them as “signals”, it is perhaps better to think of them as “alerts”. Each can be useful for getting one to pay more attention to bearish signs in other charts and indicators, even as one retains the knowledge that it could turn out not to lead to a big selloff every time.
We already decided to short the Dow this morning (/YM in the Futures) at the 15,100 line and I sent out not one, but two tweets on the matter after sending out an early morning Alert to our Members at 5:26am. We're watching oil on the $97 line (also a short below the line on /CL) as well as the Nikkei under 12,900 (too crazy to short), S&P below 1,630 (SPY 164 on Dave Fry's chart) and the Dollar over 81.10 to confirm (see tweets for more details).
That call wasn't based on technical but fundamental weakness we're seeing in the news, including (but certainly not limited to):
- World Bank Cuts Global Outlook as China Slows, Europe Contracts.
- In its report of quarterly GDP for 1Q13 across the G20 countries, the OECD says that while GDP growth grew slightly in the aggregate (0.7% vs. 0.6% in 4Q12), the actual patterns across the world's 20 largest economies diverge significantly. Four countries' economies moved in the wrong direction – India, China, South Africa and Mexico. GDP continued to contract in France and Italy, though at a slower pace. (PDF)
- Individuals Pull Most Money From Bond Mutual Funds Since 2008. Investors pulled $10.9 billion from U.S. bond mutual funds in the past week, the biggest redemption since October 2008
- Bank Of England's Haldane: "We've Intentionally Blown The Biggest Bond Bubble In History".
![[image]](http://si.wsj.net/public/resources/images/MK-CD995_TAXCRE_NS_20130613182103.jpg) There's plenty more (see our Pre-Market News Review) but the one item that convinced me to get more bearish was this item from the WSJ that wasn't intended to be bearish but, to me, the conclusion is obvious. The article is titled "Behind the Big Profits: A Research Tax Break" and points out that, of the 6.7% gain in Corporate Profits that have the markets so excited in 2013, 5.6% of the gains are coming from these 1-time tax breaks that are VERY unlikely to be renewed at the end of this year.
There's plenty more (see our Pre-Market News Review) but the one item that convinced me to get more bearish was this item from the WSJ that wasn't intended to be bearish but, to me, the conclusion is obvious. The article is titled "Behind the Big Profits: A Research Tax Break" and points out that, of the 6.7% gain in Corporate Profits that have the markets so excited in 2013, 5.6% of the gains are coming from these 1-time tax breaks that are VERY unlikely to be renewed at the end of this year.
With first-quarter results nearly complete, 465 participants in the Standard & Poor's 500-stock index cumulatively reported that revenue increased 2.1% from the same period a year earlier. Expenses grew slightly faster, so pretax profit rose only 0.9%, according to the Journal's analysis.
According to the Journal, Google, for example reported spending $6.8 billion on research and development in 2012, making it one of the nation's biggest corporate research spenders. The company set aside less than half as much money for first-quarter taxes as it did a year earlier even as its pretax income increased 2%, to $3.6 billion. Its effective tax rate fell to 7.9% from 18.5%. In a securities filing, Google said the drop was "primarily" due to the extension of the tax credit. If Google's profit had been taxed at the same rate as last year, the company would have had to set aside an additional $380 million for income taxes, knocking more than 10% off their quarterly net income (over $1 per share)
INTC reported $10.1Bn in R&D and saved $290M, 15% of their reported income. BA got $145M, CAT $65M, EMC $75M, ABT $103M, GLW $54M… This is all in addition to the Fed racking up $3.5Tn on their Balance Sheet in order to keep feeding these guys money at insanely low interest rates to invest in gigantic R&D projects, where they save more on taxes than they pay in interest. Kudos for the Government for finally figuring out a way to encourage R&D (turning it cash-flow positive) but shame on analysts for believing these artificial profits can be extrapolated past this year's bonus.
 We've already got shorts in place on the Dow Futures (/YM) below the 15,100 line and oil has gotten silly pre-market at the NYMEX open (9am), pumped up to $97.50 so a great line to short there on the /CL Futures. We can add to our USO $34.60 short position and maybe even the SCO ($35.60) long positions once trading begins in our Short-Term Portfolio and I'm going to be liking DIA ($151.76) shorts, perhaps taking advantage of the low premium of the next week (June expiration) $153.50 puts, that should be about $2 with just .25 of premium.
The advantage of selling the puts is, of course, that it limits our losses (to the price of the put) and, since they have a delta of .70 – we only lose 70 cents for each 100 points the Dow gains so, if we stop out at Dow 15,150, we should only be down .35 so we can buy 10 of those for $2,000 and hopefully keep the risk down to $350 while a visit back to 14,900 (yesterday's low), should make us $1,400.
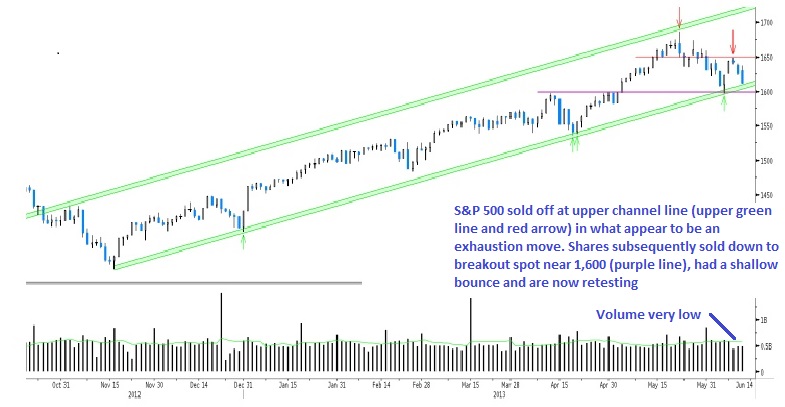
I like this chart (and the whole presentation) from Barry Ritholtz's Fusion Analytics, which he was nice enough to share with us this morning. It gives us perspective on how this is one, big, weak bounce so far and it won't be a recovery until we retake 1,640 but anything red from here is nothing more than a weaker bounce than we had last week (to 1,645) and of course we're bouncing off a very strong line at 1,600 with the 8-month uptrend but that's the point – when those lines finally fail, they tend to fail spectacularly.
 If we're still going up over 1,645 – we have another 50 points to play it up before resistance. Of course – the way this market moves, that might be one day, but we have all our nice short puts from last week and plenty of other ways to make big money if that big channel is holding – it's the downside you want to avoid, not failing to get 100% of the upside!
Check out (once again) 5 Inflation Fighters Set to Fly (and Part 2) as well as 5 Trade Ideas that can Make 500% in an Up Market – don't focus so much on the trades as the concepts, they can be applied to anything you feel bullish about (just ask in Member Chat, of course). Look what I picked back then – DBA, X, CLF, ABX, QQQ – the first four haven't really gone anywhere but we had kick-ass gains on the last spike up so no reason not to play them again.
Have a great weekend,
– Phil