

Everything is proceeding as I have foreseen.
We drew the S&P bounce chart for you yesterday and we said we expected a run to our strong bounce line at 1,910 from 1,877,75 at the time. The long play paid off at $50 per point, per contract for a lovely $1,612.50 per contract gain (you're welcome) and this morning, in our Live Member Chat Room as well as the Chat in our Options Opportunity Portfolio, we took advantage of the overshoot to 1,924 (also noted on yesterday's chart) to short the S&P again and, as you can see, that's paying off nicely already.
We don't officially trade Futures in the OOP but, once in a while, I'll throw a pick out there along with our usual options trading. MU was our most recent long position and they release earnings after the close so I can't tell you what our play was because it's still gettable for our Members but tomorrow I'll tell you how well it went.
 Overall, we are pretty sure this "rally" is fake, Fake, FAKE!!! and that's how we're playing it so expect us to be adjusting our hedges and cashing in some longs as we get ready for what could be a major leg down in the markets. For those of you who haven't been following along and aren't well-prepared for a market downturn, I refer you to my weekend post: "Hedging For Disaster – Now, Are You Ready To Listen? "
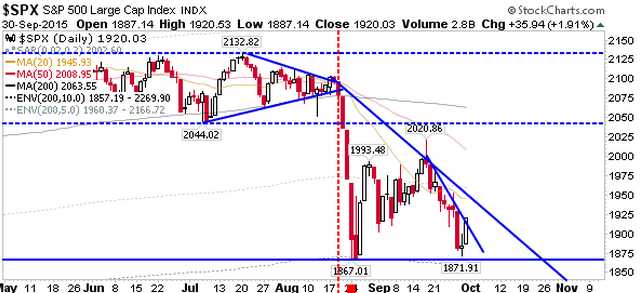
As you can see from Declan's SPX chart (full post at Chart School) the S&P needs to get back over 2,020 just to get back to where we bounced after the Aug 24 disaster and that was a VERY QUICK (2-day) recovery to 1,993. Today is day 2 of bounce 2 and are we at 1,993? No, we are not.
 Therefore, this bounce is WEAKER than the last bounce and, much like a bouncing ball that's losing it's kinetic energy, the S&P 500 is losing it's energy as gravity begins to take it's toll (see the classic "Stock Market Physics" for more on how this works). For a full run-down of all of our bounce lines, see yesterday's morning post.
There's lots of bad news that's keeping us bearish but the biggest one is still CHINA!!! and China, which is now closed for a week so we can't blame them for whatever correction we have over the next 7 sessions – this is all on us. According to the WSJ, Global investors have already pulled $40 billion from emerging-market stocks and bonds in the third quarter in response to China's effect on their economies. That is the biggest outflow since the fourth quarter of 2008, during the height of the financial crisis.
 Any signs of China's slowdown bleeding all the way into the US economy will be seen as a disaster that could be the tipping point for the whole Global economy – OR – it could be the trigger for the next MASSIVE round of Global stimulus. So, we're not so much shorting the market as we are staying mainly in CASH!!! (just in case) and kind of hoping the markets do collapse (sorry), so we can do some bargain shopping.
We do have long positions (just in case we're wrong) but they are mainly our offers to buy stocks we REALLY want to own for prices that are 20% below current, using our "How To Buy Stocks for a 15-20% Discount" strategy. Those positions are, essentially, already hedged but we also hedge the overall portfolio which does make us net a bit bearish, which is where we want to be at these still-lofty market heights.
 While I don't believe the Central Banksters are out of stimulus ammo yet – I do think they are pushing a very heavy stone up a very steep hill and it's not likely to end well. Even with the tremendous efforts put in by China's Government to prop up their markets and their economy (Trillions have been spent in the last 24 months alone – more than 10% of their GDP) we just got their September PMI numbers – and they suck! Fortunately China is closed for a week or this would be ugly tomorrow.
China has been in a recession for two years, maybe more, but the Government pumps 10% of the GDP into the economy as stimulus and that nets you 7% GDP "growth" instead of 3% GDP contraction but, to the extent that the Government fails to apply the stimulus shots evenly, certain sectors of the economy end up showing signs of the contraction that the flood of money is mostly covering up.
 As long as China keeps pumping $1Tn into a $10Tn economy, they can keep things looking good for quite a while – it's like filling a leaky pool with a hose every day. As long as the amount leaking out is less than the amount you are pouring in, then the water level holds and everyone looking at the top of the pool thinks things are fine.
Unfortunately, if you don't actually fix the leak (economic downturn) and just keep pouring water on the problem, the hole tends to get bigger and it takes more and more money to cover up the actual deficit in the economy and, eventually, you either run out of water or the hole gets so large you can't fill the pool fast enough to stop it all from draining out – that's how fake economies collapse.
The other fake economy we worry about is Japan, where they have been pumping things up for 20 years to no real avail. Japan is now 230% of their GDP in debt and Prime Minister Abe has doubled down on the stimulus and now Japan is spending well over 10% of their GDP on stimulus – and it's still not working!
Japan now spends 35% of their total Government revenues just to SERVICE THE INTEREST on their 1,223,510,986,404,520 Yen debt. That's 1.2 QUADRILLION Yen ($10Tn). Even at 2% interest on bonds, that's $200Bn a year just to pay the interest on their debt, which is 20% of all Government Spending in Japan (but they don't even collect enough taxes to cover that).

Essentially, Japan is constantly borrowing about 10% of their GDP and still falling behind 10% a year in debt. As you can see from the chart, their Central Bank is now covering up the losses by creating $400Bn a year in new money to buy up Government Bonds as the country constantly needs to borrow more money and, on top of that, people are losing faith and cashing theirs in as well.
We're better off than Japan in the US (and Europe) for the moment but only to the extent that we are where they were just 3 years ago and, if ANY other large economy follows Japan off that fiscal cliff – it's going to be a very long way to the bottom as those dominoes start to fall.
How long can we keep all these plates spinning? Not long after rates begin to rise and debt service goes up 50% for each point of interest, right? In theory, until Japan collapses, they show where the debt ceiling really is for the US and Europe but I think China, if you saw their real books, may already be the next Japan – having leap-frogged past the rest of us in an attempt to prop up their $4Tn market collapse this summer.
In short – be careful out there!