Trade Idea, courtesy of Allan, SRS – Ultrashort Real Estate ProShares.
SRS

Before delving into the fundamentals here, take a look at the above chart. Technically, it is about right where it was last November when it started a 67% run from around 90 to around 150. This is not a guarantee that it will run 67% from current levels, but it is a decent roadmap for trading purposes.
The Stock: SRS – Ultrashort Real Estate ProShares
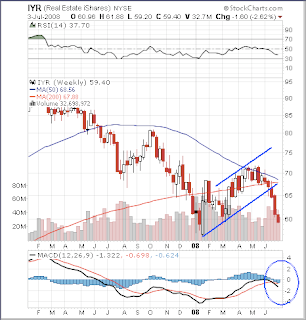
 Dow Jones U.S. Real Estate Index:

Breakdown


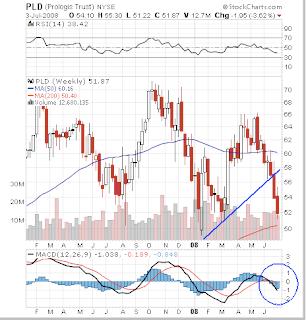
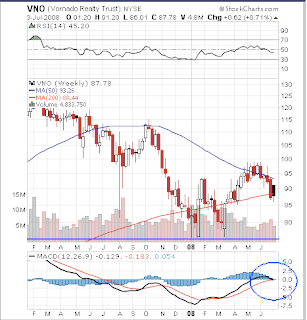
Finally, let’s look at the charts of the three largest components of the Dow Jones US Real Estate Index:


With technicals on the side of this trade, let’s turn to the fundamentals. As described above, SRS is another Ultrashort ETF that inversely tracks the price movement of the Dow Jones US Real Estate Index.
Here is an excerpt from a recent article by TradeRadarOperator, at Trade Radar, which points out huge institutional ownership of SRS:
Even banks like the ProShares Ultra-Short Financial ETF
I recently visited the OwnershipAnalyzer.com site and did a little poking around to see who might be the largest investors in various ETFs. It is interesting to note that the largest institutional holder in the ProShares Ultra-Short Financials (SKF) is the European bank UBS (UBS), which at the end of the first quarter of 2008 owned over 318,000 shares. UBS is not alone.
Other financial institutions on the list of owners, albeit with much smaller stakes, include Oppenheimer (OPY) (not surprising since Oppenheimer is the home of the bank-bashing analyst Meredith Whitney), Jefferies (JEF) and AIG (AIG) among others. Were these banks just hedging or taking a bearish stance on their own industry?
Were these banks just hedging or taking a bearish stance on their own industry? (emphasis mine)
Even more extensive is the list of banks making bearish bets on real estate…
The Trade: The trade here, going long SRS, is a bet on the worsening of the Credit and Real Estate markets as reflected in the Dow Jone U.S. Real Estate Index. I don’t forecast, so there is no way I have any special insight into the worsening of those markets. But the charts above don’t lie. Prices have broken down on the index as well as on the chief components of the index and have broken out on the inverse of the index, SRS.
The market is coming back from the July 4th holiday week in a severely oversold condition and is ripe, under normal conditions, for a rally. But that’s forecasting. The charts and fundamentals are saying something else, confirmatory analysis is suggesting that no matter what happens very short term, the credit and real estate markets are not done falling and one way to play that premise is to go long the SRS.
A


