
For day-traders, Corey provides charts to illustrate patterns for spotting yesterday’s hard-to-trade bull-saving reversal move at the end of the day.
Double Bear Flag and Strange Rally Intraday
Courtesy of Corey Rosenbloom at Afraid to Trade
What a day Thursday’s trading was! It seemed all hope was lost for the bulls until the last hour. Let’s dig a little deeper to see some patterns you might have overlooked, including a rare fractal (double) Bear Flag and a “Three Push” Pattern.
DIA 5-min chart:
Again, what a day. Thanks to the end-of-day announcement of the bank plan news, the market soared to the upside, catching the sellers off guard. You can’t predict announcements using any form of analysis – that’s why you use stops and money management… so you don’t lose too much if you’re caught in the downdraft on the wrong side of the market when they occur. Hey, if everything was so easy, everyone would be doing it!
Let’s focus on the repetitive patterns (that allow you to trade them with edge) that set-up in the day’s structure – there was an extremely rare pattern I wanted to highlight for you.
First, the day started with a downside gap and a break through support on the S&P 500, setting up an expected miserable day for the buyers and potential for a strong trend day down.
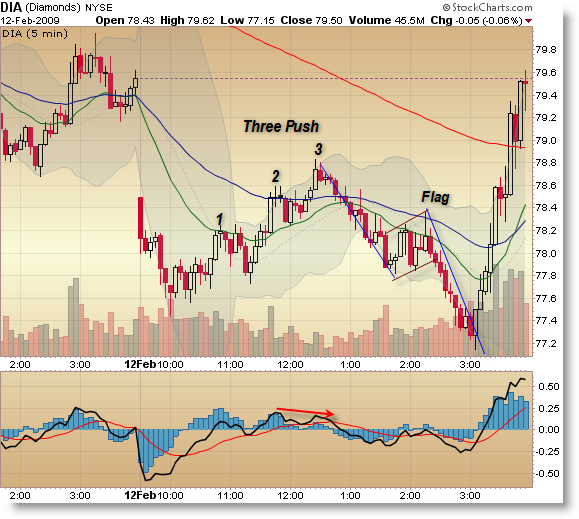
Price proceeded lower into a new momentum low, and then price formed an upward sloping retracement (correction) that was bound – with one exception – by rising parallel trend channels. It formed the “Three Push” Reversal Pattern I’ve been discussing lately, and indeed the third push (on a negative momentum divergence) ended the correction and price then fell to new lows on the day.
Unfortunately, price took out most stop-losses for those playing for a trend day as it breached the 50 EMA.
Price then formed an initial down-thrust, formed another parallel channel retracement (notice the “ABC” … A up, B down, C up) that formed a more comfortable and recognizable Bear Flag that ended right at the falling 50 EMA (allowing entry there for a great risk-reward). The target was a measured move of the prior impulse.
But wait – was there a higher power at work? I pointed this out mid-day to a couple of people when I noticed we might be forming a massive bear flag (it looks more evident on the 15-min chart).
Let’s focus now on the larger-scale bear flag, and identify the smaller fractal bear flag that formed the “Measured Move” side of the pattern.
DIA Focus on the Dual Bear Flags:
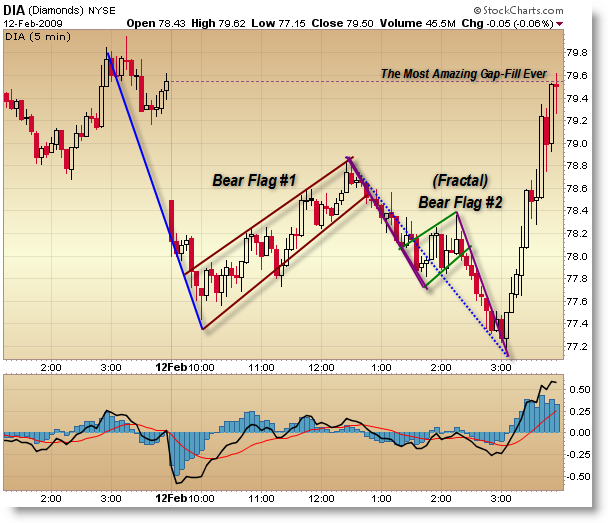
Again, take the time to see this pattern on the 15-minute chart for more clarity.
What’s important from a technical standpoint is that the lows on the day formed on the Measured Move (projection) of TWO Bear Flags. Technically, it also formed on a positive momentum divergence, but I tend to ignore indicators on trend days (this technically was not a trend day in the end).
So price found a bottom, and buyers flooded the market (with shorts covering) as more news came to light about the Mortgage Subsidies Plan. No technical analysis could have forecast the magnitude of the move – all traders are captive to sudden news/price shocks at any time.
Look deeper into the intraday structure for more clues, and overlay some Fibonacci grids over the price action here for some interesting insights as well. I only have so much room to discuss all the developments intraday.
Corey Rosenbloom
Afraid to Trade.com