
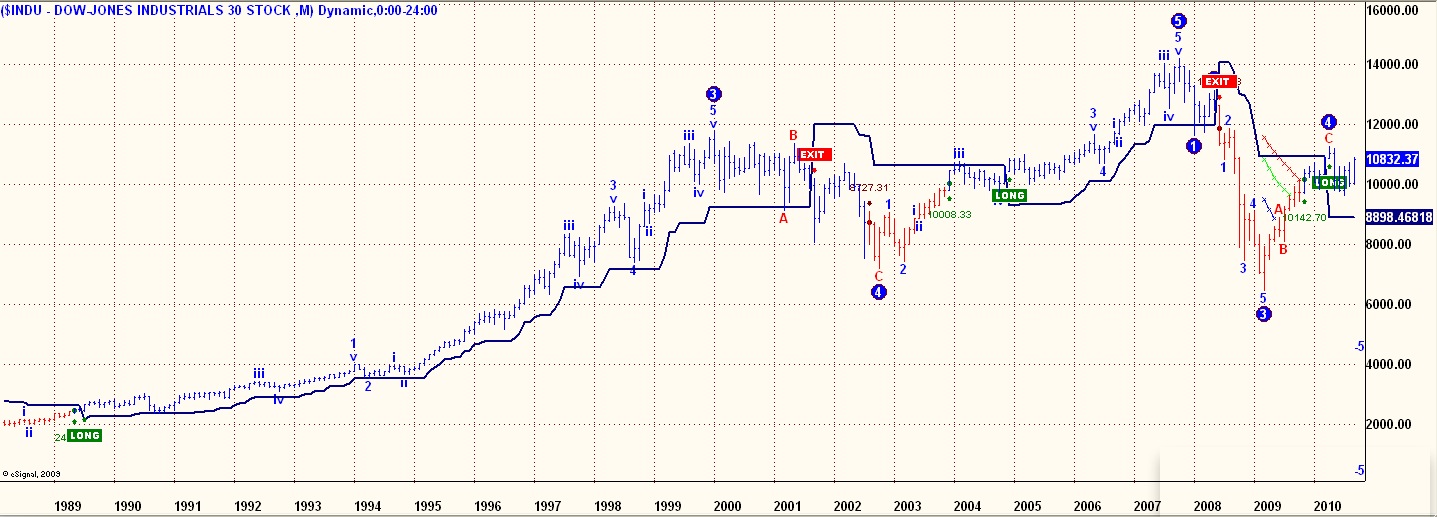
DJIA – Long Term Chart
Courtesy of Allan
[click on chart to enlarge]
Here is a perspective on the current rally in the context of a longer-term chart of DJIA. Not shown is a major BUY signal in 1981, briefly reversed by the 1987 market crash, but back LONG in 1989 for a 12-year rally. The EW analysis suggests that the next major move is a pretty significant decline once the current strength runs out.
Past performance is not a guarantee of future results.
Allan’s “Trend Following Trading Model,” is based on his trend-following trading system for buying and selling stocks and ETFs. Most trades last for weeks to months. Allan’s offering PSW readers a special 25% discount. Click here. For more details, read this introductory article.
******
![]()


