
 Crazy stuff, right?
If you have never before paid attention to Fibonacci Retracement Levels, I would strongly consider paying attention to the S&P chart below. This chart shows, 2 years later, a consolidation and breakout that could have been predicted in March of 2009. That's right, if you asked a Fibonacci technical guy where the S&P was going to consolidate on March 10th of 2009 – he would have said: "Assuming that yesterday was the bottom and coming off our high of 1,576, then I would say we will consolidate between 1,014 and 1,229."
Leonardo of Pisa (and independent republic at the time) was born in 1,175 and died at the ripe old age of 65. Pisa was a city of about 10,000 people – a mixture of Muslims, Christians and Jews. Construction on the great tower began in 1,173 and was not completed until 1,319 (so don't complain about modern union jobs!) but they knew that it was listing in 1,178 so the point is: Leonardo was born in a small town that had a huge architectural problem.
Fibonacci's father was a State customs worker (essentially overseeing floor trading) and encouraged his son to take up studies in mathematics which, at the time, included learning Hindu Vedic math, which was the foundation of modern algebra and which Fibonacci came to greatly respect, saying:
The knowledge of the art very much appealed to me before all others, and for it I realized that all its aspects were studied in Egypt, Syria, Greece, Sicily, and Provence, with their varying methods; and at these places thereafter, while on business. I pursued my study in depth and learned the give-and-take of disputation. But all this even, and the algorism, as well as the art of Pythagoras I considered as almost a mistake in respect to the method of the Hindus.
Thus Fibonacci became the driving force by which Hindu-Arabic numerals came to replace the Roman ones. Fortunately, at the time, the arts and sciences were still supported and he found the favor Emperor Frederick II, who funded his studies – even though they didn't make him any money (imagine that!). Fibonacci did not invent Fibonacci numbers (it was probably India's Pingala in 200 BC), he just realized they could be applied to natural growth and regression sequences and, as it turned out, commerce and trading tended to follow a similar pattern as growth tends to exhaust itself at certain, predictable levels – except when it is artificially stimulated, it seems!
Stimulus does make a huge difference. Our official government stimulus program ($819Bn) peaked out in early 2010 and the market took a very sharp dip as that began to ease off and the Fed's QE1 program wound down at about the same time. It is interesting to note that the Fed tends to write their biggest checks of the month, virtually without fail, during options expiration weeks. Perhaps this is why some people get the impression that Ben Bernanke is a lying bastard when he says the Fed has no intention of manipulating the stock market:
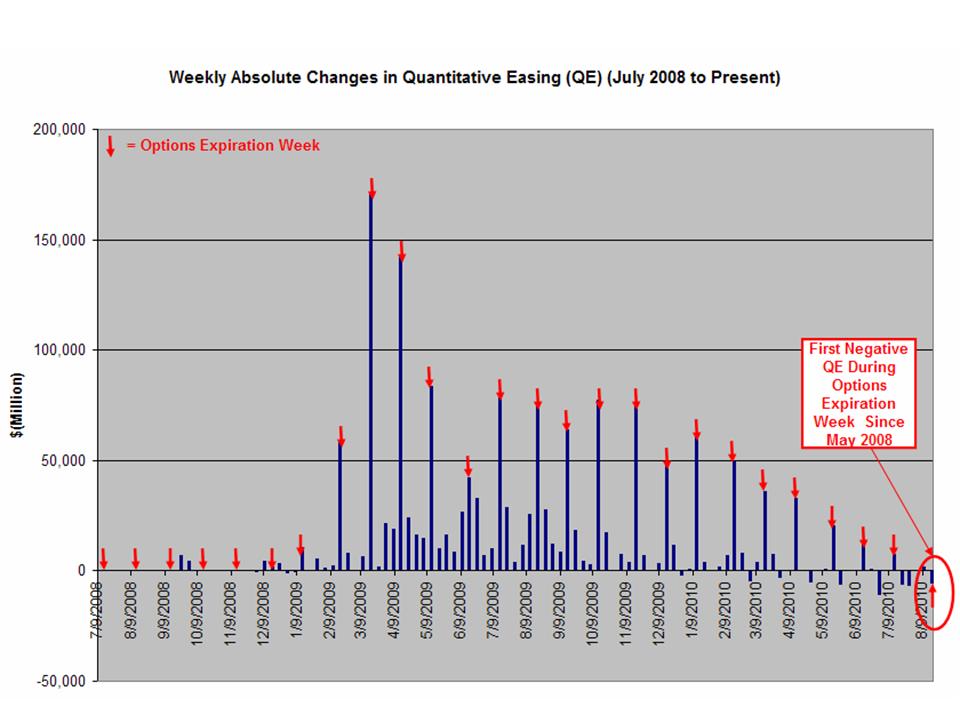
The second round of Quantitative Easting (explanation by Teddy Bears can be found here and here is a visual take on it that incorporates inflation effects) began in late November but the announcement of it in September began our latest rally. Originally, QE1 began in November of 2008 and the Fed bought $1.75 Trillion of bank debt, MBS, and Treasury notes, and their balance sheet reached a peak of $2.1 trillion in June 2010 and was projected, at the time, to fall to $1.7Tn by next year (2012). Unfortunately, the winding down of QE1, in May of 2010, immediately led to a 20% drop in the S&P between May and July.
Since we were well aware that the "recovery" was BS at the time, we began to get short in late April, as I put up the Member Virtual Portfolio titled: "Hedging for Disaster – 5 Plays that Make 500% if the Market Falls" and on May 5th, I put up "5% Rules! How Can We Be So Right?" with the following chart, showing how we were then using a combination of our 5% Rule and THESE SAME Fibonacci numbers to chart the future moves of the S&P, which we projected would pull back to test our 1,014 support using this chart at the time:
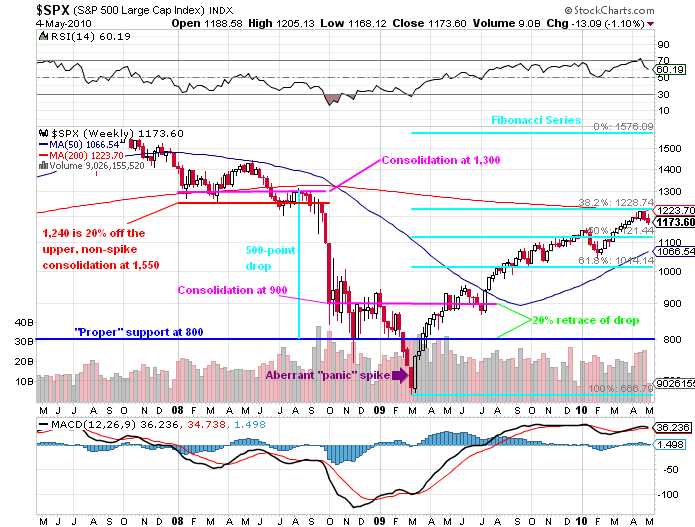
We had our "Flash Crash" that day, of all things, and the S&P plunged to 1,065.79, right to that rising 50 dma. Rising DMA's, by the way offer better support than falling ones and falling DMAs offer more upside resistance than rising ones. So THAT DAY, we fell right to the line of the rising 50 dma but we also very sharply recovered back to – you guessed it – 1,128.15, right back at that 50% line on the Fibonacci Table.
![]() By May 26th, we were back at 1,067 but still holding our 50 dma, so I put up the "Down and Dirty Buy List" that morning, filled with the same stocks you always hear me ramble on about but at prices I REALLY liked for the first time in a while. We still expected the additional sell-off down to our target and, I said to Members at the time: "Scale, SCale, SCAle, SCALe, SCALE into entries!" But what entries they were:
By May 26th, we were back at 1,067 but still holding our 50 dma, so I put up the "Down and Dirty Buy List" that morning, filled with the same stocks you always hear me ramble on about but at prices I REALLY liked for the first time in a while. We still expected the additional sell-off down to our target and, I said to Members at the time: "Scale, SCale, SCAle, SCALe, SCALE into entries!" But what entries they were:
AET $30 (now $38), AFL $40 (now $59), BA $63 (now $73), BAX $43 (now $53), C $3.78 (now $4.91), DCTH $14.50 (now $11.30 – yes, we did mis one!), DIG $27.67 (now $58.68), ES $6.35 (now $6.65), FAS $23 (now $34), FCX (yes, I was bullish on metals then!) $33.81 (now $52.95), GE $16.21 (now $21.44) and about 30 more stocks that came later in the Alphabet.
Sure, it was like shooting fish in a barrel and our hedged AND leveraged entries gave us stunning gains that outperformed the S&P by a mile but why was that? It was because WE WAITED! We waited patiently as we stopped buying the market around March because it was toppy and clearly only held up by stimulus so we waited for reality to hit and then we used our cash (and the bonus cash from our shorts) and we did, in fact BUYBUYBUY!
On June 7th we once again tested the 1,040 line on the S&P and that was good enough for me to narrow the Buy List down to our "Top 20" after I had decided the doomsayers were wrong. I had laid out my Global Bullish Premise in that weekend's "Getting Real With the Global GDP!" which all bears should read and in which I, as I often do, list out companies that I expect to survive any kind of global catastrophe. Even if you were not a Member, benefiting from our precise entries and leveraged option strategies – simply buying the basket of blue-chips I listed in that free post would have put you up an average of 37% in 8 months. That's not too shabby…
Beating the S&P is all about timing. Our buy/write strategy gives us 20% wriggle room on that timing and that means we can afford to be a little braver in our dip buying than unhedged investors while our ability to cover with bearish "Disaster Hedges" can give us additional protection on the way down and additional confidence on the way up. Keep in mind we were "Buying the F'ing Dip" before it was fashionable as my original bottom call was on March 6th of the prior year, the Friday before we hit rock bottom so the S&P was up 50% already and we were still very, VERY bullish.
As a timeline for our Virtual Portfolios from the June Buy List Forward (which can be viewed in our Virtual Portfolio Section), we next had our first $10,000 Virtual Portfolio on June 11th (finished at $36,000), I finished my top 20 picks on June 26th and added "9 Fabulous Dow Plays Plus a Chip Shot" as we bottomed on July 7th. Notice the pattern – on the dips I tend to put up buy lists. In between, we wait to see how our levels test out. I encourage Members to go back and see the picks, the plays and the fundamental logic we used to construct our virtual portfolios and keep the S&P chart handy to think about the mindset at the time. We are not contrarians – we are value investors who wait for the right price to make our entries and, when the right price comes – we do not walk away from the sale!
 Notice the shift we undergo on August 29th. It had been almost tow months since our last Bullish Virtual Portfolio and we finally got another correction. We decided to go cautious and I put up "Defending Your Virtual Portfolio With Dividends" saying: "In uncertain markets, dividends can give you a critical investing edge" as evidenced by the chart on the left.
QE2 was announced in late August and, Fed watchers that we are, we decided we were not being bullish enough so, on Sept 3rd – just 5 days after putting up a conservative list, I put up a dozen highly leveraged trade idea designed to make very big short-term money which I called the "September's Dozen." My comment to Members in that Virtual Portfolio's introduction was:
Not bullish enough? Let’s take a look at a quick dozen trade ideas for short-term gains. I like all these stocks long-term too (it’s always better to play short-term where your fallback is you own the stock long-term) but we haven’t been doing much gambling lately as it’s all been boring-old hedged positions that were smart, but not really giving us that immediate satisfaction you can get from some quick, monthly gains.
Are these trades riskier? Sure they are and they are trade ideas under the assumption that we hold our levels today and next week so no staying in them if the market sours but $75 oil and $3.40 copper and 2,200 on the Nas and 1,088 on the S&P give us some pretty easy markers to know if we’re still healthy.
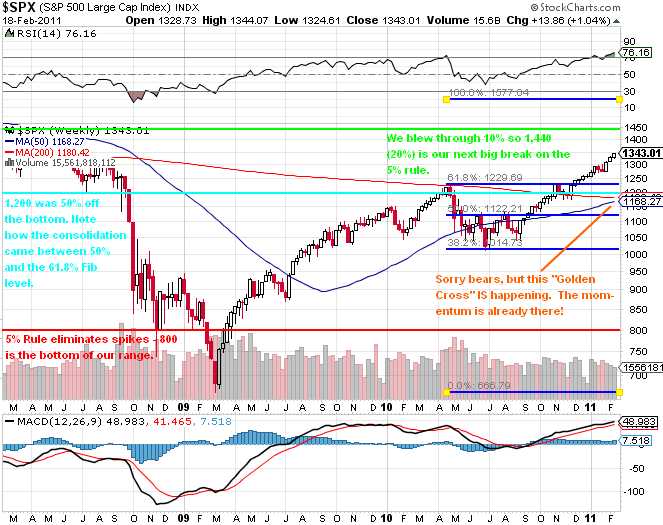
Sound familiar? It's the same thing I've been saying to Members for the past couple of weeks as we slowly get more and more bullish as we push through our resistance levels. The last set of levels to be conquered, just shy of 6 months since our September Dozen ultra-bullish virtual portfolio are our 100% lines (off the bottom) at: Dow 12,938, S&P 1,332, Nasdaq 2,530, NYSE 8,362 and Russell 684. After the September Dozen, we took a brief walk on the bearish side with "October's Overbought Eight." At this point, if you read that last sentence and looked on the chart and looked at that 50% Fibonacci line we were hitting in October and said to yourself "Ah, I can see why they went a little short that day" then – Congratulations! You have learned our secret system!
 We expected a pullback at about the 1,150 line but, all we got was token resistance and the short virtual portfolio died a quick death. By October 23rd, we had reconciled ourselves to go back to being bullish but it was again by "Defending Your Virtual Portfolio With Dividends," where I put up 10 high-yield stocks that we were able to play with great downside protection. Into Thanksgiving though, we finally lost our nerve as the S&P flat-lined along the 1,200 mark coming into the holidays and we thought it was to risky to push the 50% run in the markets we'd been riding any further.
After Thanksgiving, the World did not end and we were already bored sitting in cash so I suggested allocating a small portion of our virtual portfolios to "Breakout Defense" a virtual portfolio aimed at making 5,000% in 5 trades or less. The idea was that putting just 5% of your virtual portfolio's cash to work on highly-leveraged trades like these could give you a 25% gain on a fairly modest rise in the market. That way, we could sit out the holidays, almost entirely in cash (margin is used though) without worrying about missing the rally that actually happened.
Needless to say, we hit our goal of 5,000% as the S&P rose another 10% already! The market was rising so fast that, on Christmas Day, I put up "Secret Santa's Inflation Hedges for 2011" which were taking advantage of the rampant inflation that was very obvious to PSW Members, if not the Members of the Federal Reserve's Board of Governors. Unlike our Breakout Defense plays, the Secret Santa set was aimed at more conservative (well, for us!) trade ideas that a reasonably large position could be taken in to protect a percentage of your virtual portfolio (or, in my specific examples, your household budget) from inflation.
 I was so confident in my XLF trade idea that I promised there than anyone who signed up for a full-year Membership that week would get an additional year for free if that trade did not return 100% by expiration day in January of 2012. The logic was (see post) that $2,500 played on this trade (not mandatory but would be 63 contracts) would either give you back $5,000 by the year's end, so a 50% discount on one year – or it would give you a free year of Membership in 2012, so a 50% discount next year. As an added bonus, the maximum payout on the trade was $6,300, so a $3,800, profit is possible if all goes well (150%). The trade idea was:
- Buy XLF Jan 2012 $12/13 bull call spread for .80
- Sell 2012 Jan $11 puts for .40.
That is net .40 on the $1 spread and I am happy to report that the Jan $12/13 bull call spread is now .95 and the Jan $11 puts are now .20, which is net .75 and up 87.5% in just 7 weeks – very much on target for the full gain! Of course the other trades are doing very well too as they were all conservative (XLF was $15.87 and we picked a $12/13 spread) and all three (DBA, XHB, XLE) are in fine shape at the moment. It is important to go over these virtual portfolios regularly both to help new Members get on track with the flow of where the Members are generally investing as well as to hopefully remind all Members that you don't need to day trade to make good money in the markets – day trading is what we do to amuse ourselves while we wait for our boring, old, conservative hedges to pay us our 20, 40, 50 and 100% gains on the bulk of our investments. Look over these virtual portfolios and you'll find over 100 stocks I REALLY, REALLY like – even now, some of them are still on sale.
We were still on fire on Jan 31st and the Members wanted to be even more aggressive so we decided to roll our $10,000 Virtual Portfolio (now $34,000) into a new $25,000 Virtual Portfolio where we would aim to get to $100,000 by the end of the year. We initiated that one with a bearish stance, as we did expect a pullback at our old Breakout 2 levels but, just in case, the next week (Feb 5th) we once again went for the ultra bullish set of "Breakout Defense Part Deux – 5 More Trades that Make 500% in a Rising Market."
 That was our last Virtual Portfolio. The month is only half over so not a lot of pressure to come up with another one and I am trying to work through my inclination to put up another Disaster Hedge virtual portfolio, which this backward-looking exercise is all about… The Fed's current POMO schedule (QE2) runs through May and we've gotten very clear indicators (as discussed in this week's posts) that The Bernank is in "Damn the torpedoes and full speed ahead" mode.
That expression is very appropriate as it was uttered by Admiral Farragut during the civil war, when our country turned on itself in 1864 as the lead ship in the fleet was blown up by a torpedo, which was actually their word for mines back then. Farragut knew the battle was lost if they tried to slowly poke through the mined harbor, so it was victory or die as he had the fleet plow through the minefield on the way to what turned out to be a glorious, and very lucky victory (the mines were poorly made and most failed to explode).
That is very much the game admiral Beranke is playing with the US and even the Global economy as he ignores all the mines that are clearly in our economic path and forces the economy up to ramming speed – hoping to accomplish with momentum what he could not accomplish through finesse.
God help us all if he's wrong!