
Courtesy of Trader Mark at Fund My Mutual Fund
The same economists shocked by the original housing crash (prices can’t go up forever?), now appear to be in the fetal position as the much too obvious second leg of the downturn has arrived. While I do have an economist degree, living in the locale experiencing a 1 state Depression [Jan 27, 2011: Metro Detroit Home Prices Back to 1994 Levels…Before Accounting for Inflation] had me much more negative than those who live in the ivory towers of Manhattan or D.C.. I wrote a few years ago about a few articles that also opened my eyes to what was going on out there in the rest of the country. [May 30, 2005 – Fortune: Riding the Boom] [Sep 11, 2006: Option ARMs – Nightmare Mortgages] Hence in late 07, I showed with simple math why we were in for a doozy of a drop in the housing market. [Dec 6, 2007: What Should Median Housing Prices be Today?]
As you can see from the mid/late 1970s to 2001/2002 the ratio was consistent in a tight range between 2.6x to 3.0x. Essentially this means the median home price in this country was 2.6x – 3.0x median household income. And it’s been right around 2.8x for most of that time. That’s 30 years….
Then in 2002+, we had innovation…. great innovation… and 1% interest rates. Easy money. No mortgage regulation. Happy times. And crazy housing prices that detached from reality. In 2006 at the height of ‘innovation’ (where were these politicians 1 year ago? seriously), the ratio went "off" the chart, it appears 4.0x. After the ‘correction’ we’ve had, that ratio has fallen all the way to…. 3.8x.
In July 2006 at the height of insanity the median price of a home was $230,200
It has already fallen in less than a year (October 2006) to $207,800
Pain over, correction done – time to party. Right? Wrong.
What are median incomes nowadays? As of 2006 the median household income was $48,201.
$48,201 x 2.8 ratio (historical average for past 30 years) =$134,962
Folks that is still nearly $73K away…. or a drop of 35% from October 2007 levels. And a drop of 41% from peak levels in July 2006.
Correction over? Not by a long shot.
Now that’s assuming we return to historical norms. I am fully confidant that by the time this is all said and done NEW financial innovations will be introduced (along with bailouts) which will keep prices elevated above where they ‘should be’ without the ‘not so invisible hand’ propping things up.
Sure enough we’ve had bailouts, handouts, the type of Federal Reserve policy I never imagined, etc etc. Much of it just good money thrown down a rabbit hole to try to stop reality. [Mar 5, 2009:WSJ – Mortgage Bailout to Aid 1 in 9 Homeowners] [Dec 8, 2008: More than Half of Homeowners with Modified Loans are Back in Trouble]
So here we are 3.5 years later. With record affordability. And close to record mortgage rates. And still housing prices are dropping. I won’t go into the litany of reasons that we discussed ad nauseam in 2008-2009 on why this would be the type of housing downturn the likes we’ve never seen before. But let’s be clear, despite the protestations of most on financial infotaintment TeeVee we have years more to go before prices clear.* And of course, this May, June, July we will see an uptick in housing activity – as we DO every spring/early summer – and the Kool Aid drinkers will be making their bottom call yet again. (3rd year running) One day these broken clocks will be correct.
*As always I am excluding places with bubble economics like Washington D.C. [Mar 11, 2010: [Video] America’s 3 Wealthiest Counties Now Ring Washington D.C.], areas where Federal Reserve handouts galore continue to the financial community like Manhattan, or "America’s Australia" aka the northern plains states.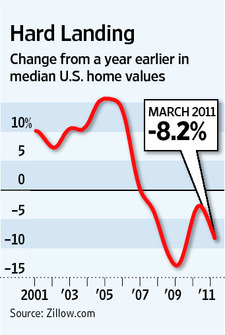
****
This morning’s Wall Street Journal cover piece is about the "shocking" downturn in the housing market, without the government paying people to buy homes as we did 12-24 months ago.
- Home values posted the largest decline in the first quarter since late 2008, prompting many economists to push back their estimates of when the housing market will hit a bottom. Home values fell 3% in the first quarter from the previous quarter and 1.1% in March from the previous month, pushed down by an abundance of foreclosed homes on the market, according to data to be released Monday by real-estate website Zillow.com. Prices have now fallen for 57 consecutive months, according to Zillow.
- Last year, the housing market showed signs of improving as price depreciation slowed in some markets and stabilized in others. In response, a number of economists began forecasting that housing would hit a bottom in late 2011, then begin to recover. But the improvements, spurred by federal programs that gave buyers up to $8,000 in tax credits, proved fleeting. (uhh, I believe the current parlance is "proved transitory") Sales collapsed when the credits expired last summer, and prices in many markets have been falling ever since.
- While most economists expected sales to decline after tax credits expired, the drag on the market has been greater than many anticipated. "We expected December and January to be bad" as the market reeled from the after-effects of the tax credit, said Stan Humphries, Zillow’s chief economist. But monthly declines for February and March were "really staggering," he said. They indicate "a reflection of the true underlying demand, which is now apparent because most of the tax credit is out of the system, and it’s being completely overwhelmed by supply."
- Prices are decelerating in large part because the many foreclosed properties that often sell at a discount force other sellers to lower their prices. Mortgage companies Fannie Mae and Freddie Mac have sold more than 94,000 foreclosed homes during the first quarter, a new high that represented a 23% increase from the previous quarter. More could be on the way: They held another 218,000 properties at the end of March, a 33% increase from a year ago.
- The companies are bracing for more bad news: On Friday, Fannie reported a $6.5 billion net loss, largely as it boosted loan-loss reserves in anticipation of falling home prices. (I used to post the Fannie Mae losses on the blog, but it appears no one cares anymore about Fannie coming to the taxpayer every quarter and asking for more handouts – it’s just the new American status quo I suppose. I do get a kick they still do it on a Friday evening each quarter when everyone is headed home for the weekend)
- Paul Dales, a senior U.S. economist with Capital Economics, says prices could fall by as much as 10%, down from his previous forecasts of around 5%. A March survey of more than 100 economists by MacroMarkets LLC forecasts a 1.4% drop in prices this year, down from the December estimate of a 0.2% decline.
- Other home-price indexes also show weakness. The widely followed Case-Shiller index published by Standard & Poor’s showed that prices climbed from April 2009 until last summer, when they started declining as tax credits expired. Today, prices are on the verge of reaching new lows, the index shows. The Case-Shiller index tracks repeat sales of previously owned homes using a three-month moving average.
- According to the Zillow index, a handful of California markets and Washington, D.C., saw price appreciation last year, but that has since reversed. Mr. Humphries attributes the "double dip" in those markets, which include Los Angeles, San Francisco and San Diego, to the way in which the tax credit stimulated demand from buyers. When the tax credit went away, markets were left with rising supply from foreclosures but with less demand from buyers.
- To be sure, steep declines in home prices along with mortgage rates near their lowest levels in decades have helped make housing more affordable than at any time in the past 30 years, according to Zillow. Markets that have lower levels of foreclosures, such as Dallas, and those with better job-growth prospects, such as Washington, are faring better.
- Buyers who qualify for mortgages are demanding bigger discounts as added insurance against further declines in values. Sellers, meanwhile, are balking. "More often, they don’t want to take the first offer," says Jeffrey Otteau, president of Otteau Valuation Group, an East Brunswick, N.J., appraisal firm. "What they don’t realize is, in an oversupplied market, the next offer is for less."
- While some analysts have argued that home prices need to fall to "clearing prices" that will attract more buyers, price declines could also complicate any recovery by pushing more borrowers under water. Zillow estimates that more than 28% of borrowers owe more than their homes are worth nationally. Those numbers are much higher in hard-hit markets such as Phoenix, where more than two-thirds of borrowers owe more than their homes are worth.

Markewatch.com also weighs in today:
- Average home prices are down 8% from a year ago, 3% over the quarter, and are falling at about 1% every month, according to Zillow.
- Zillow now predicts prices will fall about 8% this year and says it no longer expects the market to bottom before 2012. “There’s no way we can get to flat, from these depreciation levels, in the last nine months of the year,” says Zillow economist Stan Humphries. “Demand is a lot more anemic than we had previously thought.”
- Falling real-estate prices mean spiraling hidden losses throughout the economy, from banks to homeowners. Remember Japan’s “zombie banks”? Here in America we have “zombie homeowners.”