

 Wow, just when we're trying to get bullish, they take away the punch bowl.
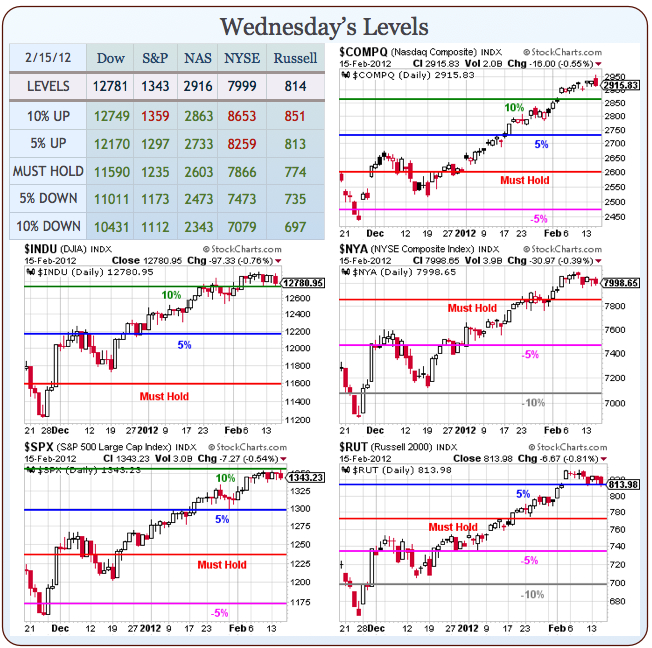
They almost had us yesterday, all they had to do was get that S&P over 1,359 and we were planning to join in with the crowd – but only as long as that line held. That's why we have lines, right folks? They help us to be DISCIPLINED so we don't let our "feelings" get in the way of our trading. We are NOT technical traders but you HAVE to respect the technicals simply because so many people are technical traders.
It's the same reason we force ourselves to watch CNBC – they move the markets. I wish they didn't as I can feel my brain cells dying as they speak but you can watch Bloomberg all day long and not one thing they say affects a stock but just last night, CNBC released the TBoone, who spouted off more of his insufferable BS about oil going to $125 and gave us another fantastic shorting opportunity betting against him at $102 (now $101.24). So how can we not watch CNBC – they are a counter-party driving machine!
But this is not about TBoone, or the elitist propaganda network – this is about tecnicals, about our Big Chart and our 10% lines and about the Dow, the S&P 500 and the Russell 2000, who all face critical tests today. The S&P is, of course, our most important index and not even AAPL could get them over our 10% line (1,359) on yesterday's silly spike in the morning. That led to (finally) a pullback in the markets and a nice test this morning of 12,749 on the Dow and 813 on the Russell. Holding those levels will be bullish but we already bet they'll fail in yesterday's Member Chat as we added a couple of aggressive short hedges to our already too bearish (maybe) collection, 10 minutes after I was able to glance over the Fed Minutes (2:10):
- SQQQ March $12/14 bull call spread at $1, selling TZA March $18 puts for $1.03 for a .03 credit on the $2 spread.
- TZA March $19/23 bull call spread at $1.05, selling TZA March $18 puts for $1.03 for .02 on the $4 spread.
Obviously my take on the Fed Minutes was not bullish (see full notes here). Bernanke had promised QEvermore on January 25th – what more could we possibly learn from the minutes? Actually what we learned was that only a few of the Fed members favored another round of QE while a few said it "could become necessary" if the economy slowed but the US economy did not slow, did it? Inflation is not lower than 2%, is it? Unemployment is not up, is it? Well then – NO QE FOR YOU!
We also got this cool table that gives us a good insight into just how unbalanced those Fed brains are. Despite predicting a 2% drop in unemployment by 2014 and 3 years of 3% GDP growth (maybe 4.3%!), not ONE Fed Governor sees the Core Inflation Rate rising past 2% – not even at the top of their range.
| Variable | Central tendency1 | Range2 | ||||||
|---|---|---|---|---|---|---|---|---|
| 2012 | 2013 | 2014 | Longer run | 2012 | 2013 | 2014 | Longer run | |
| Change in real GDP | 2.2 to 2.7 | 2.8 to 3.2 | 3.3 to 4.0 | 2.3 to 2.6 | 2.1 to 3.0 | 2.4 to 3.8 | 2.8 to 4.3 | 2.2 to 3.0 |
| November projection | 2.5 to 2.9 | 3.0 to 3.5 | 3.0 to 3.9 | 2.4 to 2.7 | 2.3 to 3.5 | 2.7 to 4.0 | 2.7 to 4.5 | 2.2 to 3.0 |
| Unemployment rate | 8.2 to 8.5 | 7.4 to 8.1 | 6.7 to 7.6 | 5.2 to 6.0 | 7.8 to 8.6 | 7.0 to 8.2 | 6.3 to 7.7 | 5.0 to 6.0 |
| November projection | 8.5 to 8.7 | 7.8 to 8.2 | 6.8 to 7.7 | 5.2 to 6.0 | 8.1 to 8.9 | 7.5 to 8.4 | 6.5 to 8.0 | 5.0 to 6.0 |
| PCE inflation | 1.4 to 1.8 | 1.4 to 2.0 | 1.6 to 2.0 | 2.0 | 1.3 to 2.5 | 1.4 to 2.3 | 1.5 to 2.1 | 2.0 |
| November projection | 1.4 to 2.0 | 1.5 to 2.0 | 1.5 to 2.0 | 1.7 to 2.0 | 1.4 to 2.8 | 1.4 to 2.5 | 1.5 to 2.4 | 1.5 to 2.0 |
| Core PCE inflation3 | 1.5 to 1.8 | 1.5 to 2.0 | 1.6 to 2.0 | 1.3 to 2.0 | 1.4 to 2.0 | 1.4 to 2.0 | ||
| November projection | 1.5 to 2.0 | 1.4 to 1.9 | 1.5 to 2.0 | 1.3 to 2.1 | 1.4 to 2.1 | 1.4 to 2.2 | ||
Now, in a sense, they are probably right because, no matter how bad things get, the Fed will certainly devise a way to recalculate inflation to pretend it doesn't exist – so I guess we'll have to give them that one. The Fed has lots of other lovely charts that look very much like they come out of some economic fantasy camp with all the things we like going up and all the icky things going down and inflation (my favorite) turning rock steady at 2% despite the fact that it was over 3% under the same conditions (pre-2007) they think we are going to be back to in two years.

Isn't that just PERFECT! China couldn't make prettier projections than that – and those guys REALLY try hard! These projections give me far less confidence in the Fed than they would if they said 0-5% GDP growth and 5-10% Unemployment and 1-10% Inflation because at least I would feel like these bozos had some real discussions and were prepared for any possibility. If you follow the link, the last set of charts says it all – uncertainty of projections on GDP Growth, and Unemployment are extreme – to say the least.
 But clearly, the ranges of their projections don't reflect this uncertainty at all and therefore, we must conclude that this is nothing more than a political document – as much as any we get from China – and is not a reflection of any kind of serious economic modeling. Obviously, we're not shocked by this – it's what we expect from this joke of an organization. Unfortunately, there will be Hell to pay when this thing begins to fall apart. At least now we have a road map that tells us when we're off the Government rails – thanks for the transparency, boys!
All is well here and pay no attention to that Troika behind the curtain, they have everything well in hand, I'm sure! Spain's GDP fell 0.3% last Quarter and we're not going to worry about that because they just sold some Bonds (more debt?) at 4.4% so all must be well. Coincidentally, the ECB just bought a bunch of Spanish Bonds for 4.4% so they are making money too – how wonderful to see such a robust demand for Spanish debt that's not fake at all!
SPAIN
I know when I look to buy bonds, the first thing I ask my broker is "which countries have economies that are contracting with 20% unemployment, a collapsing housing market, declining industrial output and a 284% debt to GDP ratio?" Then he says "why Spain would be perfect for you" and then that's where I want to put all my money! I guess, if I want to look on the bright side, I'd say – "At least it's not Ireland":
IRELAND
Keep in mind the above numbers are AFTER austerity measures and AFTER they already got a bailout – see how well it's working! What could possibly go wrong? As you can see above, every man, woman and child in Ireland owes 390,969 Euros ($508,259), which works out to a bit over $1.5M per family – there's a great interactive chart here – and most of that money is owed to the UK ($135Bn) but we're not going to worry about it because it's a drop in the bucket to the UK's $1.7Tn in debt and besides, they owe Ireland $147Bn of their own so each Irish family has already lent Britain about $600,000 through their own Government's largess and none of this should concern us because it's not like any of them have the ability to ever pay it off so – no point in worrying, right?
 Back home in the USA, "only" 219,941 foreclosure filings were placed on US homes in January and that's 19% less than last year when 1 in 33 US homes were foreclosed on.
However, that reflects the hold-up in foreclosures as the banks worked out their legal issues regarding rights to foreclose and, now that they've settled that for a wrist-slap, we can expect the rates to tick up fast – like they are in Florida, where filings are UP 20% from last year, along with Connecticut and Massachusetts. Certainly one out of 20 homes on your block being foreclosed is nothing to worry about – still 19 left this year…
See, I can be bullish! It's easy – just take any horrible news you hear and pretend it doesn't affect you or any of the companies you invest in (or any countries you live in). It's "Not in my backyard" to the power of infinity and that is literally true for us as we are members of the investing class and we have jobs and money and health care plans and retirement savings – as do most of our neighbors so: Things look great to us, don't they?
Just remember darling, it IS better to look good than to feel good and, if we do manage to hold our technicals – it will be maaaahvelous for the bulls but, until we see it – contniue to color us skeptical.