


The crowd is usually right during the meat of a trend, but they are catastrophically wrong at the turns. If you have ever bought into a parabolic move only to see it collapse the next day, you aren’t alone; you were simply acting as the exit liquidity for traders who actually understand stock market sentiment analysis. It is a frustrating cycle where retail FOMO fuels the top and panic selling provides the bottom for those who know how to read the room. You probably feel like the big institutions have a secret playbook, and frankly, they do.
We are going to flip that script by teaching you how to identify market extremes and trade with the cold, calculated precision of “The House.” This guide covers how to master the psychological indicators that drive price action in 2026, from AI-powered intent recognition to the latest SEC focus on algorithmic transparency. You’ll learn to develop a contrarian mindset that avoids common retail traps while utilizing professional-grade sentiment tools to spot reversals before they happen. We’re moving past simple charts to analyze the collective madness of the market, ensuring you stay on the right side of the trade when the herd eventually thunders off a cliff.
Key Takeaways
- Learn why fundamentals identify the right assets while sentiment reveals when it’s the perfect moment to strike.
- Master technical indicators like the VIX and Put/Call Ratios to distinguish between standard volatility and genuine market reversals.
- Develop a systematic five-step approach to stock market sentiment analysis that allows you to profit from the crowd’s inevitable emotional mistakes.
- Identify the warning signs of a “crowded trade” so you can exit safely before the retail panic begins.
- See how real-time trading rooms help you filter out mainstream hype so you’re always trading with a calm, contrarian edge.
Decoding the Market’s Mood: What is Sentiment Analysis?
Think of the market as a massive, high-stakes poker game. Fundamentals tell you the value of the cards in your hand, but Market sentiment tells you how the other players are feeling. It is the collective attitude of investors toward a specific stock or the broader economy. While fundamental analysis focuses on balance sheets and P/E ratios to tell you what to buy, sentiment is the clock that tells you when to pull the trigger.
If you ignore the mood of the room, you are trading blind. Prices don’t move because of numbers on a spreadsheet; they move because humans decide to buy or sell. A 2025 JPMorgan research report estimated that news sentiment drives approximately 35% to 40% of intraday price movement in U.S. equities. This proves that the crowd’s emotional state isn’t just noise; it is a primary driver of liquidity. “The House” knows this. Professional traders recognize when the retail herd is being led to the slaughter by their own greed. They look for extremes. When everyone is euphoric, the House prepares for a drop. When panic sets in and the crowd flees, the House starts shopping for bargains.
The Psychology of Price Action
Fear and greed are more powerful than any valuation model. Greed manifests as FOMO, pushing prices into unsustainable bubbles as traders chase green candles. Fear, on the other hand, causes irrational selling at the exact moment prices are most attractive. Mastering stock market sentiment analysis means accepting that the most profitable trades usually feel the most uncomfortable. You have to buy when it feels like the world is ending and sell when it feels like the party will never stop. This creates the “wall of worry” where markets climb despite negative headlines because the sellers have already exhausted themselves.
Sentiment vs. Technical Analysis
Many traders confuse sentiment with technical analysis, but they serve different roles. Sentiment is a leading indicator; it tells you what people are thinking before they act. Technical analysis shows you what they actually did. By using stock market sentiment analysis to confirm or invalidate a breakout, you gain a massive edge. If a stock hits a new high but sentiment indicators show retail traders are exhausted, “The House” sees a “sucker’s rally” rather than a true trend. We don’t just look at how much is being bought; we look at who is doing the buying. This distinction is what separates the savvy insider from the exit liquidity.
Essential Indicators for Measuring Market Sentiment
If you want to trade like the House, you need a dashboard that tracks the crowd’s pulse. While there are dozens of niche tools, a few heavy hitters dominate the landscape of stock market sentiment analysis. These indicators take the raw emotion of millions and condense it into actionable data. They help you see through the “sham” rallies and the manufactured panics that characterize modern markets. Without these tools, you’re just guessing; with them, you’re reading the tape like a pro.
The VIX: Your Guide to Market Volatility
The VIX is the undisputed king of sentiment tools. Formally, the VIX is a measure of 30-day expected volatility derived from S&P 500 options. Informally, it’s the market’s “Fear Gauge.” When the VIX sits at 15, investors are complacent, often dangerously so. When it spikes to 30 or higher, blood is in the streets. Because the VIX is mean-reverting, these spikes often signal capitulation bottoms where the House starts buying. If you are tracking Financial sentiment analysis through advanced models, you’ll see that volatility often precedes price shifts, making the VIX a vital leading indicator for identifying when a trend is about to snap.
Put/Call Ratios and Option Flow
Option flow reveals where the money is actually moving. The Put/Call ratio measures the balance between speculators buying calls (betting on a rise) and hedgers buying puts (betting on a fall). Extreme readings are almost always contrarian signals. If everyone is buying calls, the market is likely at a short-term top because there’s nobody left to buy. Conversely, heavy put buying suggests the crowd is terrified. The House watches this to differentiate between institutional “smart money” hedging and retail “dumb money” panic. You can see these dynamics play out daily in our real-time trading rooms, where we filter the noise from the signal.
Beyond options, we look at the AAII Investor Sentiment Survey and Market Breadth. The AAII survey tracks the retail crowd’s weekly bias; it is famously wrong at major turning points. Market Breadth, specifically the Advance-Decline line, tells you if a rally is healthy. If the S&P 500 is hitting new highs but only five stocks are doing the heavy lifting, the rally is a sham. A healthy market needs participation. When breadth fails while sentiment is euphoric, the House knows the exit door is about to get very crowded.
The Contrarian Edge: Why the Crowd is Usually Wrong
The herd feels safe in numbers, but in the markets, safety is an illusion that usually ends in a stampede toward a tiny exit. If you want to understand why the crowd is usually wrong, you have to look at the psychology of comfort. Most people only feel confident buying after a stock has already doubled. By then, the “smart money” is already looking for the door. This is where a comprehensive guide to market sentiment analysis becomes your most valuable asset. It helps you identify “Crowded Trades” where the risk-to-reward ratio has become toxic because everyone is already on the same side of the boat.
Social media hype cycles only accelerate this process. Platforms like Twitter and Reddit create echo chambers that amplify bullishness until it reaches a fever pitch. Mainstream financial media then swoops in to reinforce the trend, providing the “rational” justification for why a stock should trade at 100 times earnings. By the time your neighbor is giving you stock tips, the sentiment is already at a terminal extreme. The “Maximum Pessimism” principle, famously championed by Sir John Templeton, suggests that the best time to buy is when things feel the most hopeless. When the headlines are screaming about a total collapse, that is usually when the selling pressure has finally exhausted itself.
Spotting Market Extremes
A blow-off top is easy to spot if you aren’t blinded by greed. Look for parabolic price moves, sudden celebrity endorsements, and a total lack of bearish dissent in the comments sections. Conversely, a panic bottom is marked by forced liquidations. This is when traders sell not because they want to, but because their brokers are making them. Staying grounded during these periods is difficult, which is why a Phil Stock World membership is essential for maintaining a clear, objective perspective when the rest of the world is losing its mind. We help you distinguish between a healthy dip and a structural breakdown in stock market sentiment analysis.
The “Be the House” Strategy
Instead of being the gambler, we prefer to be the casino. This means selling “lottery tickets” to the speculators when stock market sentiment analysis shows that option premiums are through the roof. When the crowd is desperate to buy calls, we are happy to sell them. Hedging isn’t just an option; it’s a requirement for survival in volatile markets. We maintain a skeptical, street-smart mindset toward any “guaranteed” winner, knowing that the only real guarantee in the market is that the crowd will eventually be wrong. By focusing on risk management and contrarian entries, you stop being the exit liquidity and start being the one who profits from it.
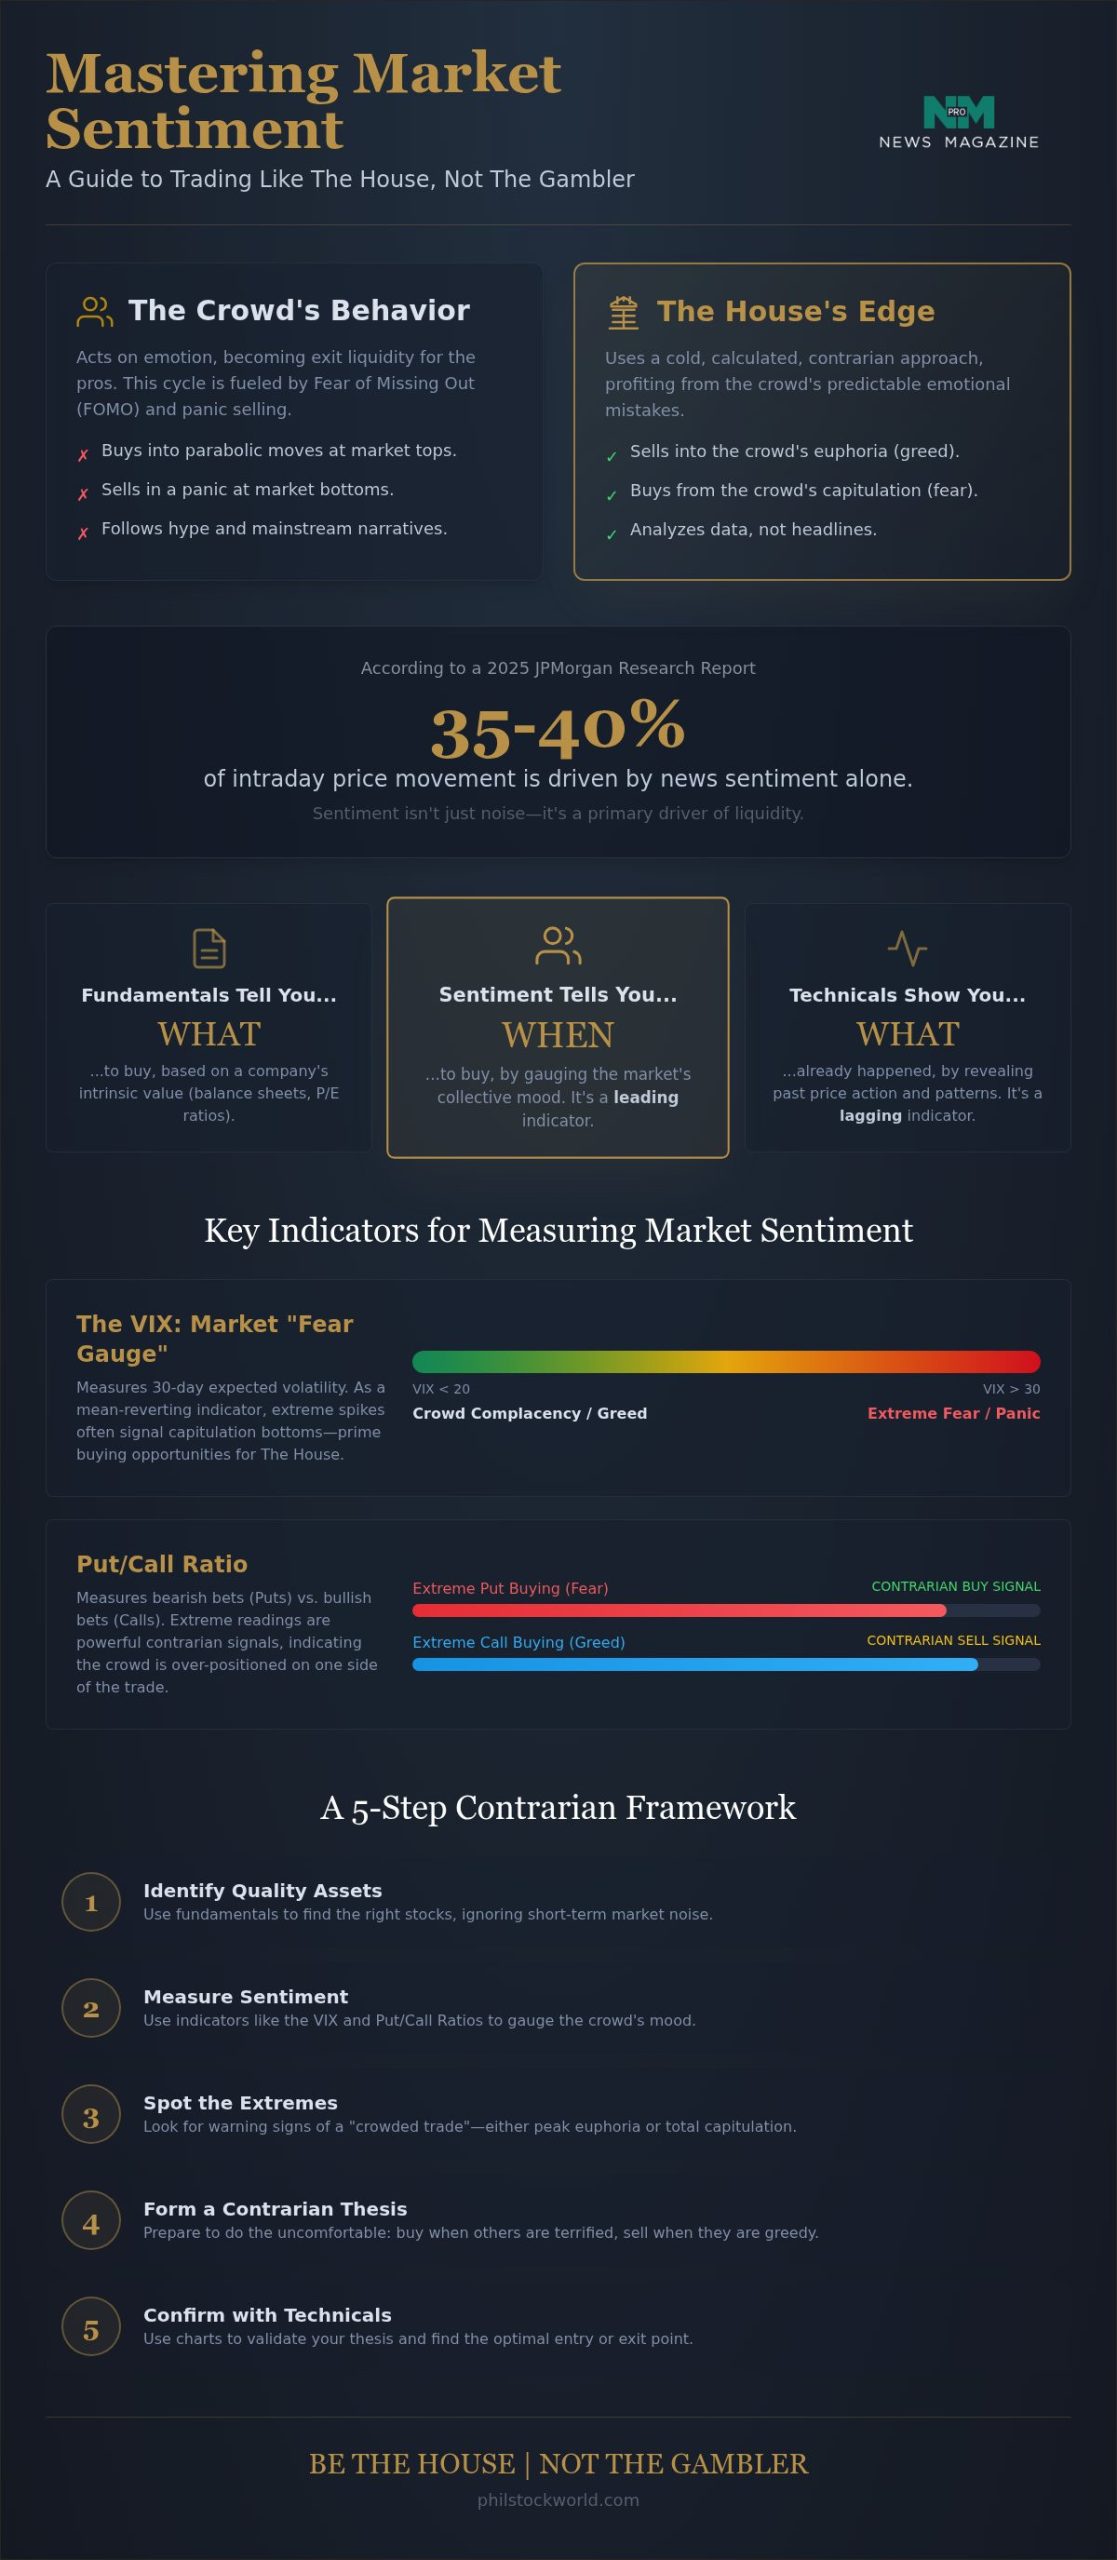
How to Conduct Your Own Sentiment Analysis in 5 Steps
Data without a process is just noise. Most traders fail at stock market sentiment analysis not because they lack information, but because they don’t have a repeatable workflow to filter it. To trade like the House, you need a systematic way to gauge the crowd’s temperature before you risk a single dollar. This five-step process ensures you aren’t just guessing based on a single headline or a loud voice on social media.
- Step 1: Check the Macro Pulse. Start with the big picture. Review the VIX and the CNN Fear & Greed Index to see if the broader market is leaning toward complacency or terror.
- Step 2: Analyze Option Flow. Look at the Equity Put/Call Ratio. You are looking for extremes; anything above 1.0 or below 0.6 suggests the crowd is leaning too hard in one direction.
- Step 3: Evaluate Breadth. Check the Advance-Decline line. If the “Generals” (large-cap tech) are hitting new highs but the “Soldiers” (the rest of the market) are lagging, the rally is likely a sham.
- Step 4: Sentiment Surveys. Compare the AAII retail survey with institutional positioning. When retail is 60% bullish and institutions are selling, the trap is set.
- Step 5: Synthesize and Hedge. Align your findings. If three out of four indicators show extreme euphoria, it is time to tighten stops or buy protection.
Building Your Daily Sentiment Dashboard
You don’t need a Bloomberg terminal to master this. Reliable data is available for free through the CBOE and major financial portals. Spend just 15 minutes each morning before the bell to update your dashboard. By documenting these daily readings in a trading journal, you transform fleeting market noise into a historical database that reveals how price action typically reacts to specific emotional extremes. This habit builds the “tape reading” muscle that separates pros from amateurs. If you want to see how we synthesize this data live, join us for our educational webinars where we break down the daily sentiment shift.
Avoiding Common Sentiment Pitfalls
The biggest danger in stock market sentiment analysis is being “too early.” Sentiment can stay extreme much longer than most traders can stay solvent. Just because the crowd is euphoric doesn’t mean the market will crash tomorrow; it means the risk of a crash is rising. This is why we combine sentiment with advanced option trading strategies to limit our downside while we wait for the turn. Never bet the farm on a sentiment signal alone. Use it to adjust your position sizing and hedging, ensuring you are prepared for when the herd eventually thunders off the cliff.
Beyond the Numbers: Real-Time Sentiment in the PSW Trading Room
Static indicators like the VIX or Put/Call ratios are essential, but they are often like looking in the rearview mirror. In a high-speed trading environment, sentiment can shift in seconds. By the time a weekly survey is published or a monthly report drops, the move is often over. This is where real-time stock market sentiment analysis becomes a survival skill. You need to see the pulse of the market as it beats, not after the autopsy has been performed by the mainstream media.
A trading community acts as a massive filter for the noise that usually leads retail traders astray. While the talking heads on TV are busy explaining why a stock “should” be going up based on old data, a room of seasoned traders is watching the actual order flow and emotional shifts happening right now. This collective intelligence allows you to act on sentiment shifts before they ever hit the headlines. It is the critical transition from being a retail victim of FOMO to becoming a “House” operator who understands how to profit from the crowd’s chaos.
For those interested in exploring how social trading technology can establish a trust layer through verified participation, you might also visit Tyrian Trade.
Interactive Trading and Expert Guidance
There is an immense benefit to watching veteran traders interpret a sudden news spike or a geopolitical event in real-time. “The House” always has a plan for both directions; we focus on risk management rather than directional gambling. In our interactive trading rooms, you get access to live market commentary that doesn’t pull punches. We analyze the “why” behind the move, helping you stay calm when the rest of the market is panicking. This isn’t about following a guru. It’s about learning to read the tape yourself so you can make decisions with confidence.
Your Next Steps to Market Mastery
Moving from education to execution requires more than just reading a guide. It takes a disciplined, peer-reviewed approach to ensure you aren’t falling into your own psychological traps. A Premium Membership gives you the tools to stay ahead of the curve, but the real value lies in the community that values logic over hype. If you are ready to see how your current strategy holds up against the “House” methodology, a Virtual Portfolio Review can provide the granular analysis you need to plug the leaks in your risk management.
Market mastery isn’t a destination; it’s a process of constant refinement. By integrating professional stock market sentiment analysis with a contrarian mindset, you stop chasing green candles and start anticipating the turns. Join a group that operates outside the traditional corporate mold and start trading with the perspective of an insider. The crowd is almost always wrong at the extremes. Make sure you’re the one on the other side of their trade.
Mastering the Market’s Emotional Pulse
The market is a psychological battlefield where the most disciplined minds win. By now, it’s clear that stock market sentiment analysis isn’t just a niche skill; it’s the difference between being a predator or prey in the 2026 landscape. You’ve learned how to spot the “sham” rallies using breadth and why the VIX serves as your primary fear gauge. Most importantly, you now understand that the crowd’s most confident moment is usually their most dangerous. When euphoria reaches a fever pitch, “The House” is already looking for the exit.
Harnessing the energy of a crowd is a powerful tool, whether in the trading pits or at a major corporate event. If you want to build that same level of enthusiasm for your own brand, check out Rally Towels for high-quality wholesale promotional products that make an impact.
Trading with a contrarian edge means moving beyond static charts to embrace a dynamic, risk-managed worldview. You don’t have to navigate these emotional extremes alone. Stop following the herd and start trading like “The House” with a Phil Stock World membership today. Our community provides an immediate edge through real-time trade alerts, private interactive trading rooms, and daily expert market commentary that cuts through the mainstream hype. It’s time to stop reacting to the noise and start anticipating the move. We’ll see you on the inside.
Frequently Asked Questions
What is the most reliable stock market sentiment indicator?
The VIX and the Put/Call ratio are widely considered the most reliable tools, but no single indicator works in a vacuum. Effective stock market sentiment analysis requires a dashboard approach that synthesizes multiple data points. We look for confluence; when three or four indicators hit extremes simultaneously, the signal becomes much stronger. Relying on just one is a recipe for getting caught in a head-fake.
How does the VIX relate to market sentiment?
The VIX measures the market’s expectation of 30-day volatility and acts as a direct reflection of investor fear. When the VIX spikes, it means traders are scrambling to buy protection, signaling a potential bottom. Conversely, a very low VIX suggests the crowd is too comfortable, which often precedes a sharp correction. It’s the ultimate “Fear Gauge” for those looking to trade against the herd.
Is sentiment analysis better than technical analysis?
Neither is superior; they serve different roles in a complete trading strategy. Technical analysis shows you the historical price levels where buyers and sellers have met, while sentiment tells you the emotional state of the players currently on the field. Think of technicals as the map and sentiment as the weather forecast. You need both to navigate safely, but sentiment often provides the leading signal that a chart pattern is about to break.
Can I use sentiment analysis for day trading?
Yes, though day traders must focus on high-frequency data like intraday option flow and real-time news sentiment. For short-term moves, watching the 15-minute VIX or sudden shifts in social media volume can reveal where liquidity is about to dry up or surge. It’s about catching the micro-panics and mini-euphoria cycles that happen between the opening bell and the close.
What is a contrarian sentiment signal?
A contrarian signal occurs when sentiment reaches a lopsided extreme that suggests the current trend is exhausted. If the vast majority of retail traders are bullish, there’s often nobody left to buy, making a price drop inevitable. This “Maximum Pessimism” or “Maximum Euphoria” creates an opportunity for the savvy trader to take the opposite side of the crowd’s bet, effectively “being the House.”
Does social media sentiment actually affect stock prices?
Social media sentiment is a massive driver of short-term liquidity, particularly in small-cap and “meme” stocks. Research from 2025 suggests that news and social sentiment drive nearly 40% of intraday price movement in certain sectors. While it can be noisy, professional-grade stock market sentiment analysis tools now use AI to filter out the bots and identify genuine shifts in retail intent before they trigger a price spike.
How often should I check market sentiment indicators?
You should check your primary sentiment dashboard at least once a day before the market opens. Active traders often monitor indicators like the Put/Call ratio in real-time to spot shifts during the trading session. If you are a long-term investor, a weekly review of the AAII sentiment survey and market breadth is usually enough to ensure you aren’t walking into a macro-trap.
Why do professional traders care about the Put/Call ratio?
Professional traders use the Put/Call ratio to see where the money is actually being bet, not just what people are saying. It reveals the balance between speculators buying calls and hedgers buying puts. When the ratio reaches an extreme, it signals that the market is over-leveraged in one direction, creating a perfect setup for a reversal that catches the “dumb money” off guard.

