

Courtesy of Sabrient Systems and Gradient Analytics
 After its long-awaiting breakout of the 1900 level the other week, the S&P 500 gained another +1.3% last week alone, but this double-low progression as I call it — i.e., on extremely low volume and with persistently low volatility — is worrisome. With the 2000 level now in sight, there still remains a dearth of bullish conviction, and although the technical picture remains quite extended and overbought, there is no sign yet of bearish action to produce the elusive correction that is now so overdue that bears seem to have almost given up on it — for now. In fact, we are seeing short covering and a falling put/call ratio. Some market commentators are saying that market conditions are reminiscent of the mid-1990s. We haven’t seen a real correction in quite some time. So, is this the proverbial new normal?
History tells us that when everyone is bullish the market is near a top. But with volume low and many still underinvested and waiting for an entry point, all these indications of bullish sentiment don’t necessarily mean that everyone has already put all their money to work. So, the market can and likely will go higher. It just doesn’t normally go up in a straight line as it has done. Some backing and filling is normal and healthy — and preferable.
The CBOE Market Volatility Index (VIX), a.k.a. fear gauge, closed last week at 10.73, which set another new 52-week low. Although some observers are predicting single digits for the VIX, the greater likelihood is a mean reversion sometime soon, which could bring it back up to test the 15 threshold once again.
The 10-year yield remains below 2.60% and may yet fall further. This is at least partly because of ECB monetary stimulus to stave off the threat of disinflation in Europe. Moreover, as I mentioned last week, the flattening yield curve here in the U.S. is also a signal that investors believe the Fed cannot raise rates without tanking the economy. However, others are now opining that the despite the zero-interest rate policy, there is not much lending and borrowing for capital expenditures and growth. Rather, they say that the free money is being used for generating low-risk trading profits or for buying back stock to prop up EPS valuations, creating a troubling asset bubble (including stocks).
SPY chart review:
The SPDR S&P 500 Trust (SPY) closed Friday at 195.38. The bulls have been able to continue an unabated upward march with virtually no resistance from the bears. Small and mid caps have joined the party, as well. The only thing missing is volume to demonstrate conviction. However, all of the overbought technical observations I made last week continue to persist — but now doubly so. Price is so stretched from its moving averages that an attempt at mean reversion is virtually a given this week. Also, oscillators RSI, MACD, and Slow Stochastic are all at extreme overbought levels. Notice how Slow Stochastic has been pinned to the ceiling for the past two weeks. Furthermore, price has officially reached the upper line of the long-standing bullish rising channel, which should provide strong resistance, and the upper Bollinger Band has turned into a virtual straight line as it is being carried further higher each day.
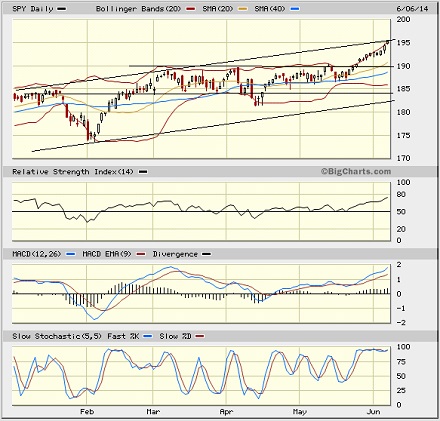
Last week, a pullback seemed highly likely to occur soon, but now it seems inevitable — rather than simply consolidating in place to work off the overbought conditions. First test should be the 20-day simple moving average. Then a test of prior-resistance-turned-support at 190 is a good bet. However, don’t count on a full blown meltdown. Rather, once the technicals cycle back down to oversold conditions, then the bulls will likely reemerge in an attempt to rally again to new highs — perhaps targeting 197 or even 200.
Latest sector rankings:
Relative sector rankings are based on our proprietary SectorCast model, which builds a composite profile of each equity ETF based on bottom-up aggregate scoring of the constituent stocks. The Outlook Score employs a forward-looking, fundamentals-based multifactor algorithm considering forward valuation, historical and projected earnings growth, the dynamics of Wall Street analysts’ consensus earnings estimates and recent revisions (up or down), quality and sustainability of reported earnings (forensic accounting), and various return ratios. It helps us predict relative performance over the next 1-3 months.
In addition, SectorCast computes a Bull Score and Bear Score for each ETF based on recent price behavior of the constituent stocks on particularly strong and weak market days. High Bull score indicates that stocks within the ETF recently have tended toward relative outperformance when the market is strong, while a high Bear score indicates that stocks within the ETF have tended to hold up relatively well (i.e., safe havens) when the market is weak.
Outlook score is forward-looking while Bull and Bear are backward-looking. As a group, these three scores can be helpful for positioning a portfolio for a given set of anticipated market conditions. Of course, each ETF holds a unique portfolio of stocks and position weights, so the sectors represented will score differently depending upon which set of ETFs is used. We use the iShares that represent the ten major U.S. business sectors: Financial (IYF), Technology (IYW), Industrial (IYJ), Healthcare (IYH), Consumer Goods (IYK), Consumer Services (IYC), Energy (IYE), Basic Materials (IYM), Telecommunications (IYZ), and Utilities (IDU). Whereas the Select Sector SPDRs only contain stocks from the S&P 500, I prefer the iShares for their larger universe and broader diversity. Fidelity also offers a group of sector ETFs with an even larger number of constituents in each.
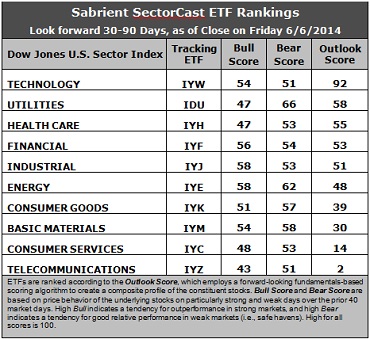
Here are some of my observations on this week’s scores:
1. Technology remains in first place with a strong Outlook score of 92, which is quite impressive especially given its gigantic 34-point gap above second place Utilities at 58. Technology displays generally solid factor scores across the board, with a strong forward long-term growth rate, a reasonable forward P/E, the highest return ratios, and the strongest sentiment among both Wall Street analysts (upward revisions to earnings estimates) and insiders (open market buying). Utilities is the only other sector showing improving sell-side analyst sentiment. It also displays a reasonably low forward P/E and some insider buying activity. Healthcare has suddenly vaulted into third place over Utilities, and Industrial rounds out the top five. Notably, Energy fell 16 points and out of the top five this week.
2. Telecommunications stays in the cellar once again with an Outlook score of 2, as it scores among the lowest in every factor in the model. It is joined in the bottom two this week by Consumer Services/Discretionary with a score of 14, despite its leading forward long-term growth rate.
3. Looking at the Bull scores, Energy and Industrial hold the lead with a 58, while Telecom is the laggard with a 43. The top-bottom spread is 15 points, reflecting modest sector correlations on particularly strong market days. It is generally desirable in a healthy market to see a top-bottom spread of at least 20 points, which indicates that investors have clear preferences in the stocks they want to hold, rather than the all-boats-lifted-in-a-rising-tide mentality that dominated 2013.
4. Looking at the Bear scores, Utilities is still the leader, even after dropping from 78 last week to 66 this week, which means that stocks within this defensive sector have been the preferred safe havens on weak market days. Energy is second at 62. Interestingly, Technology and Telecom share the lowest at 51, as all sectors score above 50 this week. The top-bottom spread remains has suddenly dropped to 15 points, reflecting higher sector correlations on particularly weak market days than we have seen recently. Again, it is generally desirable in a healthy market to see a top-bottom spread of at least 20 points.
5. Technology displays by far the best all-weather combination of Outlook/Bull/Bear scores, followed by Utilities. Telecom is by far the worst, followed by Consumer Services. Looking at just the Bull/Bear combination, Energy is the clear leader, indicating superior relative performance (on average) in extreme market conditions (whether bullish or bearish). Telecom scores the lowest, indicating general investor avoidance of these sectors during extreme conditions.
6. Overall, I would say that this week’s fundamentals-based Outlook rankings have taken a decidedly defensive turn given the rise in Utilities and Healthcare, at the expense of Energy and Financial. This seems to support my short-term technical view of market conditions.
These Outlook scores represent the view that Technology and Utilities sectors are relatively undervalued, while Consumer Services and Telecom may be relatively overvalued based on our 1-3 month forward look.
Stock and ETF Ideas:
Our Sector Rotation model, which appropriately weights Outlook, Bull, and Bear scores in accordance with the overall market’s prevailing trend (bullish, neutral, or bearish), suggests holding Technology, Energy, and Industrial in the prevailing bullish climate. (In this particular model, we consider the bias to be bullish from a rules-based standpoint because SPY is still above its 50-day simple moving average while also remaining above its 200-day SMA.)
Other ETFs that are ranked high by our algorithm from the Technology, Energy, and Industrial sectors include First Trust NASDAQ Technology Dividend Index Fund (TDIV), PowerShares Dynamic Energy Exploration & Production Portfolio (PXE), and SPDR S&P Transportation ETF Trust (XTN).
For an enhanced sector portfolio that enlists top-ranked stocks (instead of ETFs) from within Technology, Energy, and Industrial, some long ideas include Apple (AAPL), Western Digital (WDC), Marathon Petroleum (MPC), EOG Resources (EOG), General Dynamics (GD), and Allegiant Travel (ALGT). All are ranked highly in the Sabrient Ratings Algorithm and also score within the top two quintiles of our Earnings Quality Rank (EQR), a pure accounting-based risk assessment signal based on the forensic accounting expertise of our subsidiary Gradient Analytics. We have found it quite valuable for helping to avoid performance-offsetting meltdowns in our model portfolios.
However, if you are more comfortable with a neutral bias, the model suggests holding Technology, Utilities, and Healthcare. On the other hand, if you have a bearish outlook on the market, the model suggests holding Utilities, Energy, and Technology.
Disclosure: Author has no positions in stocks or ETFs mentioned.
Disclaimer: This newsletter is published solely for informational purposes and is not to be construed as advice or a recommendation to specific individuals. Individuals should take into account their personal financial circumstances in acting on any rankings or stock selections provided by Sabrient. Sabrient makes no representations that the techniques used in its rankings or selections will result in or guarantee profits in trading. Trading involves risk, including possible loss of principal and other losses, and past performance is no indication of future results.