

 Some of the people all of the time.
That's the basis for this rally – or what's left of it – as we see this pattern almost daily: A big(comparatively) volume sell-off followed by a "rally" on 1/3 to 1/4 of the volume that sold and then, once we hit a pre-programmed peak (about where we got to in the no-volume Futures), we have a bit of volume selling into the close.
This is how you can see those charts that show all the "smart money" running out of the market, even as the market goes higher. Why would they leave? Why would anyone leave this exciting market? The answer is, because those fund managers are well aware that, at some point, the music will stop and there will be no buyers to save them then. Best to get out now and avoid the rush.
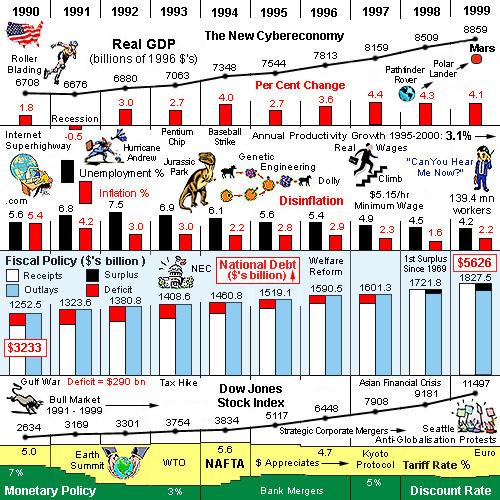
That time was also "different," wasn't it? We had invented the Internet (well, Al Gore did) and easy monetary policy led to bank mergers and NAFTA ushered in an era of free trade that send tens of millions of jobs overseas, causing profits for US Corporations to soar and those good times were never going to end – until they did.
 It's very hard to say when a rally like this will finally run out of gas but, when we stop making new highs and we have these BS daily, manipulative run-ups to cover the selling – that's probably a good time to get more cautious.
As noted on Dave Fry's S&P chart, it's ALL about the Fed and how much FREE MONEY the Fed will pump in and how long they will keep pumping it in, etc. You would think we'd be tired of the same old song and dance but why should we, when we GET PAID to join in?
Yesterday, for example, in our Live Member Chat Room, I called for a bottom on the Russell Futures (/TF), saying:
/TF below 1,130! One would hope that's it. Playable for a bounce over that line but super-tight stops and you can easily get burned for a very quick $500, so be careful. Logically, as they are already down 1%, it SHOULD be less likely that they power-move lower and the bounce of 2-4 points (strong/weak) is more likely off the 1%, 10-point drop.
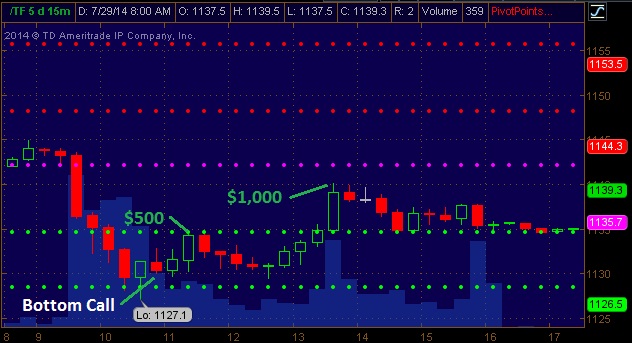 The 1,130 line gave us a very quick $500 per contract gain just 30 minutes later and then a pullback and then another $1,000 per contract gain that I called a top to at 1:50, when I said to our Members:
There's 1,140 on the RUT for $1,000 – remember, greed kills!
Oil tapped $102 and NOW it's looking like a fun short (/CL) with tight stops over that line.
 That led to yet another $500 per contract win into the close, as oil fell back to $101.50 and, this morning, we're testing $101 again but our prediction is failure and a re-test of $100.70, on the way to $100 – as prediced by our 5% Rule yesterday at 10:03 am. Knowing what's going to happen in advance is tremendously useful (and profitable) in Futures trading!
 ![]()
We have a LIVE Futures Trading Webinar Today at 1pm (EST) and you can join us for FREE by following this link.
The same predictive skills we use in the Futures are the ones we use when we're warning you how dangerous and unstable the markets are at the moment but, in the Futures, we're looking at a 5-minute chart and, if we're off by a couple of ticks, it's just a 10-minute wait. In our Macro View, we're looking back 20 years and a couple of ticks on the quarterly charts can be 6 months of waiting or more.
 Still, my biggest mistake in 2008 was getting bored with warning people that something was very wrong in the Global Markets. By the time the markets actually fell, a lot of people had become way too complacent and simply were not in a good position to defend themselves as the market started falling hard and fast.
So, this time around I'm trying not to overdo it – but I am making it a point to constantly remind you that your money is very much at risk amidst this "rally" and that keeping plenty of cash on the sidelines and having good hedges is much more important than trying to squeeze every penny out of the bull side.
 Clearly this time IS different. Investor Place put up this chart in April and, since then, the S&P has gained another 100 points (5%) putting us 17% over the 17-month moving average – DOUBLE the peaks before the last two major crashes.
It's funny because TSLA made a move like that yesterday and we immediately shorted the pop in our Live Member Chat Room, simply because a move like that was clearly unsustainable – even if there was some legitimate good news to back it up. Why is it that something can be so clearly unsustainable over the short term yet, when looking at a long-term chart that is equally unsustainable – people refuse to believe it?
Well, you'd better believe it – that's all I'm going to say on the subject…