

Courtesy of Mish.
Initial Reaction
Once again we see the pattern of a strong establishment survey but a poor household survey. The latter varies more widely, and the tendency is for one to catch up to the other, over time. The question, as always, is which way?
Here is one stat that really stands out: The unemployment rate for teenagers 16-19 fell 1.7 percentage points. BLS Jobs Statistics at a Glance
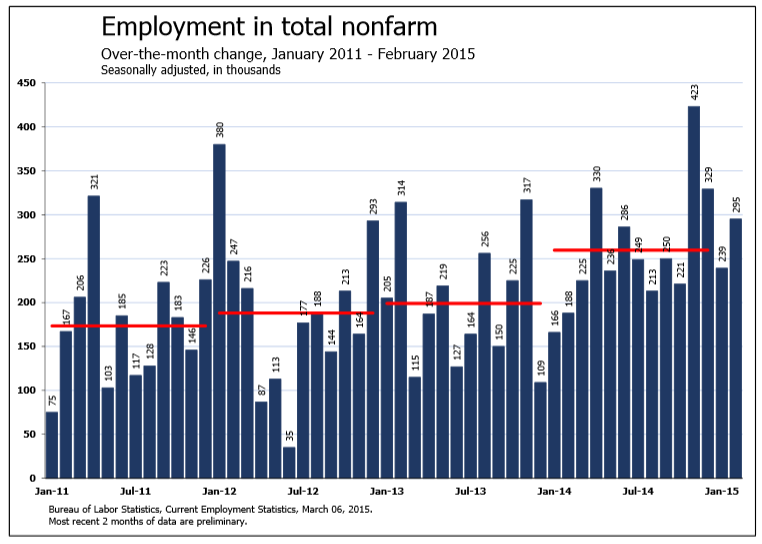
- Nonfarm Payroll: +295,000 – Establishment Survey
- Employment: +96,000 – Household Survey
- Unemployment: -274,000 – Household Survey
- Involuntary Part-Time Work: -175,000 – Household Survey
- Voluntary Part-Time Work: +15,000 – Household Survey
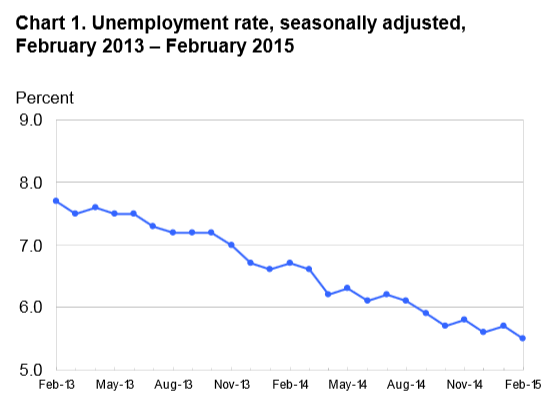
- Baseline Unemployment Rate: -0.2 at 5.5% – Household Survey
- U-6 unemployment: -0.3 to 11.0% – Household Survey
- Civilian Non-institutional Population: +176,000
- Civilian Labor Force: -178,000 – Household Survey
- Not in Labor Force: +354,000 – Household Survey
- Participation Rate: -0.1 at 62.8 – Household Survey
January 2015 Employment Report
Please consider the Bureau of Labor Statistics (BLS) November 2014 Employment Report.
Total nonfarm payroll employment increased by 295,000 in February, and the unemployment rate edged down to 5.5 percent, the U.S. Bureau of Labor Statistics reported today. Job gains occurred in food services and drinking places, professional and business services, construction, health care, and in transportation and warehousing. Employment in mining was down over the month.
Click on Any Chart in this Report to See a Sharper Image
Unemployment Rate – Seasonally Adjusted
Nonfarm Employment January 2011 – February 2015
 …
…