

Courtesy of David Stockman at Contra Corner
When the bubble vision stock peddlers get desperate, they talk decoupling. So by the end of yesterday’s bloodbath you would have thought China was on another planet, and that “commodities” were some trinket-like collectibles gathered by people who don’t wear long pants, drink coca cola or jabber on their cell phones.
On these fine shores, of course, its all awesome from sea to shinning sea. So don’t be troubled. Buy the dip.
Never mind that we are in month 74 of this so-called recovery and that after year upon year of promised “escape velocity” the reliable signs of said event are still few and far between. But the “recovery” narrative stays alive because there is always some stray factoids of seasonally maladjusted, yet-to-be-revised “incoming data” that can excite the MSM headline writers and bubble vision talking heads.
Today the data on construction spending and housing took their turn in the awesome circle. Thank heavens that the headline writing software used by the financial press doesn’t yet read graphical data. Otherwise they might have reported that private residential construction soared in July—–well, all the way back to January 2002 levels!
And those are the nominal dollars that the Fed has done its level best to depreciate in the 13 years since then. In fact, on an inflation-adjusted basis the housing construction spend is still at 1992 levels.
![]()
What had the headline software giddy, of course, was the year over year comps, which were in double digits. Yet did the talking heads bother to note the deep hook in last summer’s data?
No they didn’t. Otherwise they might have seen that the two-year stack in July came in at a hardly fulsome 3.7% annual rate and that nominal private housing spending is still 7% below December 2007 and 43% below the early 2006 peak.
More importantly, they might have noticed that this is no longer your grandfather’s housing market. The US housing stock got way over-built during the Greenspan bubble and the incoming generation of home-buyers has gotten buried in $1.2 trillion of student debt.
So notwithstanding the mini-boom in multi-family apartment construction, the $380 billion annual rate of spending in July amounted to only 2.1% of GDP. That’s the same rock bottom ratio registered in July 2013, and is clear evidence that the housing needle has not really moved at all.
Indeed back in January 2002 when the $380 billion annualized mark was first crossed, housing construction accounted for 3.7% of GDP, and during much of the prior two decades it had posted at 4-5% of GDP.
In short, housing has been sent back to the minor leagues as a GDP contributor and, even then, may be soon running out of gas. The apartment construction boom was partially driven by tax credits, which have expired. And despite the periodic bursts of hopium from Wall Street analysts, there is no sign that the kids are moving out of mom and pops basement or that single family starts are breaking out of the sub-basement of history.
![]()
In fact, the phony booms of bubble finance cast a long shadow of recoupment on future history. In the case of commercial construction of malls, shops, hotels and office buildings that retraction is especially evident. The modest recovery from the thundering plunge after the financial crisis has already lost its steam—–with the July spending level for this sector essentially flat versus prior year.
More to the point, however, commercial construction spending last month posted at a level first crossed in February 1999. Given that the most inflation indices have risen by about 40% during the interim, the shrinkage in real terms has been tremendous.
Yet with vacancy rates still at quasi-recession levels and malls being devastated by Amazon and e-commerce, the likelihood that the recent downward hook in commercial construction will rebound any time soon is somewhere between slim and none.
![]()
When the totality of private nonresidential construction is considered the pattern becomes dispositive. Yes, the year-over-year number looks healthy at first glance, but it was flattered by last year’s dip and has gone nowhere on a net basis since the pre-crisis peak.
In fact, the real story is dramatically evident in the graph below. During the 1990s recovery cycle, nominal private nonresidential construction spending surged by 75%. Then in the Greenspan housing boom cycle the gain decelerated to 43%. Alas, during the last eight years the gain has been exactly 0%.
Even then most of the rebound from the 2009 bottom has been accounted for by energy, materials processing industries and manufacturing——-all of which are now facing the severe headwinds of global deflation.
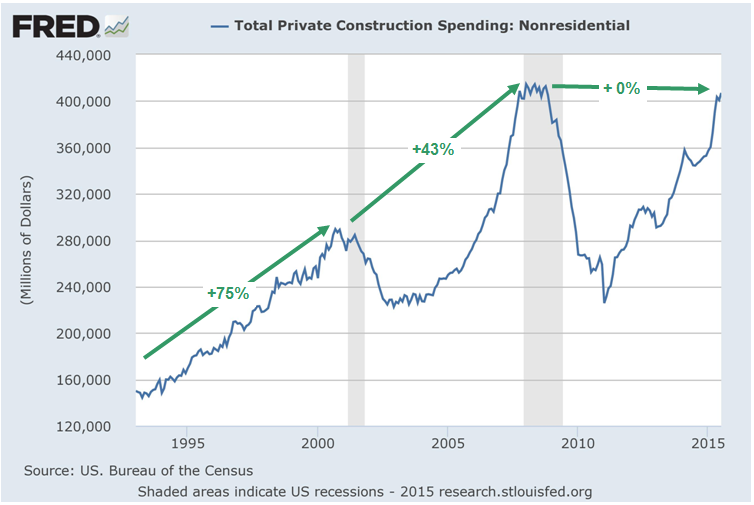
Construction Spending
The talking heads also claim that jobs are springing back and this trend is certain to fuel a resurgence of consumer spending. Once again the apparent connotation is that the US economy is decoupled because the ever reliable consumers of America will shop their way through whatever disturbances may be emanating from foreign shores.
Needless to say, that’s the same old Jobs Friday razzmatazz based on a census count that is inflated by part-time job slots in restaurants, bars and beach resorts and other new style work gigs, not full-time employment at a living wage.
But the relevant measure is hours worked and compensation paid for those hours. In neither case is there any reason to believe that escape velocity is anywhere on the horizon.
The index of hours worked in the nonfarm business sector posted at 110.6 during Q2 2015——a level that was virtually identical to that of Q2 2007. An economy that has spent eight years going nowhere on a net basis is just plain unlikely to get up and start sprinting at any time soon.
![]()
The same story is told by the numbers for wage and salary compensation. Since the pre-crisis peak in July 2008, wage and salary compensation has grown at a 2.5% rate. That represents a sharp deceleration from the 4.3% rate of the prior seven year expansion.
Even when adjusted for inflation, it is starkly evident that US wage and salary workers are not earning themselves into anything that resembles a consumption spending boom. In fact, aggregate real wages and salaries have grown at just 0.5% per year since the crisis, or at barely one-third the real rate of the previous business expansion, and there has been no sign of significant acceleration as the current recovery cycle has aged.

US Wages and Salaries data by YCharts
What has happened, however, is that the household savings rate has been drawn back down to historically rock bottom levels, meaning that consumption spending has nowhere to go except down if the current modest rate of wage and salary growth should falter.
![]()
But that’s exactly the risk at hand. The export sector of the US economy is already faltering; the boom in the domestic oil and gas industry is going stone cold; capital spending has no reason to accelerate; and business inventories have reached dangerously high levels.
In this regard the bubble vision mantra is that the American economy mostly consists of homespun goods and imports. At just 12% of GDP exports are not such a big deal, and pale compared to say Korea at 50% or China at 25%.
But that bland assurance fails to embrace the cardinal principle that things economic happen on the margin, not the average. And on the margin, world trade has already rolled-over into negative territory.
At the same time, the central thrust of the US mini-export boom after the recession was in energy products and processed materials, which have run smack into the tide of global deflation. Accordingly, shipments are already down 18% in nominal terms from Q3 2014; have already broken below their 2008 peak; and are now heading much lower.
![]()
As it happens, there is nothing in the US export slate to counteract this faltering trend. On an overall basis, US exports have already roll-over and now stand just 10% above their pre-recession peak. Going forward they will be a drag on economic growth, not a stimulant.
![]()
As to capital spending, the chart below shows why Steve Liesman spots a hopeful uptick in orders for nondefense capital goods ex-aircraft only every other month. That because CapEx order have been going nowhere since early 2012, and are still barely above their pre-recession peak in nominal terms.
![]()
Finally, total business sales in the US economy have slowed sharply and in the most recent month and reflected only a 1% annualized rate of gain during the last two years. Indeed, the CAGR since the pre-recession peak has been just 1% in nominal terms—-a rounding error compared to the 6% gain during the previous cycle and 7% during the 1990s expansion.
![]()
At the same time, inventories have continued to building, surging to record levels in Q2. As a result, the inventory sales ratio has climbed back to its October 2008 level. One of these months inventory liquidation will begin in earnest, thereby pulling the last prop out from under the weakest business cycle expansion in post-war history.
![]()
Indeed, the risk is far greater than suggested by the cold historical numbers in the chart above. As we have repeatedly observed, the C-suite in corporate America today is essentially a stock trading room.
Options obsessed executives are in thrall to the stock averages and their decisions on operational matters such as hiring and inventory management are heavily colored by the state of play in the Wall Street casino. Accordingly, as the Fed has driven the financial bubble to higher and higher extremes, the C-suite has been steadily hoarding more labor and inventory—just as they did in the run-up to the financial crisis in 2008.
Then the Wall Street bubble collapsed, and inventory and labor were liquidated with a vengeance in the fall and winter of 2008-2009.
It will happen again and much sooner than bubble vision’s happy decouplers imagine.
There’s an obvious problem with that prospect, however. The perma-bulls insist that we are just re-testing the week ago lows at 1867 on the S&P 500. Soon the bull will be back on its feet and stampeding higher because there is never a bear market without a US recession and none is anywhere in sight.
But then on Wall Street there never is——including ten out of the last ten recessions.