

Courtesy of David Stockman of Contra Corner
.jpg) The talking heads were busy this week powdering the GDP pig. By averaging up the “disappointing” 1.5% gain for Q3 with the previous quarter they were able to pronounce that the economy is moving forward at an “encouraging” 2% clip.
The talking heads were busy this week powdering the GDP pig. By averaging up the “disappointing” 1.5% gain for Q3 with the previous quarter they were able to pronounce that the economy is moving forward at an “encouraging” 2% clip.
And once we get through this quarter’s big negative inventory adjustment, they insisted, we will be off to the ‘escape velocity’ races. Again.
No we won’t!
The global economy is in an epochal deflationary swoon and the US economy has already hit stall speed. It is only a matter of months before this long-in-the-tooth 75-month old business expansion will rollover into outright liquidation of excess inventories and hoarded labor.
That is otherwise known as a recession. Its arrival will be a thundering repudiation of the lunatic monetary policies of the last seven years; and it will send into panicked shock all those buy-the-dip speculators and robo-traders who still presume the central bank is omnipotent.
So forget all the averaging and seasonally maladjusted noise in yesterday’s report and peak inside at the warning signs. To begin, the year/year gain of just 2.0% was the weakest result since the first quarter of 2014. And that’s only if you believe that inflation during the last 12 months was just 0.9%, as per the GDP deflator used by the Commerce Department statistical mills.
Needless to say, there are about 90 million households in America below the top 20%, which more or less live paycheck to paycheck, that would argue quite vehemently that their cost of living—– including medical care, housing, education, groceries, utilities and much else——-has gone up a lot more than 0.9%.
So put a reasonable “deflator” on the reported “real” GDP number, and you are getting pretty close to stall speed—–even before you look inside at the internals. Indeed, even before you get to the components of the “deflated” GDP figure, you need to examine an even more important number contained in yesterday’s report that was not mentioned by a single talking head.
To wit, the year/year gain in nominal GDP was only 2.9%, and it represented a continuing deceleration from 3.7% in the year ending in Q2 2015 and 3.9% in the years ending in Q1 2015 and Q4 2014, respectively. In short, the US economy is sitting there with $59 trillion of credit market debt outstanding, but owing to the tides of worldwide deflation now washing up on these shores, nominal GDP growth is sinking toward the flat line.
That’s critically important because this has never happened since the 1930s. Moreover, our modern debt-besotted economy rests on the assumption that nominal GDP growth will be always sufficient to keep incomes—-both private and government—–growing faster than the carry cost of the debt.
The spurious ten-year forecasts for the Federal budget, for instance, assume nominal GDP growth of 5.2% per year——and that’s the essential driver of long-run government revenue projections. Even then, CBO projects that after purportedly hitting “full-employment” around 2018 the Federal deficit will once again start rising, hitting $1.1 trillion per year early in the next decade.
Well, look out below! If the nominal GDP growth continues to sink toward the flat-line, as it has clearly been doing for quite some time now, Federal tax collections will come in far below current projections, thereby causing the deficits and the national debt to soar.
And that risk is not appreciably different when it comes to the private household and business sectors, either. Each have credit market debt outstanding of about $13 trillion, yet the blue sky forecasts of Wall Street and the Keynesian professors at the Fed assume that nominal GDP will soon grow out from under these staggering financial burdens.
Not in this lifetime. Indeed, the underlying downshift in the nominal GDP growth trend is stark and indisputable, but entirely lost on the talking heads who specialize in gumming about essentially meaningless quarter-over-quarter deltas in the data.
Wall Street economists and financial media fellow travelers like CNBC’s Steve Liesman specialize in what amounts to looking for bubble gum on the floor of a chicken coop. The white wads get somewhat indistinguishable down there.
Stated differently, if the talking heads can find a few good deltas, it is purported evidence that all is well; that the Fed has the economy on track; and that the stock market should make another new high.
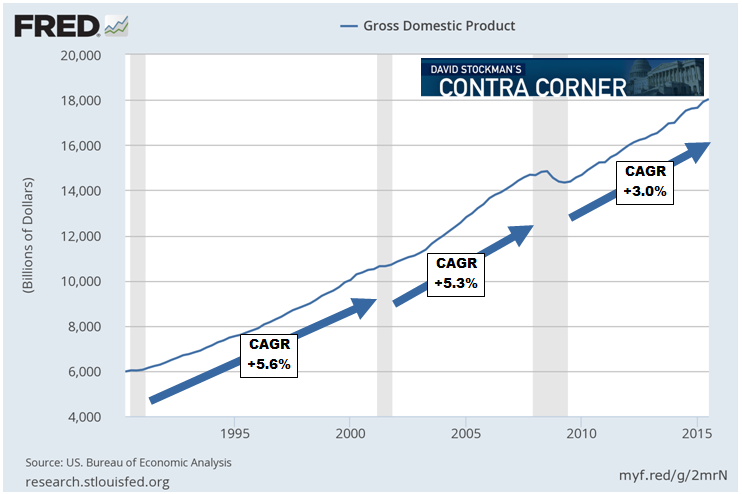
By contrast, the graph below shows nominal GDP for the last three business cycles. During the 1990s recovery it expanded at a 5.6% annual rate, and during the Greenspan housing/credit boom after 2001 it grew at 5.3%.
But now we are 94 months from the pre-crisis peak and the growth rate of nominal GDP has plunged to 3.0%. What’s more, that drastically lower trend rate includes the impact of the deep recession of 2008-2009. If we look at the trend since June 2009 the picture is just the opposite of the Wall Street “escape velocity” mantra.
To wit, during the first three years after the recession bottom, nominal GDP grew at a 4.0% rate. While that’s still well bellow the historic trend, the more important point is that nominal GDP growth has been steadily decelerating since Q2 2012, not picking up speed as endlessly claimed by the Kool-Aid drinkers.
Therefore, when it comes to the single most important macro variable in a debt-driven economy—–that is, nominal GDP—–you can forget about the winter snow excuse or the inventory adjustment rationalization that have been offered to explain disappointing results in recent quarters.
The fact is, this quarter’s tepid 2.9% GDP growth over prior year is unequivocal proof that the US economy is stalling——-and notwithstanding the massive monetary “stimulus” that has been thrown at it by the Fed.
When you look inside this deflating GDP envelope, the warning signs become even more striking. Thus, it has always been the case that business plant and equipment spending accelerates as a business recovery ages and picks up steam, reflecting the need for expanded capacity.
Yet Q3 2015 outlays of $1.579 trillion were just $9 billion higher than during Q3 last year. That’s a rounding error gain of just 0.6%, but worse than that, it’s a sign that real main street businesses see no evidence of impending escape velocity whatsoever.
In fact, orders for core CapEx (non-defense less aircraft) were down 7.3% over prior year in September, indicating that shipments will likely soon turn negative as well.
Another sector hitting the skids is US exports, which are being taken down by global deflation. During Q3 exports of goods totaled $1.514 trillion at an annual rate, but you didn’t see any boasting, or even mention, of that 9% slice of the GDP in the Fed’s post-meeting statement this week.
That’s because last year in Q3 the number was $1.642 trillion. So exports have already plunged by $128 billion or 7.8%, and the slide is just getting started. As shown below, the post-recession surge of exports, which led the Obama Administration to proclaim they would double by 2016, is over and done.
This surge was an artifice of the global commodities boom driven by China’s infrastructure building spree, not some fundamental improvement in the competitive advantage of US manufacturing. Now that the Red Ponzi is rolling over—-so are US exports, which have actually dropped by more than 10% since last October’s peak.
But as they say on late night TV, there’s more. In addition to $1.5 trillion of goods, the US also exports about $750 billion per year of services—–the most important component of which is foreign tourists coming to Disneyland, Broadway,Yellowstone Park etc..
Can you say strong dollar? That is, export of services had been on a tear, rising by $200 billion or at a 7.0% annual rate between the end of the recession and Q3 2014. But during the last year that slowed down to 4.5% and during Q3 to a 3.9% annual rate.
Not surprisingly, with the dollar up by 20% since January 2014, travel and tourism exports have been heading south, and are now down by 5.5%. Yet global deflation inherently means a strong dollar as other central banks—-notably the ECB and BOJ—– race to the bottom in a desperate effort to prop-up their faltering economies. Accordingly, service exports are likely to join the negative trend in goods exports during the periods just ahead.
In a debt-saturated deflationary world even the old Keynesian standby of Federal spending on goods and services—which totals about $1.2 trillion annually— has not been doing much for GDP growth in recent quarters, and is virtually certain to weaken further owing to Washington’s fiscal policy paralysis.
Thus, in the first two years after the recession bottom and owing to the Obama fiscal stimulus and defense build-up, the Federal consumption and investment component of GDP rose by $100 billion or 7.5%, including a 8.5% gain in defense spending.
But Q3 2011 was the high water mark. Owing to a steady erosion of defense spending, the Federal contribution to nominal GDP has dropped by $82 billion or 6.2% since then, and continued to decline in the most recent year and quarter. In fact, nominal Federal consumption and investment spending of $1,224 billion during Q3 was nearly back to its Q2 2009 of $1, 215 billion.
That’s all to the good from a fiscal sanity viewpoint, but it also means that another prop under the initial post recession recovery bounce has been removed.
Finally, we have the crucial matter of economy-wide business sales and inventory. The short answer is that sales are clearly rolling over, and the inventory correction claimed by the talking heads to explain away Q3 is not nearly over; its just barely started.
As shown in the chart below, total business sales have declined by $42 billion or 3.1% during the last 12 months, while inventories—-manufacturing, wholesale and retail—–have increased by $40 billion. Needless to say, it doesn’t take much familiarity with the business cycle to know what that means. Namely, inventory liquidation time just ahead.
In fact, the claim that the inventory liquidation is all done with the Q3 results is completely wrong, and reflects a quirk in GDP accounting that the quarterly delta hunters always miss. To wit, the inventory gain in Q3 was less than the gain in Q2—-so it shows up as a decrement to the quarterly rate of GDP growth!
But take a look at the correct metric—the inventory to sales ratio—-and you get an altogether different reading. We are now at October 2008 highs, and its only a matter of time before nominal inventories begin to shrink.
When inventory liquidation commences, however, it rapidly propagates up and down the supply chain, meaning hoarded labor will be quickly off-loaded by corporate C-suites desperate to keep their stock options above water.
Once again, however, the fact that new jobs recorded in the BLS cycle-adjusted and manipulated establishment survey are a lagging indicator will come as a complete shock to Wall Street. So will the fact that actual inventory liquidation, not the second order change in the GDP accounts, will take a huge chunk out of current production and wage and salary income.
To be sure, the Wall Street stock peddlers will resort to the shop-until-they-drop American consumer card when all else fails. But the 3.5% gain in nominal PCE (personal consumption expenditures) during Q3 compared to prior year is nothing to write home about. That’s especially the case because nearly one-third of that $415 billion gain was accounted for by health care and auto sales.
It seems reasonably evident that car sales have already peaked owing to the exhaustion of subprime customers and that peak Obamacare is not far behind. In any event today’s release of personal income and spending for September left little to the imagination. Wage and salary income actually dropped in September and has been visibly weakening for the past year.

In a world in which consumers are already at peak debt and late cycle reversion to inventory and jobs liquidation lies just around the corner, it is not evident where US households will get the wherewithal to even maintain this quarter’s 3.5% gain in PCE.
In short, while the Steve Liesman’s of the world keep finding bubble gum on the floor of the quarterly chicken coop, its not at all what its cracked up to be. There is absolutely nothing “decoupled” about the US economy and no way the Fed can prevent the domestic economy from sliding into the global slump.
After all, the Fed is pushing on a string when comes to the main street economy, and inflating the mother of all bubbles when it comes to the Wall Street casino.
Twice already this century it has been demonstrated that this combination eventually results in tears. Why should this time be any different?