

A History of Bear Market Bottoms
Courtesy of Michael Batnick
The Dow just had its best day since March 2009, having many of us wondering, was this the bottom? Is the bear market over?

Before we move on and before I get actually’d, the Dow technically never entered a “bear market”. It only fell 19.4% peak-to-trough. We all know how silly these arbitrary definitions are but the line has to be drawn somewhere, even if it is rather meaningless.
There were a lot of “markets don’t bottom like this” out there today, and that’s partially true, often times bear markets don’t end with a “everybody back into the pool” type moment. But as I’m about to show you, sometimes they do (spoiler, 1970, 1987, 1997, 1998, 2009).
What we can say with more confidence is that these buying panics tend not to happen in bull markets. Of the 35 +4% days going back to 1970, 31 of them happened when the Dow was below its 200-day moving average.
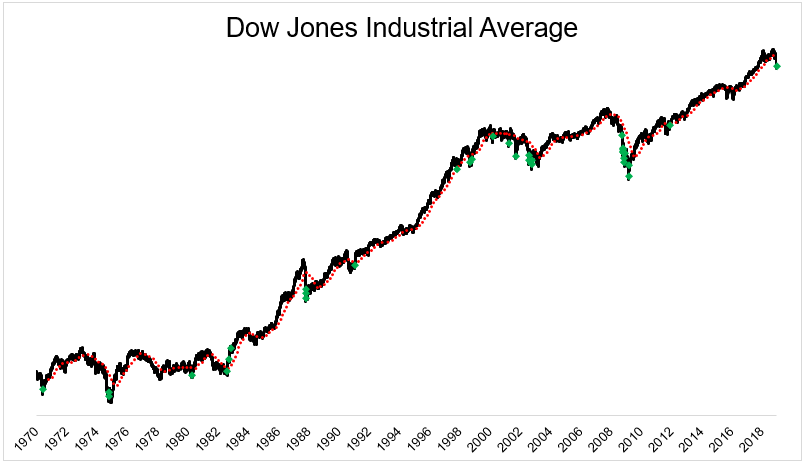
If human behavior never changes, we should expect to find some sort of pattern in past bear market bottoms. Let’s turn to the charts and see if we can come to any conclusions.
On May 27, 1970, the Dow was in in a bear market. On that Day stocks opened flat and roared higher, gaining as much as 5.4% before selling off and finishing the day up just 1.8%. It no doubt felt as though the bears were in control. But that was the bottom. The next day the market gained 6.4% and it was off to the races. The Nifty Fifty Era was about to hit its stride.

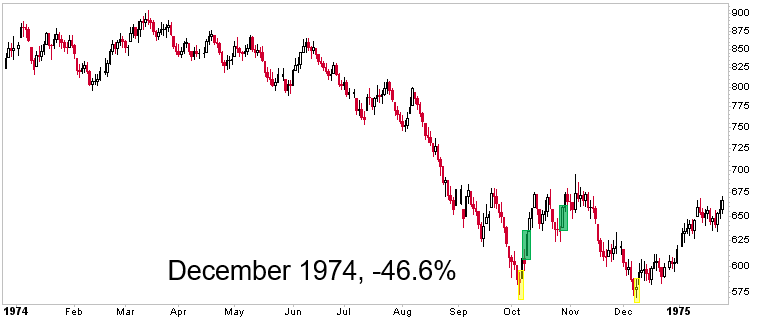
The bottom in December 1974 came as many do, with a “doji”(yellow), meaning, stocks went up a lot (1%) and fell a lot (-2.4%) and closed the day near where they opened (-0.5%). This type of candle has the potential to mark a turning point, though it is often a false positive. In this case, it did mark a short-term bottom. Stocks gained 4% twice (green) over the next few sessions, before retesting those lows a few weeks later with another doji. This was what some call “a double bottom,” which I suspect traders will be looking for over the next few days or weeks.
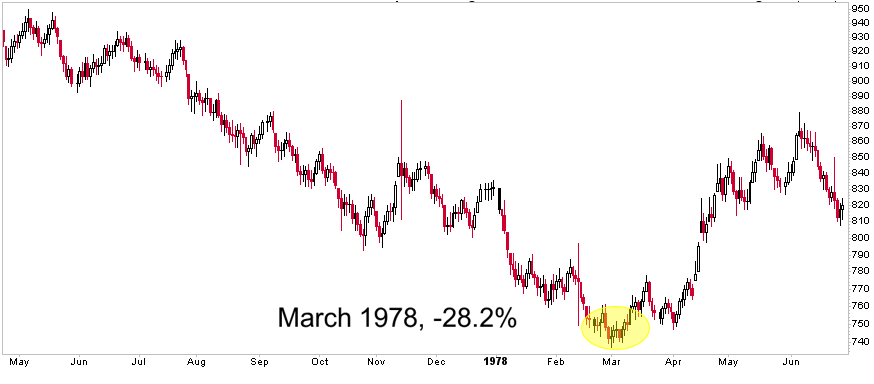
March 1978 had to be one of the most uneventful bottoms ever. In the two weeks surrounding it there was one 1% decline and one 1% gain. On the day it bottomed, the Dow gained less than 2 points, or 0.16%. So much for bottoms being an “event”.
On March 27, 1980, the Dow had declined 20.5% (peak-to-trough) in just 31 sessions. On that day (in yellow), the Dow was down as much as 4.2% before rallying off the lows and closing down just 0.28%. It had back-to-back 1% gains and had two false starts over the next couple of weeks. Then On April 22 (in green) the Dow gained 4% and would add on another 30% over the next year.

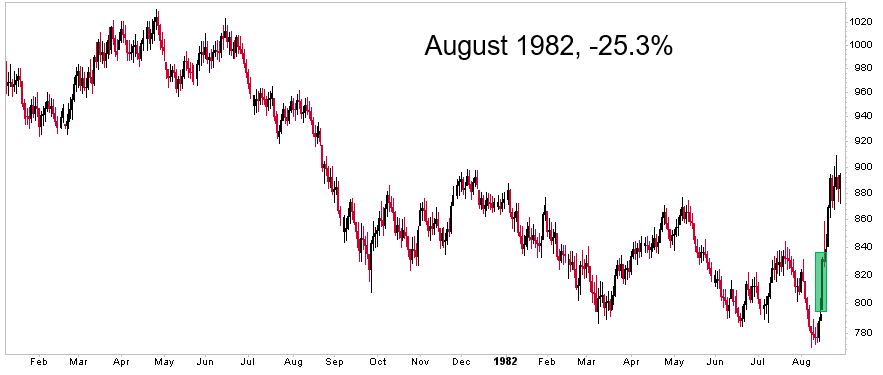
There was no panic selling to end one of the worst bear markets ever; not a single -2% day in the days leading up to the August 1982 bottom. What there was however, was a buying panic of 4.9%, which would spark one of the greatest bull markets in history.
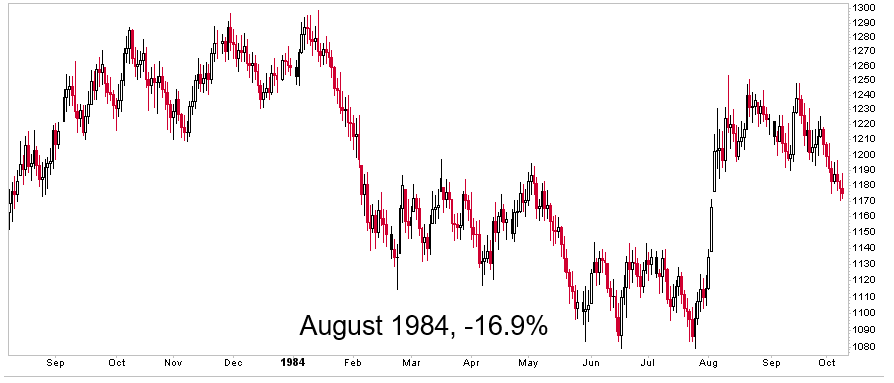
The 1984 not-quite-a-bear-market-bottom was very reminiscent of 1984. Stocks sold off, gained, sold off, gained, sold off again, and gained again. Textbook, really.
This next one needs no introduction. The crazy selling was met with crazy buying, three 5% gains in just 8 sessions (one was 4.96%, sue me).

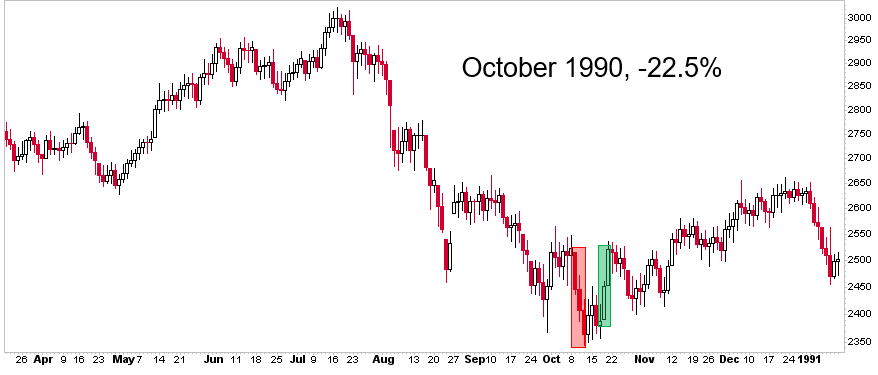
1990 was how I think many people picture a bottom. There were three consecutive days of 1% daily declines, and a few days later there was back-to-back gains of 2%. A bear trap if there ever was one.
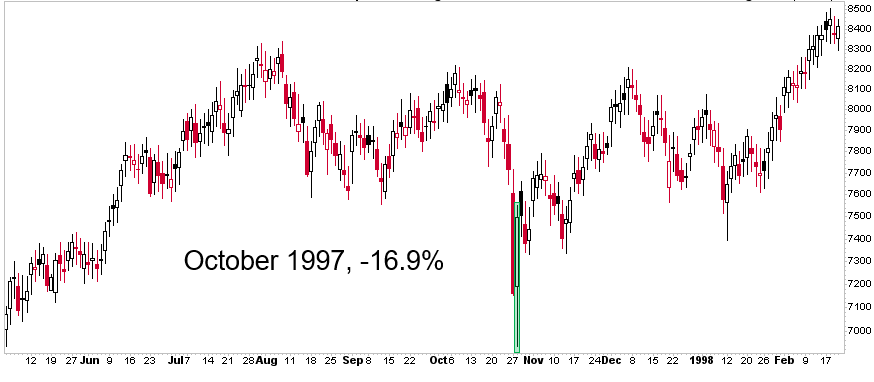
“Markets don’t bottom like this.” Tell that to October 1997, when the Dow gained 4.7%.
Or to October 1998, when the Dow gained 3.8% on the day of the bottom and 5% a few days later. Over the next few weeks it gave back most, but not all of the gains in what was no doubt a terrifying month for investors.

Here is where the “bottoms” start to get real dicey. The dot-com bubble was brutal. Just brutal.
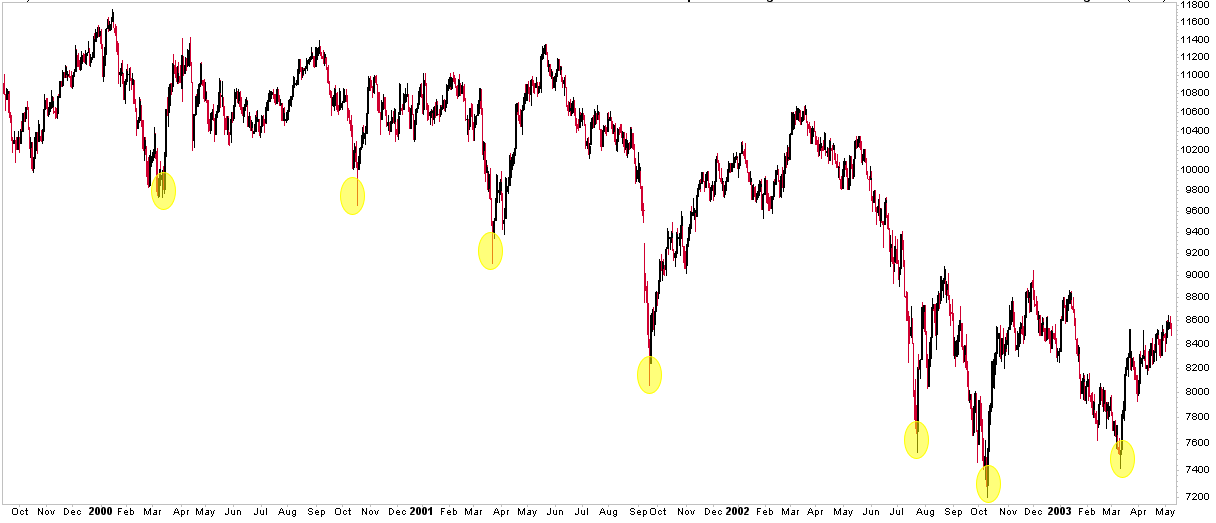
The Dow only fell 6% in 2000 because it didn’t have that much tech exposure. It also only declined 6% because it rallied into the end of the year. A -6% year does not tell the story. Not even close.
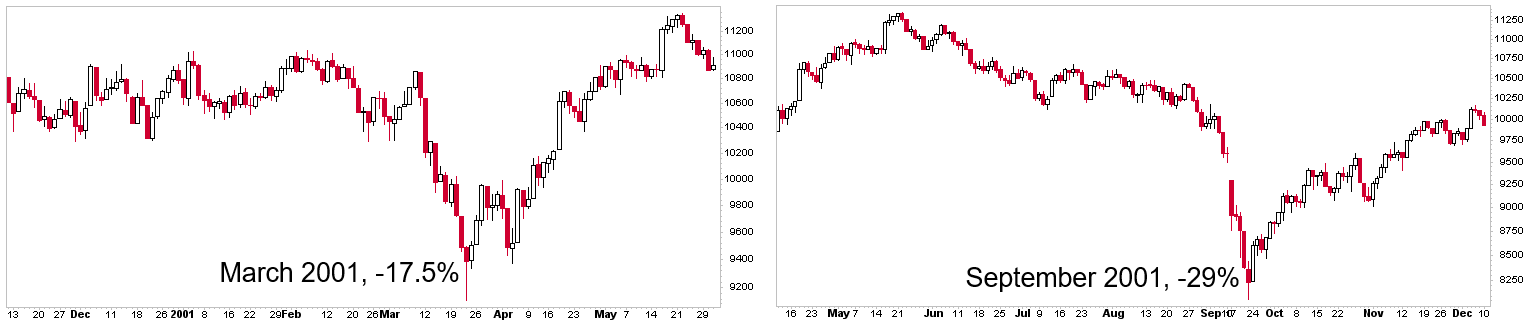
The two bottoms looked quite different. The one in March gave no “all clear” as opposed to the hammer in October that gave buyers something to trade against.

The Dow only fell 7% in 2001, again giving little insight into what was happening in the market, the economy, or our country. There were two 4% gains in 2001. The first one was in April, the second one was in September, one day after the bottom.
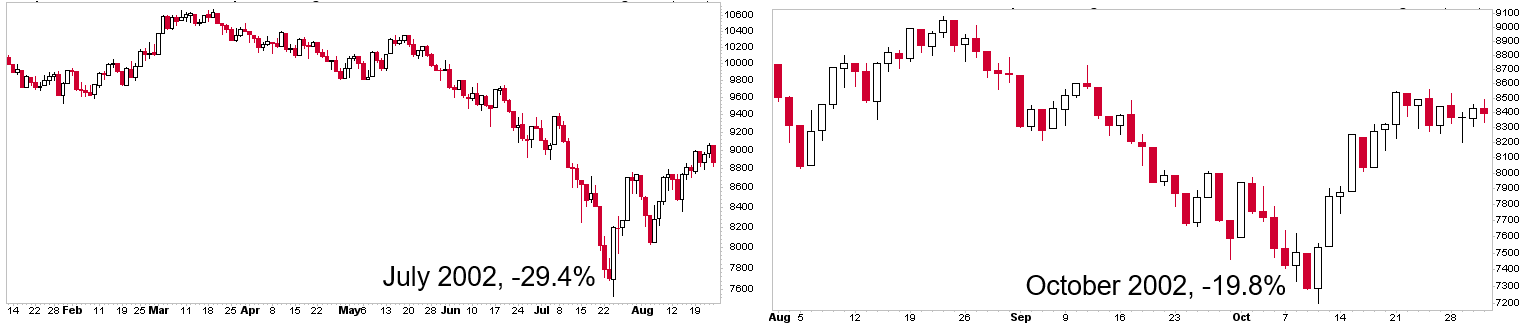
The Dow lost nearly 17% in 2002, but again, the experience felt way worse. If you were actually alive, you had two bear markets that year.
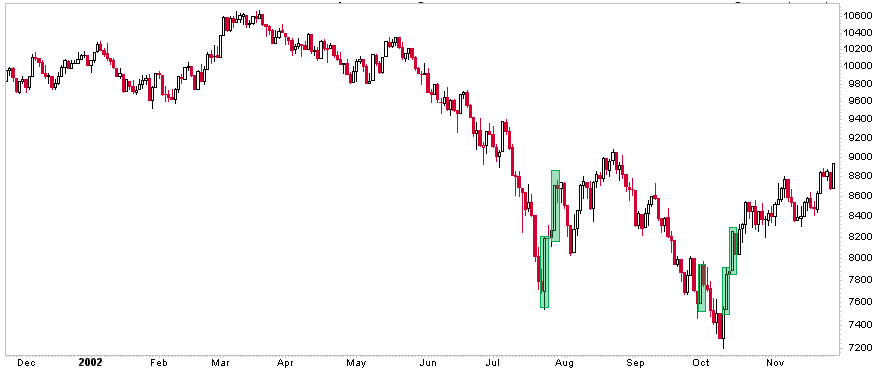
Each temporary bottom experienced “everybody back in the pool” moments. These +4% days are in green.
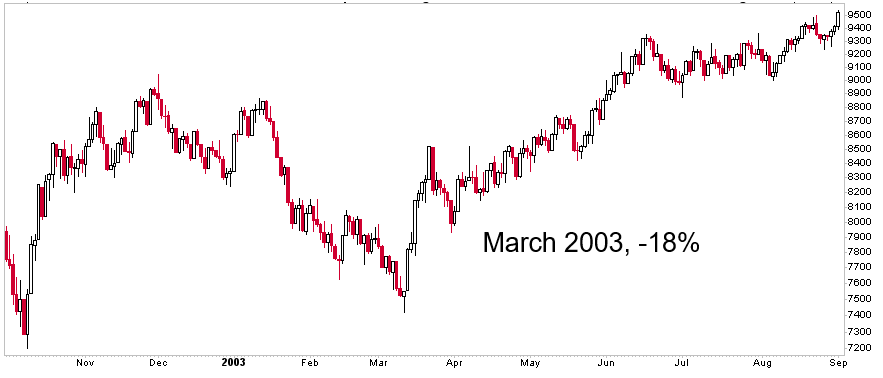
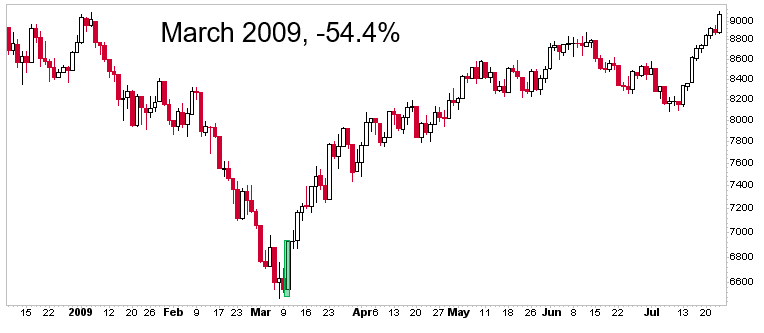
As the old saying goes, the seventh time is a charm. The March bottom never undercut the October lows, but there was one final -18% scare just to make sure investors wouldn’t be buying stocks any time soon.
There were nine +4% days in 2008, lending credence to the idea that “this is not how markets bottom.”
But in 2009, that is exactly how it bottomed. On March 10th, the Dow gained 5.8%.
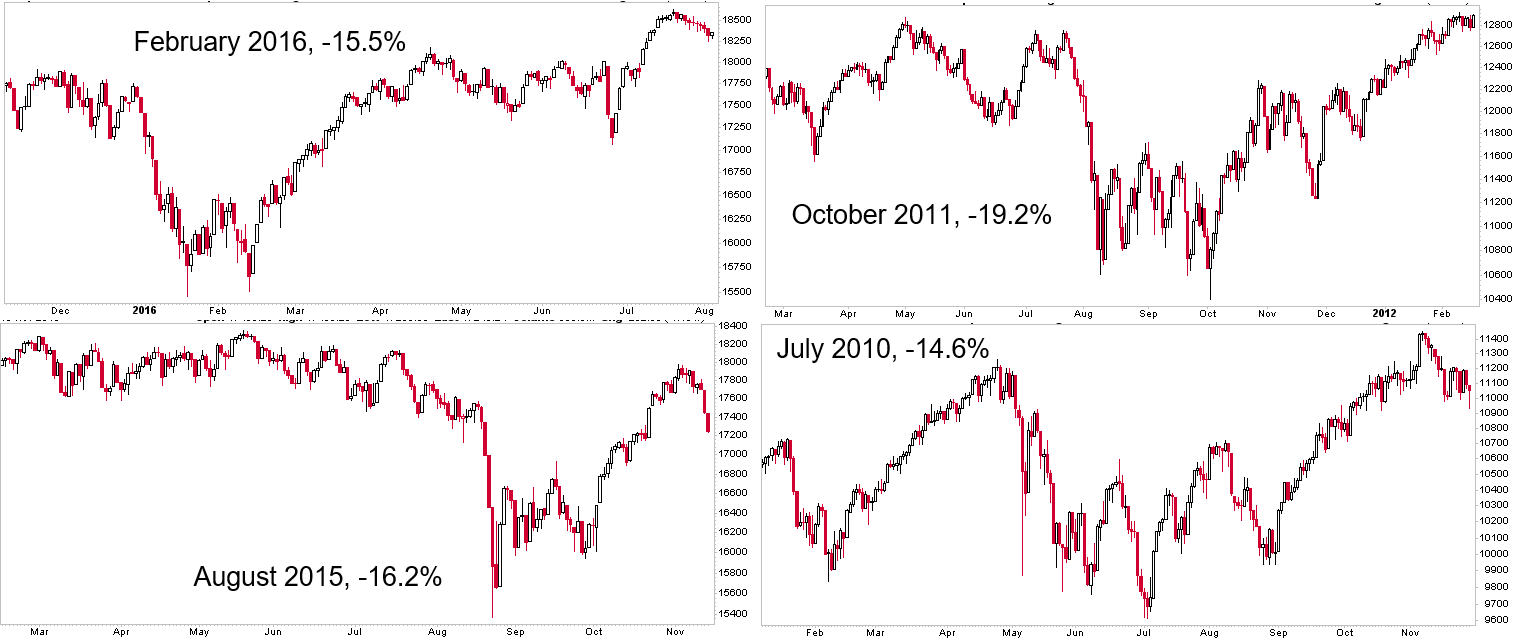
We’ve seen our fair share of bottoms since the bottom in 2009. None of these were obvious at the time. At least not to me.
Looking back on all these bottoms reinforces a few things I believe:
- It’s hard to make money in the stock market. Particularly if you’re a trader or a long-term investor.
- There are no rules for how the market bottoms. Stocks go down a lot, and then they keep going down more until they stop going down, and then they go up, sometimes a little and other times a lot.
- “The charts tell a plain story, but they do not indicate the future.” -William Biggs (father of Barton)