

Courtesy of Chris Kimble
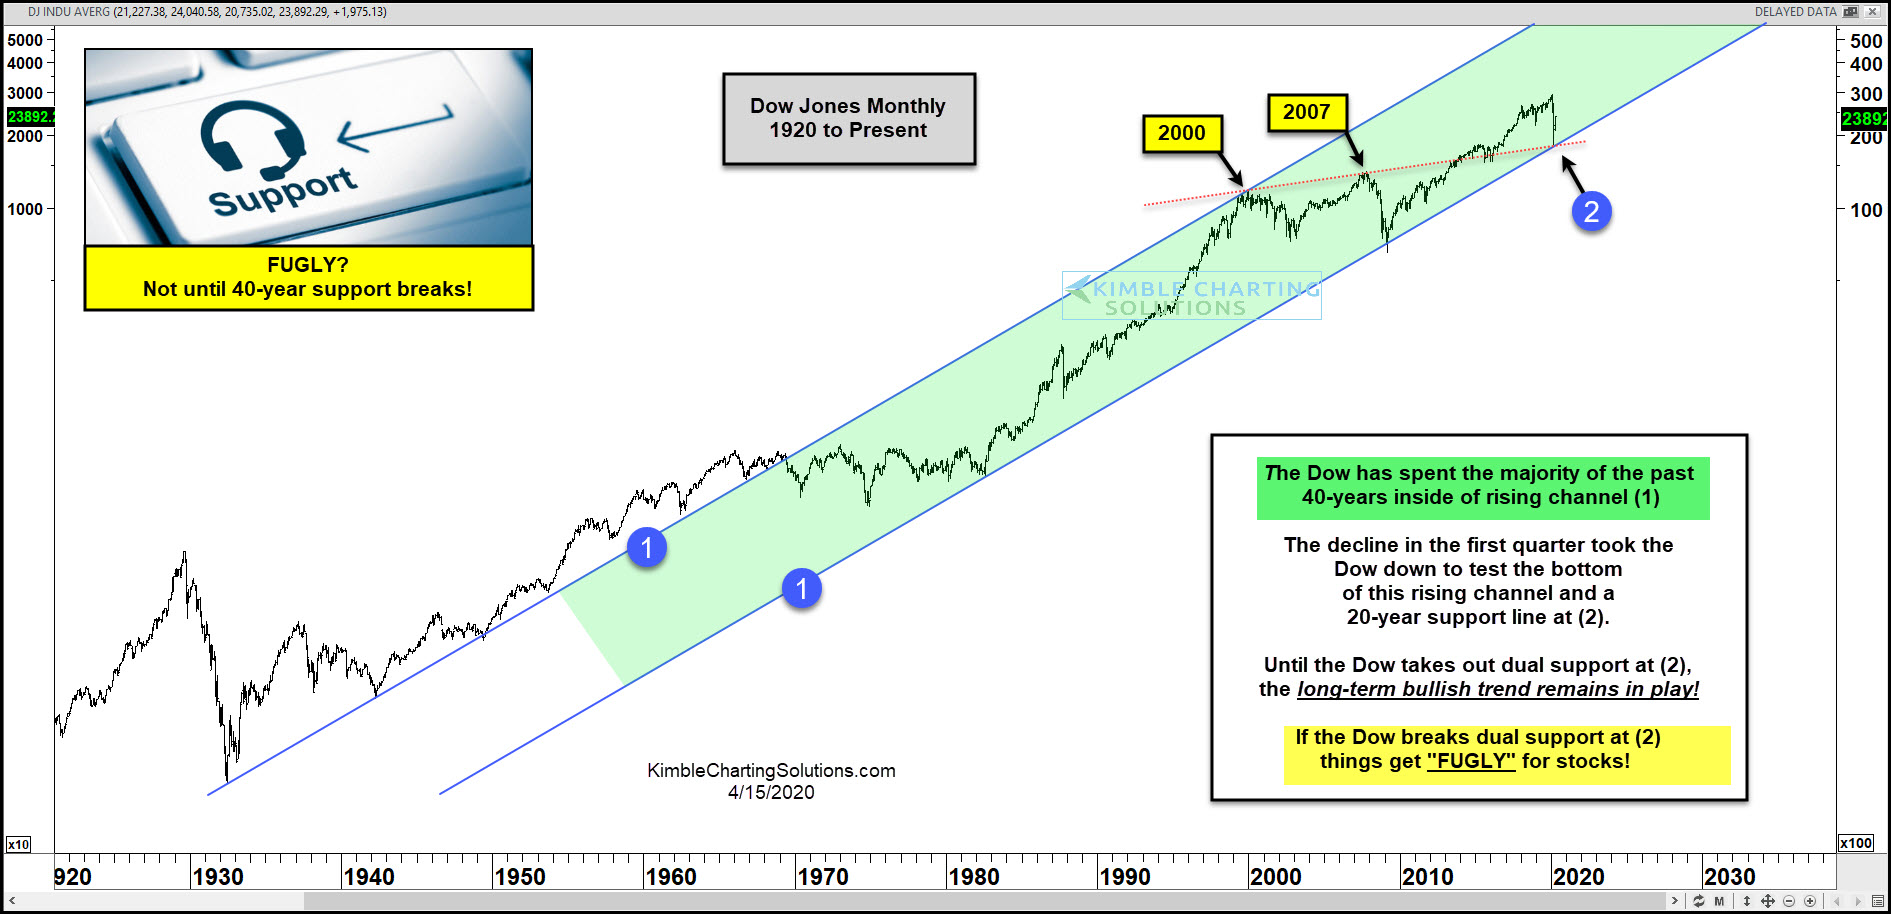
The Dow Jones Industrial Average fell nearly 40 percent during the March market crash. But it seemed to recover from a familiar technical price level.
In today’s chart, we highlight a key confluence of support where the Dow Industrials reversed higher off of… and why it needs to hold.
The March low took place right at the lower edge of the 40-year up-trend support channel, formed by each (1). This support level was fortified by another trend line that is marked by the 2000 and 2007 market tops at (2). Needless to say, the bulls need this support to continue to hold, which it has so far.
The bottom line, the long-term trend DID NOT break of late.
If 40-year support breaks at (2), odds are high, things get FUGLY for the Dow and the broad markets!!!
This article was first written for See It Markets.com. To see the original post CLICK HERE.

Are we headed towards an economic depression or has the majority been fooled and the lows are already in play?
See our thoughts in this video and how to take advantage of our 40-year anniversary special.
To become a member of Kimble Charting Solutions, click here.