

Courtesy of Chris Kimble
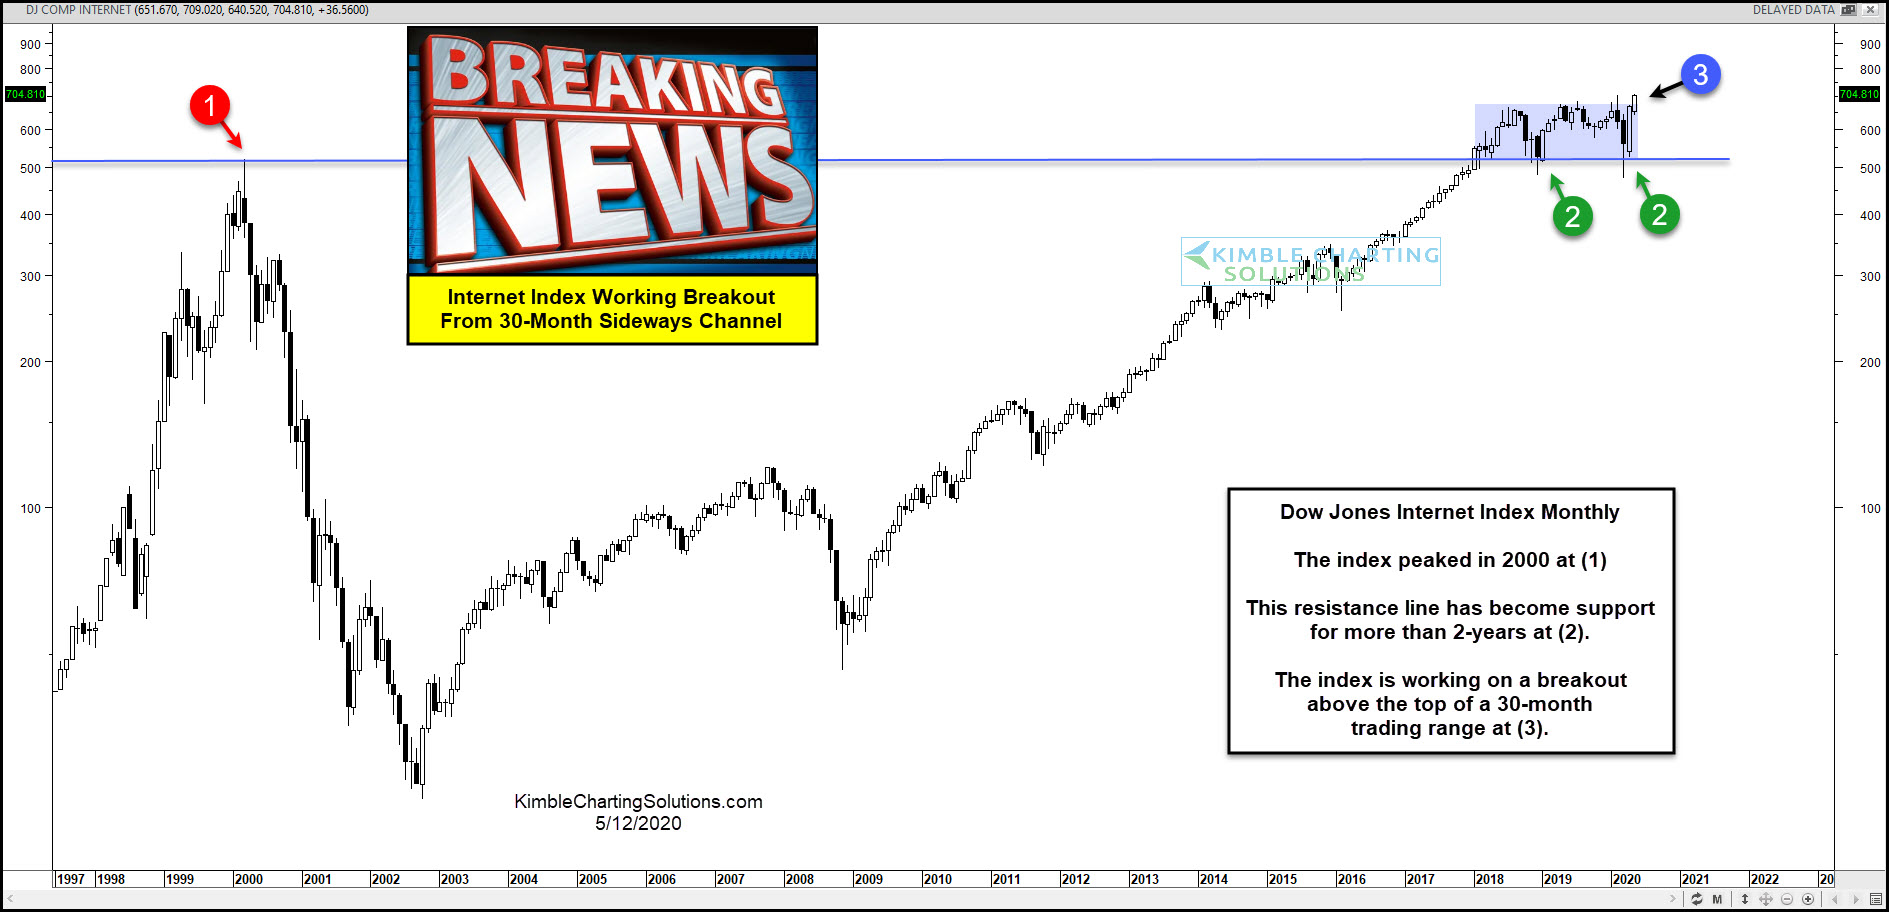
While many stock indices are well below highs from earlier this year, one index is attempting a breakout from a 30-month trading range!
This chart looks at the Dow Jones Internet index on a monthly basis over the past 23-years.
The index peaked in 2000 at (1), before declining over 90% in just 2-years. Since 2002, the index has created a series of higher lows and higher highs.
The index broke above the 2000 highs in January of 2018. Since it climbed above the 2000 highs, the index has traded sideways inside of the blue shaded rectangle.
While trading sideways, it tested old resistance as new support at each (2), where monthly bullish reversal patterns took place.
This month the index is working on a bullish breakout above the top of its 30-month trading range at (3).
To become a member of Kimble Charting Solutions, click here.