

Courtesy of Chris Kimble
If one thing is true about this crazy bull market, it’s that technology stocks have been the clear leader (and winner).
Even the coronavirus crash didn’t knock out the tech sector.
The Nasdaq Composite and Nasdaq 100 have come racing back and are the only major US stock market indices to make new highs.
Looking at today’s chart, it’s clear that investors continue to rotate funds to large-cap technology stocks on any broad market weakness.
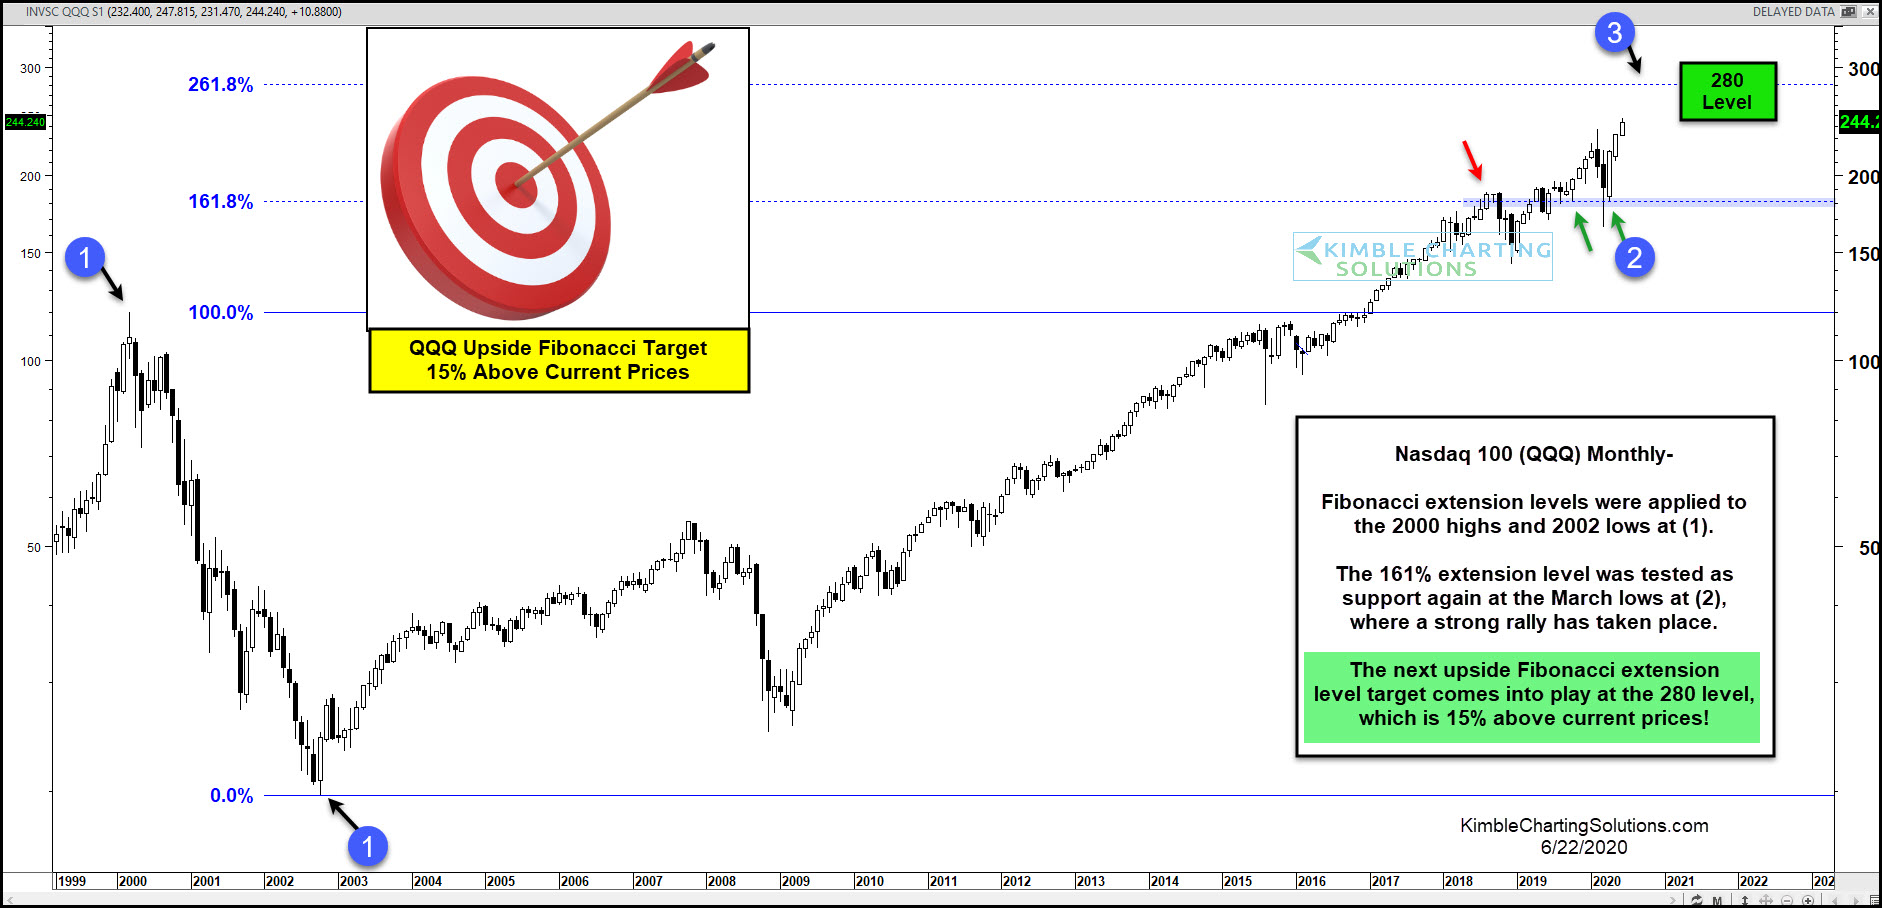
So how much further could this rally “leg” go (on a longer-term basis)? The “monthly” chart above uses the 2000 high and 2002 low at each (1) to highlight key Fibonacci extension price targets.
The 161.8 Fibonacci price target was hit in 2018 and acted as a price magnet for several months. But that is now in the rearview and the 261.8 Fibonacci may be the next long-term price target.
If so, that’s still 15 percent higher than current prices. Stay tuned!
This chart was first published on See It Markets.com. To see the original post CLICK HERE.
To become a member of Kimble Charting Solutions, click here.