

Courtesy of Chris Kimble
It’s been a heck of a year for Gold. But the year isn’t over yet and precious metals investors are hoping it will close the year out strong. That may depend on what happens in the coming days/weeks.
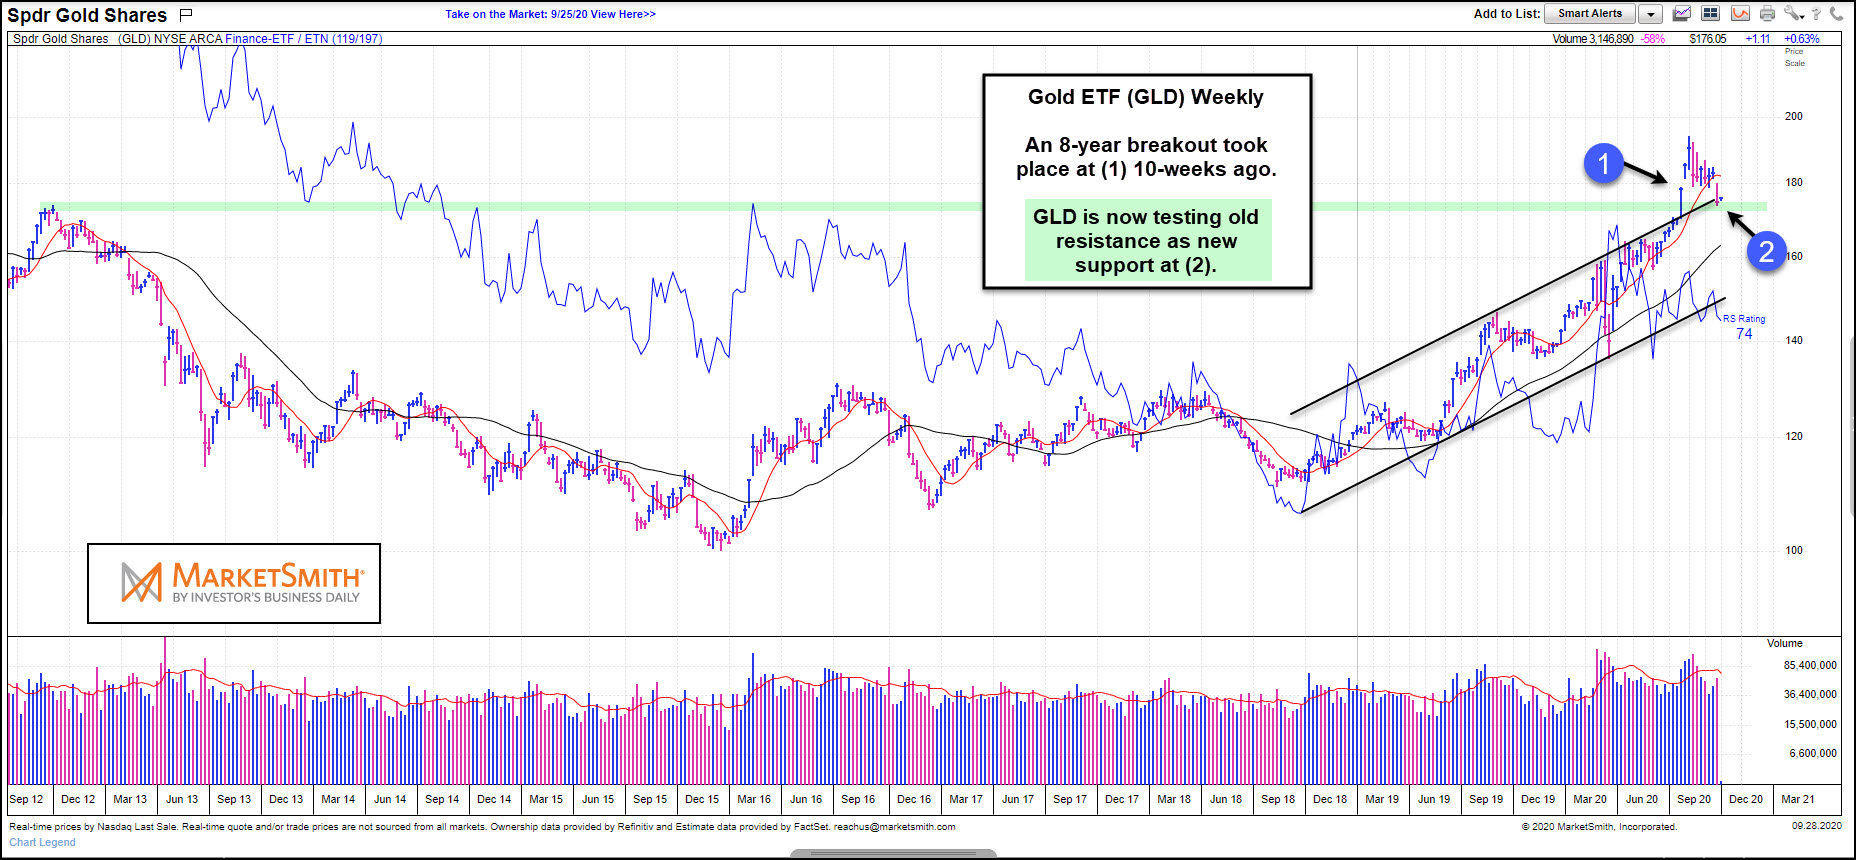
In today’s article, we feature a “weekly” chart of the Gold ETF (GLD), highlighting its strong up-trend channel and summer breakout to new all-time highs at (1), from Marketsmith.com.
Recently, I provided an update on why Gold could be headed to $3,000 before this new bull market is over.
But as investors are aware, not all breakouts are created equally. Some breakout and run higher, some breakout and back-test support before heading higher, while other breakouts simply fail.
The past several weeks have seen Gold prices pullback to test breakout support at (2). This price area is critically important as old resistance (upper trend line and prior all-time highs) has become new support.
Bulls would love to see a rally take place off this dual support test.
This article was first written for See It Markets.com. To see the original post CLICK HERE.
To become a member of Kimble Charting Solutions, click here.