

There’s Always a Chart
Courtesy of Michael Batnick
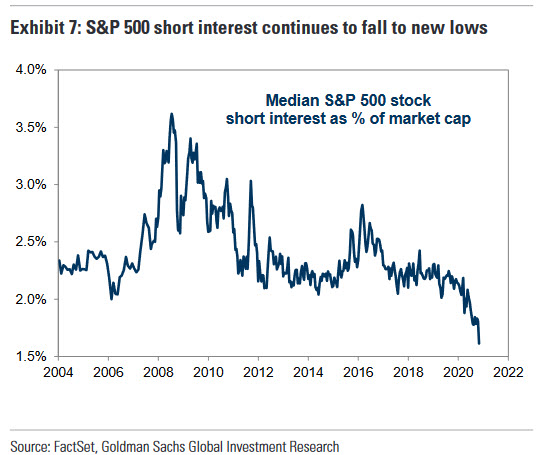
If you’re looking for evidence that shorts have thrown in the towel, and therefore now’s the time to get cautious, there’s a chart for that.
If you’re looking for evidence that actually, an absence of bears doesn’t mean an overwhelming amount of bulls, there’s a chart for that too.
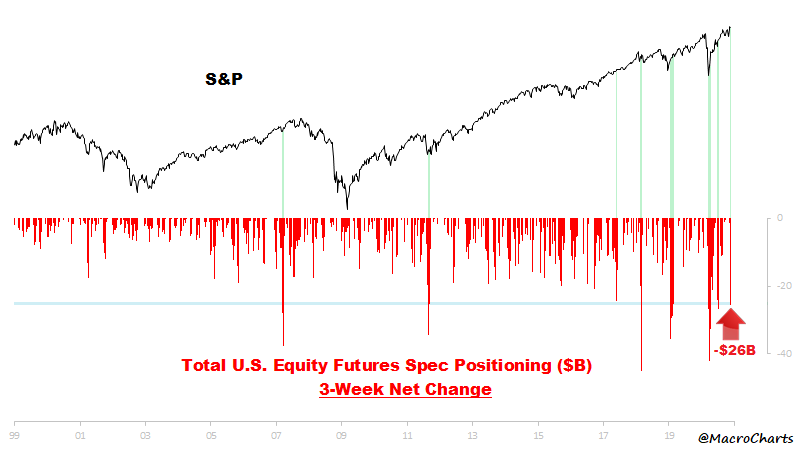
In this tweet from @MacroCharts, he writes:
“Equity Futures traders have cut exposure aggressively – even as $SPX broke to new highs. The 3-week positioning change is one of the most negative in history – only seen at bottoms, and once when the market was at a high (2017).”
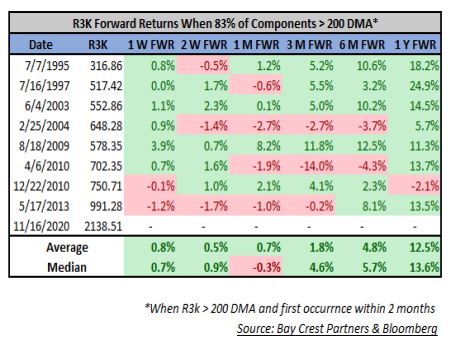
If you’re looking for evidence that strong breadth is bullish and not bearish, you guessed it; there’s a chart for that too. Here’s Jonathan Krinsky in his note from over the weekend.
“We have seen a handful of similar ‘booster shots’ over the last 25 years and while the near-term returns have been mixed, the important aspect is that none of them marked a meaningful market top.”
If you’re looking for something to confirm your view, you’re going to find it. Whether it’s a data point that supports your ideas or a contra data point that negates it, thereby making you even more confident, then you’re going to find that too.
We’re all guilty of seeing the world as we want it to be. It’s hard to hack our software, no matter how many Charlie Munger quotes you throw out there. “Invert, always invert” seems like a logical one here. The best we can do is make sure that we never rely on a single data point to tell an entire story.