

Courtesy of Chris Kimble
Precious metals caught lightning in a bottle for the first 7 months of the year, with Gold notching new all-time highs and Silver making to multi-year highs in August. But both have reversed lower since peaking in August and investors should pay attention.
It might be nothing… or it might be something! Especially for Silver, which didn’t follow Gold’s lead in making all-time highs.
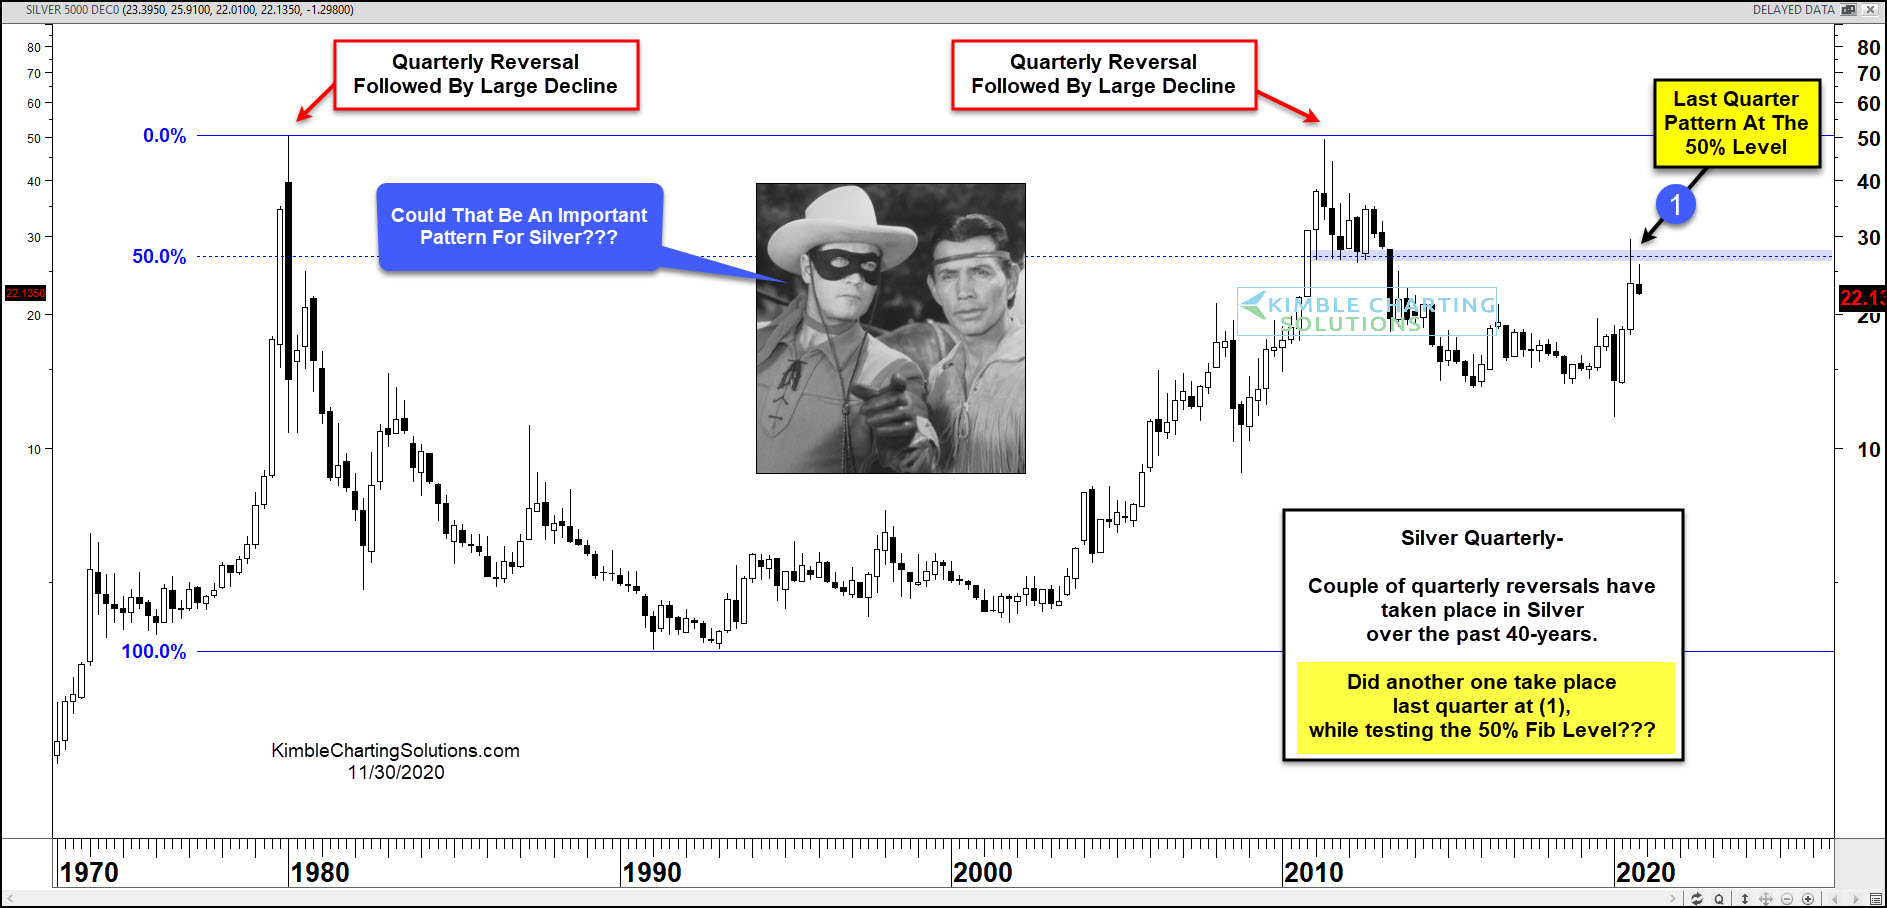
Today’s chart is a long-term “monthly” chart of Silver. As you can see, it was hi-yo Silver for the first 7 months of this year… that is, until the shiny metal reached it’s 50 percent Fibonacci retracement level in early August (during the 3rd quarter). This level is highlighted by the blue-shaded line at (1). From there, the price of Silver reversed lower creating a quarterly reversal bar. And this has been followed by additional selling this quarter.
History tells us that quarterly reversal patterns for Silver can be foreboding, with the two largest patterns happening at all-time highs and producing major selloffs. Will this lead to another big selloff?
This article was first written for See It Markets.com. To see the original post CLICK HERE.
To become a member of Kimble Charting Solutions, click here.