

Courtesy of Chris Kimble
The Dow Jones Industrial Average has survived several market scares over the past 5 decades, including the 1987 crash (Black Monday), Tech Bubble, Financial Crisis, and Coronavirus crash.
In a very noisy, news-driven world, sometimes it pays to simply zoom out on the charts and stop thinking about trading every headline.
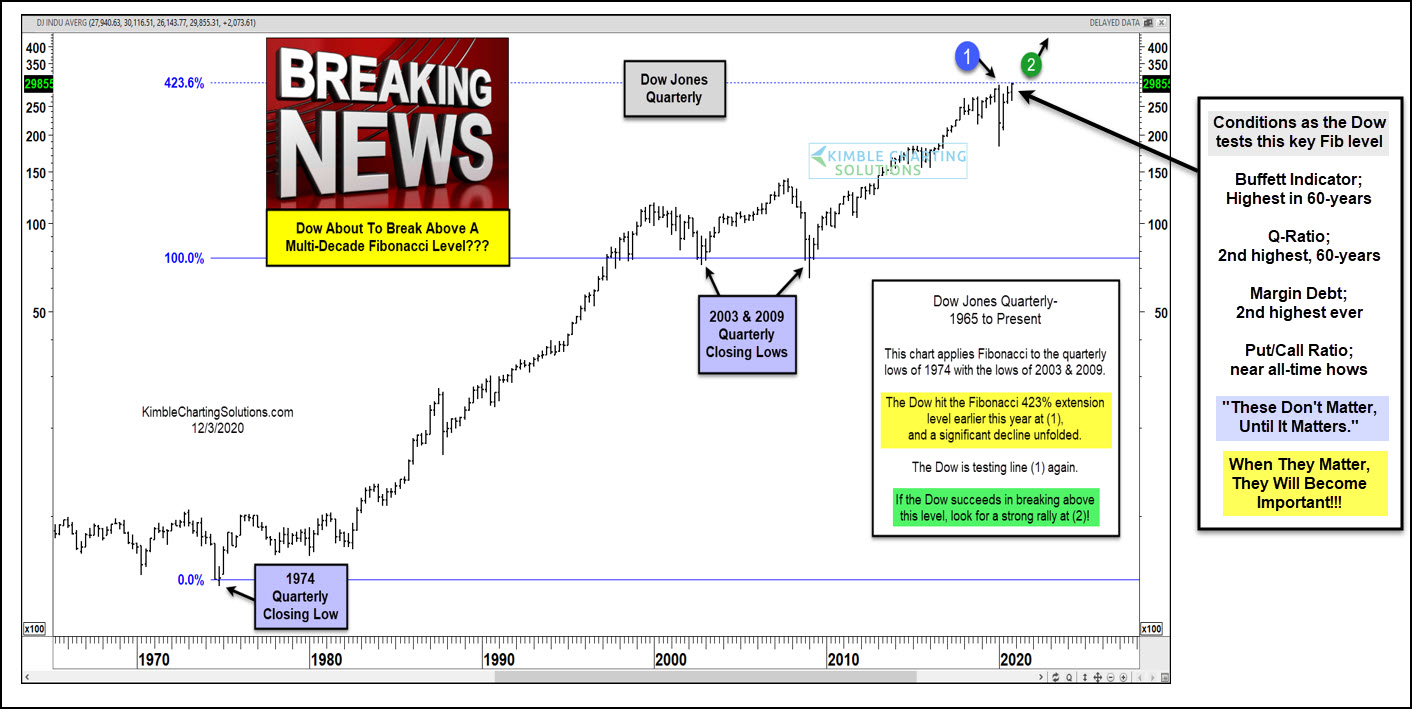
Today’s chart is a “quarterly” chart of the Dow Jones Industrial Average (spanning the past 50 years). It includes some relevant Fibonacci price levels for active investors to consider; we apply Fibonacci to the quarterly lows of 1974 and the lows of 2003 and 2009 (that being 100%).
Note that the Dow Industrials hit the 423% Fibonacci price extension earlier this year at (1) – roughly 30,000. Note as well that a significant decline followed. The Dow Industrials are testing this level again right now.
If the Dow Industrials succeeds in breaking above 30000 (on a quarterly closing basis) it could signal a super breakout and much higher prices as indicated by point (2).
The box to the right reflects a few extremes that are in play, as the Dow is testing this multi-decade Fibonacci extension level.
As mentioned in the box, these conditions don’t matter, until they matter.
Will they matter sometime? Guaranteed they will somewhere down the line!
This article was first written for See It Markets.com. To see the original post CLICK HERE.
To become a member of Kimble Charting Solutions, click here.